. 2022 Aug 6;7(1):ysac010.
doi: 10.1093/synbio/ysac010. eCollection 2022.

Multicolor plate reader fluorescence calibration

Affiliations

Multicolor plate reader fluorescence calibration

Jacob Beal et al. Synth Biol (Oxf). .

Abstract

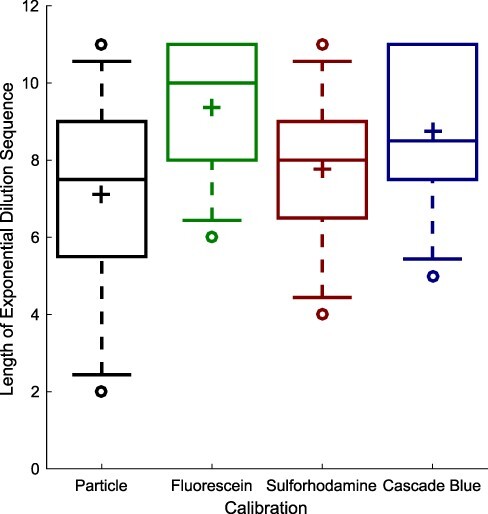
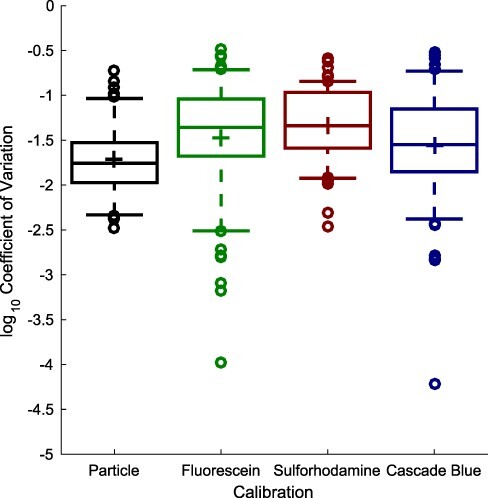
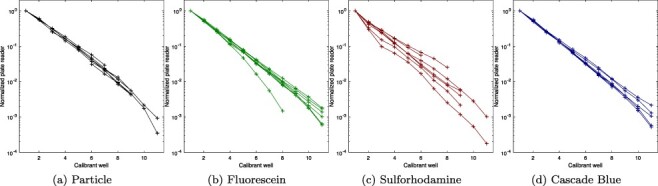
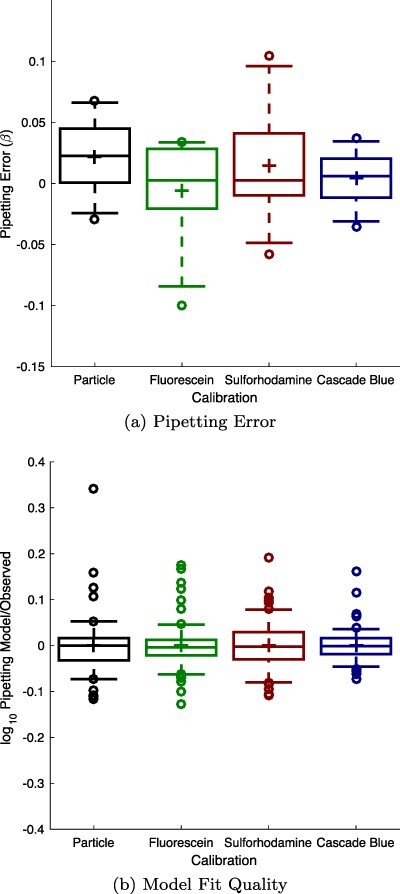
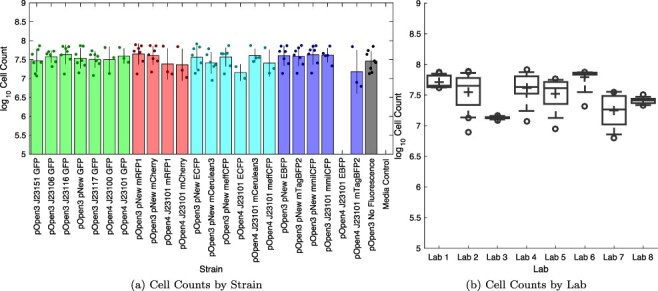
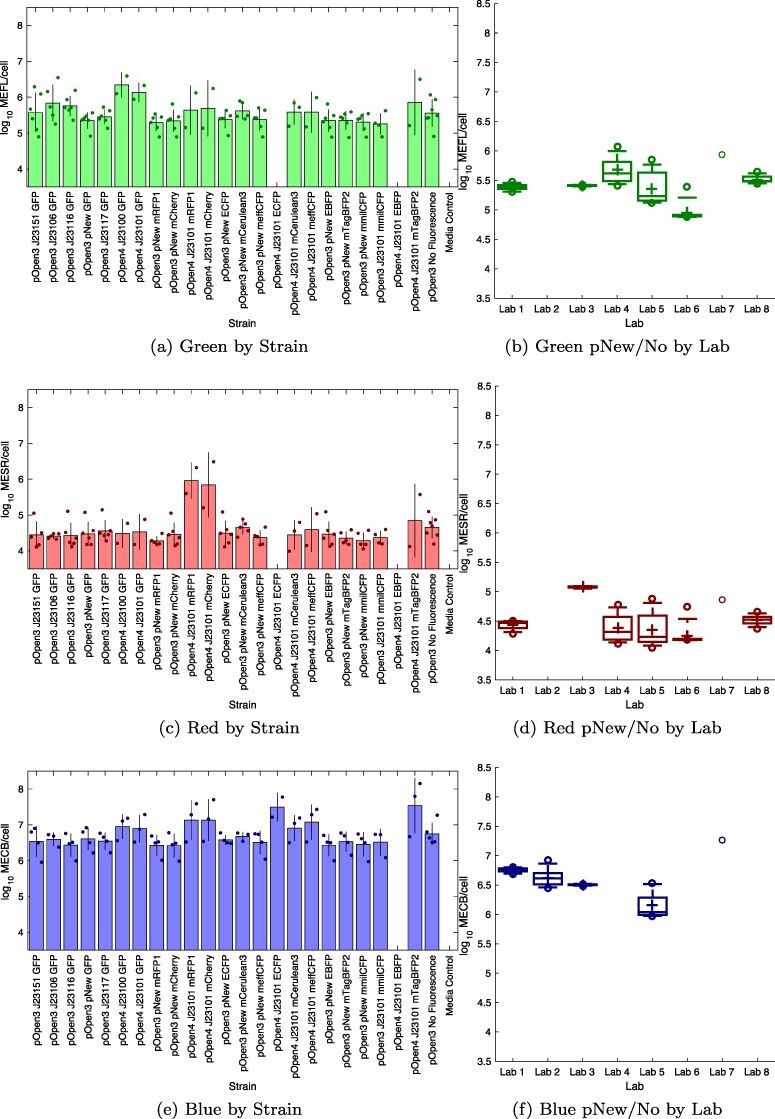
Plate readers are commonly used to measure cell growth and fluorescence, yet the utility and reproducibility of plate reader data is limited by the fact that it is typically reported in arbitrary or relative units. We have previously established a robust serial dilution protocol for calibration of plate reader measurements of absorbance to estimated bacterial cell count and for green fluorescence from proteins expressed in bacterial cells to molecules of equivalent fluorescein. We now extend these protocols to calibration of red fluorescence to the sulforhodamine-101 fluorescent dye and blue fluorescence to Cascade Blue. Evaluating calibration efficacy via an interlaboratory study, we find that these calibrants do indeed provide comparable precision to the prior calibrants and that they enable effective cross-laboratory comparison of measurements of red and blue fluorescence from proteins expressed in bacterial cells.

Keywords: calibration; cell count; fluorescence; units.


Figures

Figure 1.
Figure 1.
Serial dilution of sulforhodamine 101 and Cascade Blue calibrants is able to produce dilution sequences with an exponential decrease in value across a similarly large range of measurement as for fluorescein and silica particles. Each box summarizes data from the eight labs passing quality control criteria: plus indicates geometric mean, center line indicates median, top and bottom edges indicate 25th and 75th percentiles, and whiskers extend from 9–91%.
Figure 2.
Figure 2.
Coefficient of variation for calibrant replicate sets (two replicates each) shows sulforhodamine 101 and Cascade Blue replicate sets have similar levels of consistency that to fluorescein and silica particles. In each box, plus indicates geometric mean, center line indicates median, top and bottom edges indicate 25th and 75th percentiles, and whiskers extend from 9–91%.
Figure 3.
Figure 3.
Geometric mean for calibrant replicate sets (two replicates each), normalized to dilution level, shows tightly clustered exponential decrease for most calibrants in most labs.
Figure 4.
Figure 4.
Model fitting for sulforhodamine 101 and Cascade Blue finds no notable difference in either the pipetting error observed (a) or the fit quality of the resulting model, shown from the plot of the residual between the fitted response and the experimental data (b). In each box, plus indicates geometric mean, center line indicates median, top and bottom edges indicate 25th and 75th percentiles, and whiskers extend from 9–91%.
Figure 5.
Figure 5.
Samples showing estimate cell count for all replicate sets above formula image cell minimum growth threshold (section 2), sorted by strain (a) or by laboratory (b). Bars show mean and ±1 standard deviation for each calibrant; dots show values for individual replicate sets. In each box, plus indicates geometric mean, center line indicates median, top and bottom edges indicate 25th and 75th percentiles, and whiskers extend from 9–91%. The value for each replicate set is computed as the geometric mean over 2–4 replicates, depending on exclusions, with per-set exclusion information found in Supplementary 3-Data Digests.
Figure 6.
Figure 6.
Fluorescence per cell for each strain with at least two valid replicate sets; blank columns indicate strains without sufficient valid sets: (a) four of the six constitutive GFP strains express green fluorescence above background, (c) J23101 mRFP1 and J23101 mCherry strains show strong red fluorescence, (e) J23101 ECFP and J23101 mTagBFP2 strains appear to express blue fluorescence above background, while several other strains are ambiguous. Bars show mean and ±1 standard deviation for each calibrant; dots show values for individual replicate sets; blank columns indicate strains with <2 valid. Fluorescence per cell for each laboratory for all non-fluorescent and pNew strains with at least two valid replicate sets is shown for (b) green, (d) red and (e) blue fluorescence. In each box, plus indicates geometric mean, center line indicates median, top and bottom edges indicate 25th and 75th percentiles, and whiskers extend from 9–91%. Blank columns indicate laboratories without sufficient valid sets. The value for each replicate set is computed as the geometric mean over 2–4 replicates, depending on exclusions, with per-set exclusion information found in Supplementary 3-Data Digests.

References

    1. Auld D.S., Coassin P.A., Coussens N.P., Hensley P., Klumpp-Thomas C., Michael S., Sitta Sittampalam G., Joseph Trask O., Wagner B.K. and Weidner J.R.. et al. (2020) Microplate selection and recommended practices in high-throughput screening and quantitative biology. Assay Guidance Manual [Internet].
    1. Beal J. (2017) Biochemical complexity drives log-normal variation in genetic expression. Eng. Biol., 1, 55–60.doi: 10.1049/enb.2017.0004. - DOI
    1. Beal J., Baldwin G.S., Farny N.G., Gershater M., Haddock-Angelli T., Buckley-Taylor R., Dwijayanti A., Kiga D., Lizarazo M. and Marken J.. et al.. (2021) Comparative analysis of three studies measuring fluorescence from engineered bacterial genetic constructs. PloS One, 16, e0252263.doi: 10.1371/journal.pone.0252263. - DOI - PMC - PubMed
    1. Beal J., Farny N.G., Haddock-Angelli T., Selvarajah V., Baldwin G.S., Buckley-Taylor R., Gershater M., Kiga D., Marken J. and Sanchania V.. et al.. (2020) Robust estimation of bacterial cell count from optical density. Commun. Biol., 3, 1–29. - PMC - PubMed
    1. Beal J., Haddock-Angelli T., Baldwin G., Gershater M., Dwijayanti A., Storch M., Kim M., Lizarazo M., Rettberg R. and the iGEM Interlab Study Contributors (2018) Quantification of bacterial fluorescence using independent calibrants. PloS One, 13, e0199432.doi: 10.1371/journal.pone.0199432. - DOI - PMC - PubMed