. 2023 May 2;119(3):772-785.
doi: 10.1093/cvr/cvac113.

Dynamics of monocyte-derived macrophage diversity in experimental myocardial infarction

Affiliations

Dynamics of monocyte-derived macrophage diversity in experimental myocardial infarction

Giuseppe Rizzo et al. Cardiovasc Res. .

Abstract

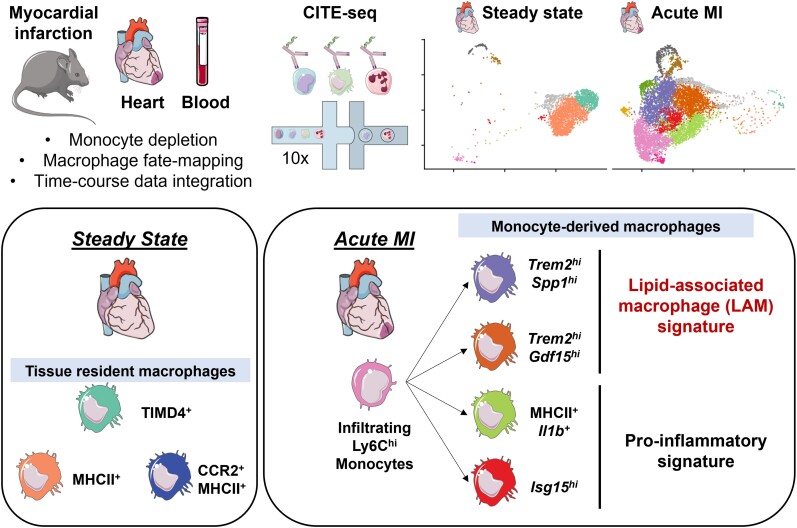
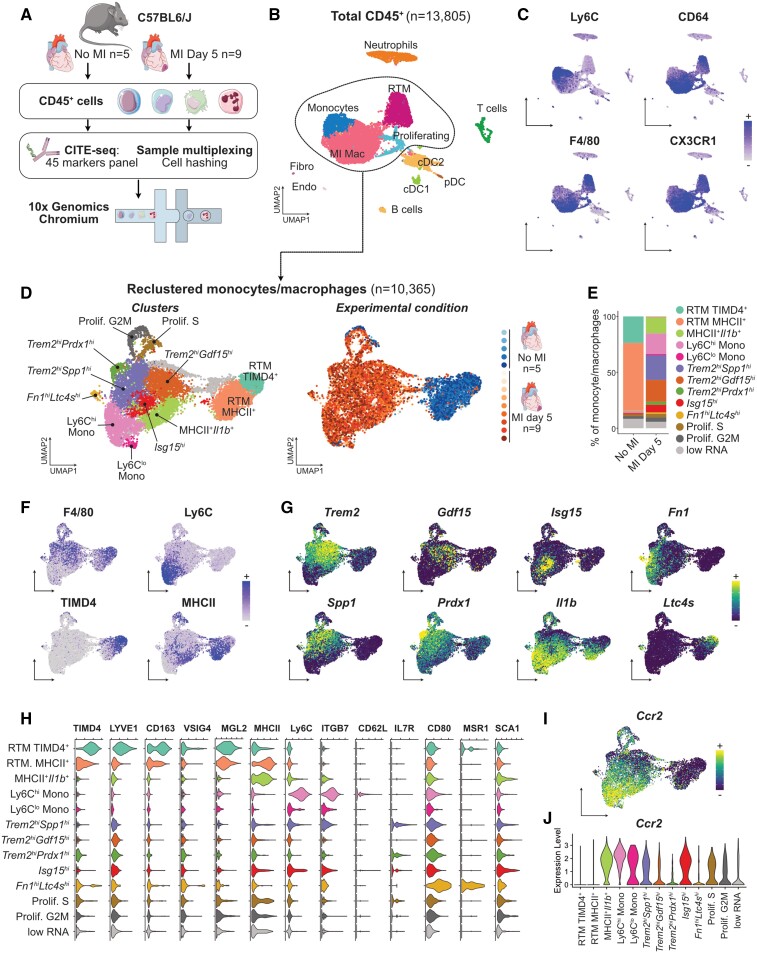
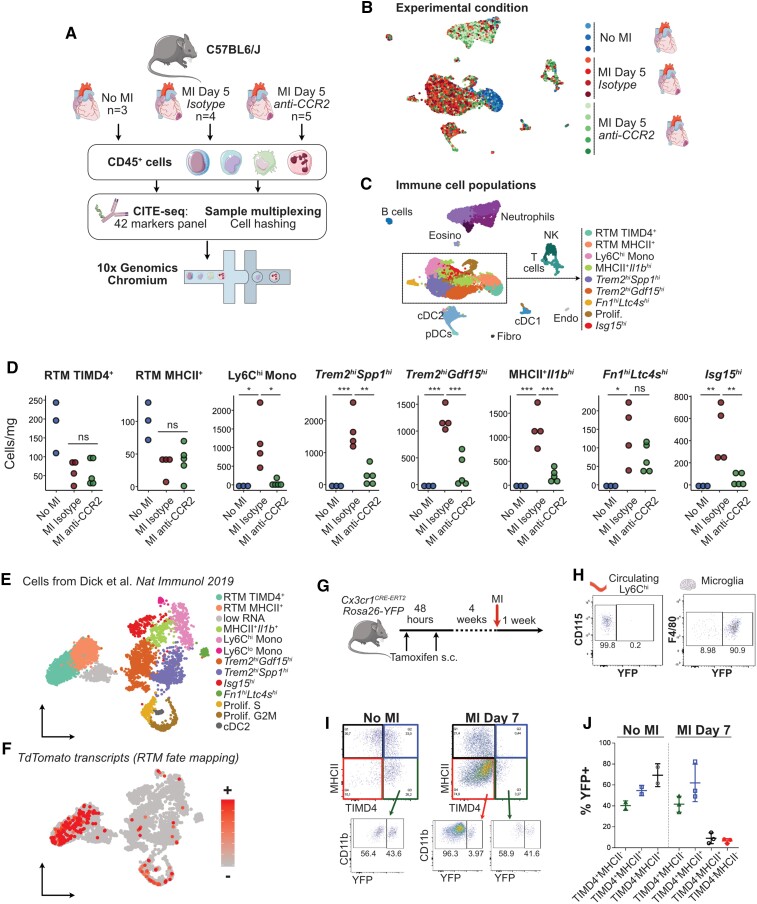
Aims: Macrophages have a critical and dual role in post-ischaemic cardiac repair, as they can foster both tissue healing and damage. Multiple subsets of tissue resident and monocyte-derived macrophages coexist in the infarcted heart, but their precise identity, temporal dynamics, and the mechanisms regulating their acquisition of discrete states are not fully understood. To address this, we used multi-modal single-cell immune profiling, combined with targeted cell depletion and macrophage fate mapping, to precisely map monocyte/macrophage transitions after experimental myocardial infarction.

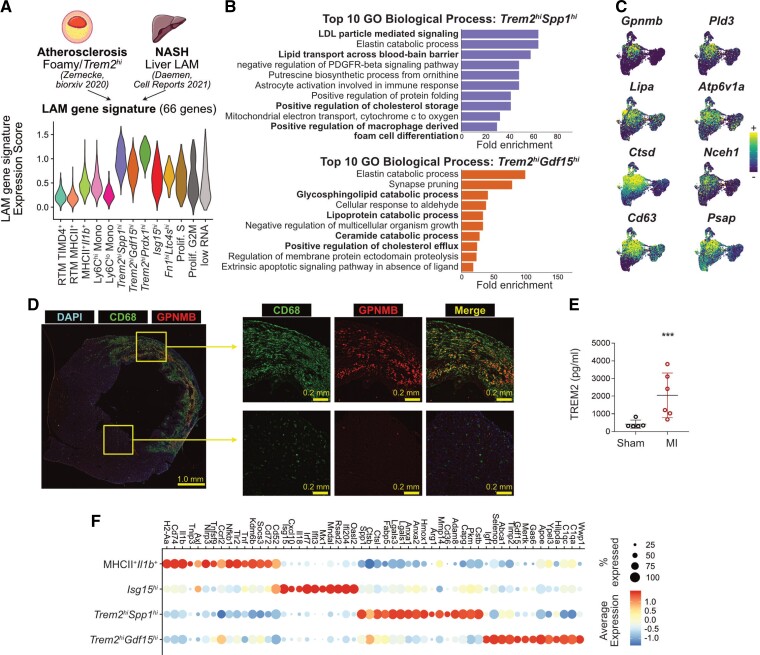
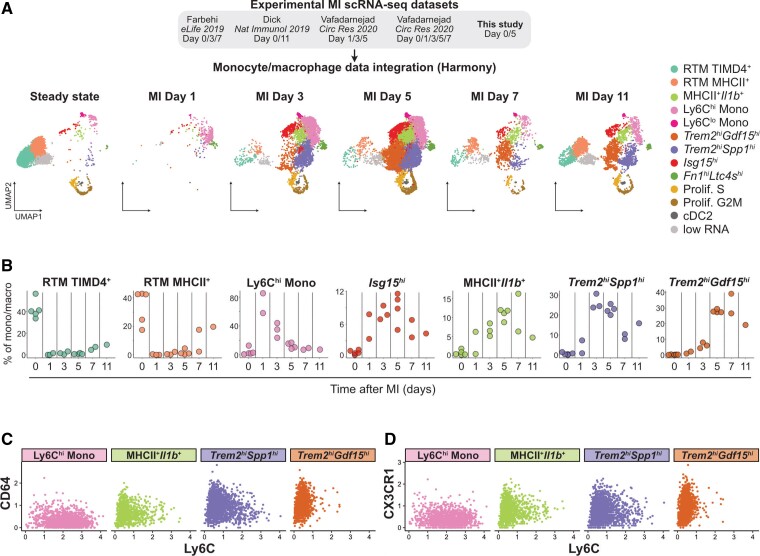
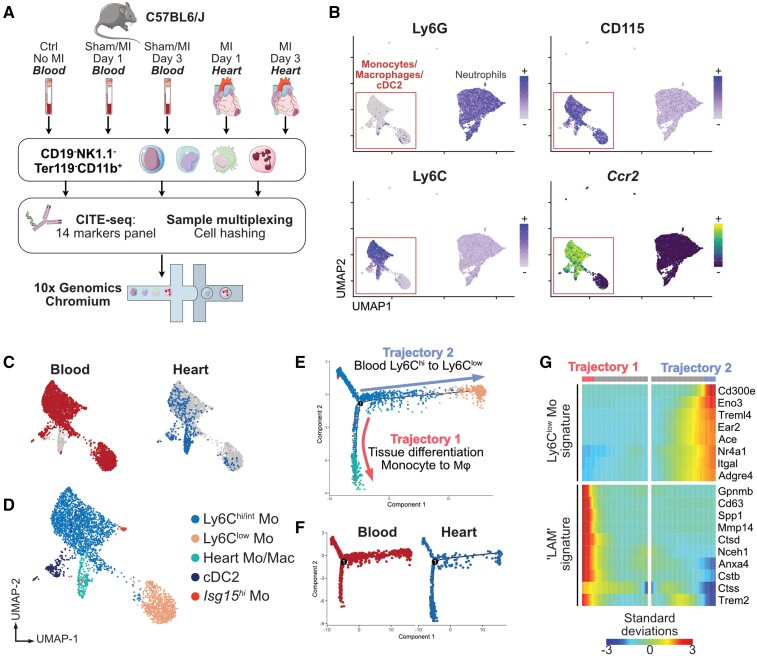
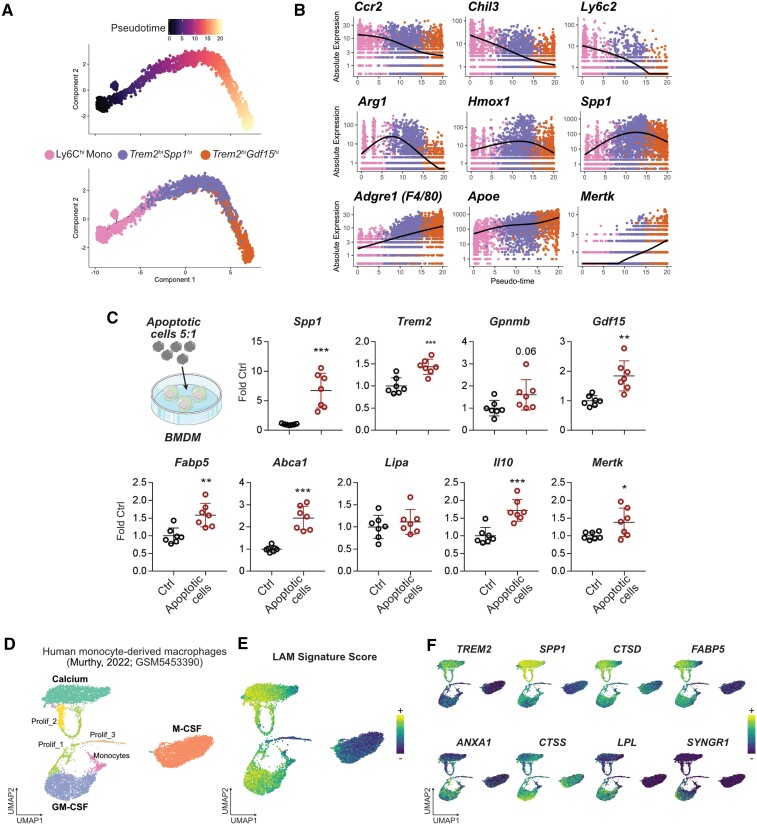
Methods and results: We performed single-cell transcriptomic and cell-surface marker profiling of circulating and cardiac immune cells in mice challenged with acute myocardial infarction, and integrated single-cell transcriptomes obtained before and at 1, 3, 5, 7, and 11 days after infarction. Using complementary strategies of CCR2+ monocyte depletion and fate mapping of tissue resident macrophages, we determined the origin of cardiac macrophage populations. The macrophage landscape of the infarcted heart was dominated by monocyte-derived cells comprising two pro-inflammatory populations defined as Isg15hi and MHCII+Il1b+, alongside non-inflammatory Trem2hi cells. Trem2hi macrophages were observed in the ischaemic area, but not in the remote viable myocardium, and comprised two subpopulations sequentially populating the heart defined as Trem2hiSpp1hi monocyte-to-macrophage intermediates, and fully differentiated Trem2hiGdf15hi macrophages. Cardiac Trem2hi macrophages showed similarities to 'lipid-associated macrophages' found in mouse models of metabolic diseases and were observed in the human heart, indicating conserved features of this macrophage state across diseases and species. Ischaemic injury induced a shift of circulating Ly6Chi monocytes towards a Chil3hi state with granulocyte-like features, but the acquisition of the Trem2hi macrophage signature occurred in the ischaemic tissue. In vitro, macrophages acquired features of the Trem2hi signature following apoptotic-cell efferocytosis.

Conclusion: Our work provides a comprehensive map of monocyte/macrophage transitions in the ischaemic heart, constituting a valuable resource for further investigating how these cells may be harnessed and modulated to promote post-ischaemic heart repair.

Keywords: Inflammation; Macrophage; Monocyte; Myocardial infarction; Single-cell RNA-seq.


Conflict of interest statement

Conflict of interest: C.H. collaborates with Denali Therapeutics, participated on one advisory board meeting of Biogen, and received a speaker honorarium from Novartis and Roche. C.H. is chief advisor of ISAR Bioscience and a member of the advisory board of AviadoBio.

Figures

Graphical abstract
Graphical abstract
Figure 1
Figure 1
CITE-seq analysis of the monocyte/macrophage landscape in the steady-state and infarcted heart. For all graphs in this figure, cells were obtained from n = 5 mice without MI, and n = 9 mice with MI, pooled from two independent experiments (see Section 2). (A) Experimental design summary; (B) UMAP representation of transcriptome-based clustering of n = 13 805 total cardiac CD45+ cells; (C) CITE-seq signal for the indicated monocyte/macrophage surface markers projected onto the total CD45+ cells UMAP plot; (D) n = 10 365 cells corresponding to monocytes and macrophages (including proliferating macrophages) were extracted for clustering and UMAP dimensional reduction analysis with annotated cell clusters (left) and sample of origin colour coded on the UMAP plot (right); (E) average proportions of each cluster according to experimental condition; (F) surface markers and (G) transcript expression projected onto the UMAP plot for selected markers used to identify and annotate clusters; (H) expression of the indicated surface markers in each monocyte/macrophage cluster; (I and J) expression of Ccr2 projected on the UMAP plot of monocyte/macrophages (I) and shown across clusters (J). RTM, resident tissue macrophages; MI Mac, MI-associated macrophages; (p)DC, (plasmacytoid) dendritic cell; Endo, endothelial cells; Fibro, fibroblasts.
Figure 2
Figure 2
Identification of Trem2hi macrophages with a LAM signature in the ischaemic myocardium. (A) Sixty-six LAM-signature genes were extracted from the indicated data sets and a gene expression score was applied to cardiac macrophages (LAM-signature expression score), represented here as a violin plot. The atherosclerosis data set consists of a pool of n = 12 scRNA-seq data sets (see Zernecke et al.); the NASH data set of one scRNA-seq library (Daemen et al.); the LAM-signature expression score was applied to cardiac macrophages (n = 10 365 cells; cells were obtained from n = 5 mice without MI, and n = 9 mice with MI, pooled from two independent experiments, see Figure 1, see Section 2). (B) Fold enrichment for the top 10 enriched Gene Ontology (GO) Biological Processes in the indicated cardiac macrophage cluster (all with adjusted P-value <0.05); macrophage clusters were determined in analysis shown in Figure 1D from n = 10 365 cells; cells were obtained from n = 5 mice without MI, and n = 9 mice with MI, pooled from two independent experiments. (C) Expression of selected LAM-signature transcripts projected on the UMAP plot of monocytes/macrophages as detailed in Figure 1D (n = 10 365 cells; cells were obtained from n = 5 mice without MI, and n = 9 mice with MI, pooled from two independent experiments). (D) Immunofluorescence labelling of CD68 and GPNMB in Day 5 infarcts with overview of a full myocardial section and high magnification images of the infarcted area and remote non-ischaemic myocardium (representative pictures shown for n = 1 heart). (E) Total levels of TREM2 detected by ELISA in extracts from the hearts of mice after sham operation (n = 5 mice) or permanent MI (Day 5; n = 6 mice). (F) Dot plot showing expression of the selected transcripts in the indicated cardiac macrophage clusters (all the transcripts shown significantly enriched in the relevant clusters with adjusted P-value <0.05); macrophage clusters were determined in analysis shown in Figure 1D from n = 10 365 cells; cells were obtained from n = 5 mice without MI, and n = 9 mice with MI, pooled from two independent experiments. NASH, non-alcoholic steatohepatitis.
Figure 3
Figure 3
Monocyte/macrophage dynamics in the infarcted heart. (A) The indicated MI data sets were integrated using Harmony and monocyte/macrophage population identified; the resulting clustering analysis and UMAP plot are shown split according to time point after MI with monocyte/macrophage clusters colour coded; n = 24 637 total cells from n = 6 independent scRNA-seq data sets. (B) Proportion of the indicated clusters within total monocyte/macrophage over the post-MI time continuum, calculated from the integrated data set. Each data point represents proportion of the indicated cluster at the indicated time point in independent scRNA-seq libraries (see also Supplementary material online, Figure S5). (C) CITE-seq signal for Ly6C vs. CD64 and (D) Ly6C vs. CX3CR1 in the indicated cell populations (analysis in C and D performed on monocyte/macrophage clusters determined in analysis shown in Figure 1D from n = 10 365 cells; cells were obtained from n = 5 mice without MI, and n = 9 mice with MI, pooled from two independent experiments).
Figure 4
Figure 4
MI-associated macrophage populations originate from recruited CCR2+ monocytes. (A) Schematic representation of the experimental design; (B and C) UMAP representation of scRNA-seq analysis (n = 10 831 cells) with (B) sample of origin and (C) biological identity of cell clusters colour coded on the UMAP plot; (D) absolute counts of the indicated cell clusters (per mg of cardiac tissue); data shown in A–D were obtained from one experiment with n = 3 mice without MI, n = 4 mice at Day 5 after MI treated with isotype control; n = 5 mice at Day 5 after MI treated with anti-CCR2; (E) annotated UMAP plot of cells from Dick et al. (n = 5802 cells from n = 1 scRNA-seq data set from mice without MI and n = 1 scRNA-seq data sets from mice at 11 days after MI) extracted from integrated data analysis shown in Figure 3 and (F) identification of TdTomato+ fate mapped RTMs, cells ordered according to transcript detection, that is, cells with detectable transcripts moved to front of the plot; (G) experimental setup for CX3CR1-based fate mapping of tissue resident macrophages; (H) recombination controls in Ly6Chi monocytes and microglia after the 4 weeks washout period; (I and J) fate mapping of cardiac macrophages before and at 7 days post-MI, pre-gated on live CD45+CD11b+F4/80hiLy6Clow. Data shown in G–J were obtained in one experiment with n = 2 mice without MI and n = 3 mice at Day 7 after MI.
Figure 5
Figure 5
Monocytes/macrophages acquire the Trem2hi LAM signature in the ischaemic heart. (A) Experimental design overview; (B) Ccr2 transcript expression and CITE-seq signal for the indicated surface markers in blood and heart CD19NK1.1Ter119CD11b+ cells projected on the UMAP plot (n = 9848 cells); (C) tissue of origin of single cells corresponding to monocytes/macrophages/cDC2 (n = 3378 cells) projected on the UMAP plot; (D) clustering analysis and annotation of cell clusters; (E) pseudotime analysis of monocytes/macrophages in Monocle, cell identity colour-code identical to D (n = 3378 cells); (F) pseudotime analysis split according to tissue origin; (G) heatmap of pseudotime gene expression variation for selected genes on branches of the pseudotime tree (as indicated on E; n = 3378 cells; all indicated genes show statistically significant variation). All data shown in Figure 5 were obtained from n = 1 pooled cell preparation per experimental condition, grouped in a single (n = 1) multiplexed scRNA-seq data set.
Figure 6
Figure 6
Monocyte transition to Trem2hi macrophages and potential inducers of the LAM signature. (A) Pseudotime trajectory analysis of Ly6Chi monocytes, Trem2hiSpp1hi and Trem2hiGdf15hi macrophages. (B) Expression of the indicated transcripts according to pseudotime and colour coded by cell population of origin. In A and B, cells belonging to the indicated clusters (n = 4633 total cells) were extracted from the analysis shown in Figure 1D (n = 10 365 cells obtained from n = 5 mice without MI, and n = 9 mice with MI, pooled from two independent experiments). (C) Expression of the indicated transcripts in mouse bone marrow–derived macrophages (BMDM) in control condition or after overnight exposure to apoptotic cells (Apo = apoptotic thymocyte at a 5:1 apoptotic cell:macrophage ratio). Each data point represents macrophages from one mouse assayed in technical duplicates, total n = 7 per condition, pooled from two independent experiments (*P < 0.05; **P < 0.01; ***P < 0.001). (D) Reanalysis of data from Murthy et al. with UMAP of in vitro human monocyte-derived macrophages differentiated in the presence of calcium, GM-CSF or M-CSF. (E) LAM-signature score projected on the UMAP plot. (F) Expression of the indicated LAM-signature transcripts induced by calcium (top) or GM-CSF (bottom).

References

    1. Frodermann V, Nahrendorf M. Macrophages and cardiovascular health. Physiol Rev 2018;98:2523–2569. - PMC - PubMed
    1. Molawi K, Wolf Y, Kandalla PK, Favret J, Hagemeyer N, Frenzel K, Pinto AR, Klapproth K, Henri S, Malissen B, Rodewald HR, Rosenthal NA, Bajenoff M, Prinz M, Jung S, Sieweke MH. Progressive replacement of embryo-derived cardiac macrophages with age. J Exp Med 2014;211:2151–2158. - PMC - PubMed
    1. Zaman R, Hamidzada H, Epelman S. Exploring cardiac macrophage heterogeneity in the healthy and diseased myocardium. Curr Opin Immunol 2020;68:54–63. - PubMed
    1. Dick SA, Macklin JA, Nejat S, Momen A, Clemente-Casares X, Althagafi MG, Chen J, Kantores C, Hosseinzadeh S, Aronoff L, Wong A, Zaman R, Barbu I, Besla R, Lavine KJ, Razani B, Ginhoux F, Husain M, Cybulsky MI, Robbins CS, Epelman S. Self-renewing resident cardiac macrophages limit adverse remodeling following myocardial infarction. Nat Immunol 2019;20:29–39. - PMC - PubMed
    1. Bajpai G, Bredemeyer A, Li W, Zaitsev K, Koenig AL, Lokshina I, Mohan J, Ivey B, Hsiao HM, Weinheimer C, Kovacs A, Epelman S, Artyomov M, Kreisel D, Lavine KJ. Tissue resident CCR2− and CCR2+ cardiac macrophages differentially orchestrate monocyte recruitment and fate specification following myocardial injury. Circ Res 2019;124:263–278. - PMC - PubMed

Publication types

LinkOut - more resources