Comparison of spin-echo echo-planar imaging magnetic resonance elastography with gradient-recalled echo magnetic resonance elastography and their correlation with transient elastography
- PMID: 35950274
- PMCID: PMC9634917
- DOI: 10.5152/dir.2022.201014
Comparison of spin-echo echo-planar imaging magnetic resonance elastography with gradient-recalled echo magnetic resonance elastography and their correlation with transient elastography
Abstract
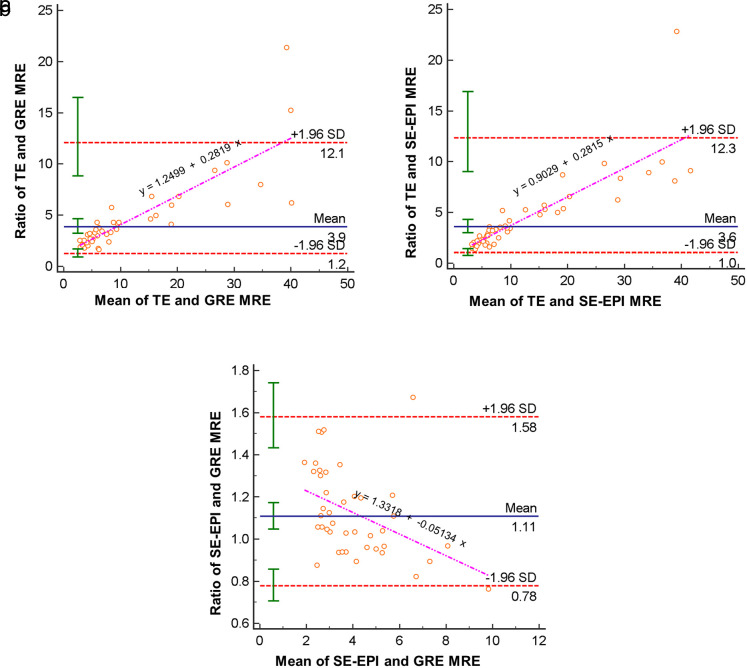
PURPOSE This study aimed to assess the agreement between liver stiffness (LS) values obtained by the gradient-recalled echo (GRE) magnetic resonance elastography (MRE) and spin-echo echo-planar imaging (SE-EPI) MRE with those of transient elastography (TE), respectively. METHODS We retrospectively included 48 participants who underwent liver MRE with both GRE and SE-EPI sequences in the same session and also TE within 1 year. We obtained LS values for MRE by drawing free-hand region of interest, and TE was performed using a FibroScan device. We assessed the relationship between the mean LS values obtained by each MRE sequence and TE using the correlation coefficients and Bland-Altman plots, respectively. We also compared LS values and technical failure rates of measured values from MRE between SE-EPI and GRE sequences using the paired t-test and McNemar's test. The MRE failure was defined as the absence of pixel value with a confidence index above 95%. RESULTS The LS values from SE-EPI and GRE sequences strongly correlated with those from TE (GRE; r = 0.73, P < .001 vs. SE-EPI; r = 0.79, P < .001). In addition, the LS values from the 2 MRE sequences showed excellent relationship (intraclass correlation coefficient, 0.94 [0.89-0.97], P < .001). The LS values from SE-EPI and GRE MRE were not significantly different (4.14 kPa vs. 3.88 kPa, P = .19). Furthermore, the technical success rate of SE-EPI MRE was superior to that of GRE (100% vs. 83.8%, P = .031). CONCLUSION The measured LS values obtained using TE correlated strongly with those obtained using GRE and SE-EPI MRE techniques, even though SE-EPI-MRE resulted a higher technical success rate than GRE-MRE. Therefore, we believe that TE, GRE, and SE-EPI MR elastography techniques may complement each other according to the appropriate individual situation.
Conflict of interest statement
Figures
Similar articles
-
Technical success rates and reliability of spin-echo echo-planar imaging (SE-EPI) MR elastography in patients with chronic liver disease or liver cirrhosis.Eur Radiol. 2020 Mar;30(3):1730-1737. doi: 10.1007/s00330-019-06496-y. Epub 2019 Nov 14. Eur Radiol. 2020. PMID: 31728687
-
Magnetic Resonance Elastography of the Liver: Qualitative and Quantitative Comparison of Gradient Echo and Spin Echo Echoplanar Imaging Sequences.Invest Radiol. 2016 Sep;51(9):575-81. doi: 10.1097/RLI.0000000000000269. Invest Radiol. 2016. PMID: 26982699 Free PMC article.
-
Comparison of spin-echo echoplanar imaging and gradient recalled echo-based MR elastography at 3 Tesla with and without gadoxetic acid administration.Eur Radiol. 2017 Oct;27(10):4120-4128. doi: 10.1007/s00330-017-4781-4. Epub 2017 Mar 13. Eur Radiol. 2017. PMID: 28289936
-
Comparison of technical failure of MR elastography for measuring liver stiffness between gradient-recalled echo and spin-echo echo-planar imaging: A systematic review and meta-analysis.J Magn Reson Imaging. 2020 Apr;51(4):1086-1102. doi: 10.1002/jmri.26918. Epub 2019 Aug 27. J Magn Reson Imaging. 2020. PMID: 31456328
-
Comparison of gradient-recalled echo and spin-echo echo-planar imaging MR elastography in staging liver fibrosis: a meta-analysis.Eur Radiol. 2018 Apr;28(4):1709-1718. doi: 10.1007/s00330-017-5149-5. Epub 2017 Nov 21. Eur Radiol. 2018. PMID: 29164384 Review.
Cited by
-
Strategies and Techniques for Liver Magnetic Resonance Imaging: New and Pending Applications for Routine Clinical Practice.Korean J Radiol. 2023 Mar;24(3):180-189. doi: 10.3348/kjr.2022.0838. Epub 2023 Feb 6. Korean J Radiol. 2023. PMID: 36788770 Free PMC article. Review. No abstract available.
-
Single Breath-Hold 3-Dimensional Magnetic Resonance Elastography Depicts Liver Fibrosis and Inflammation in Obese Patients.Invest Radiol. 2023 Jun 1;58(6):413-419. doi: 10.1097/RLI.0000000000000952. Epub 2023 Jan 21. Invest Radiol. 2023. PMID: 36719974 Free PMC article.
References
MeSH terms
LinkOut - more resources
Full Text Sources