. 2023 Feb 1;108(2):457-471.
doi: 10.3324/haematol.2022.281456.

Potent preclinical activity of FLT3-directed chimeric antigen receptor T-cell immunotherapy against FLT3- mutant acute myeloid leukemia and KMT2A-rearranged acute lymphoblastic leukemia

Affiliations

Potent preclinical activity of FLT3-directed chimeric antigen receptor T-cell immunotherapy against FLT3- mutant acute myeloid leukemia and KMT2A-rearranged acute lymphoblastic leukemia

Lisa M Niswander et al. Haematologica. .

Abstract

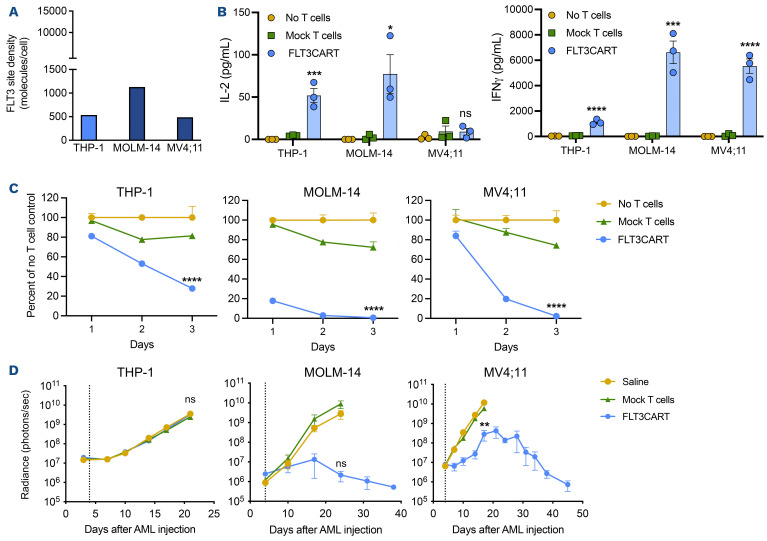
Chimeric antigen receptor (CAR) T-cell immunotherapies targeting CD19 or CD22 induce remissions in the majority of patients with relapsed/refractory B-cell acute lymphoblastic leukemia (ALL), although relapse due to target antigen loss or downregulation has emerged as a major clinical dilemma. Accordingly, great interest exists in developing CAR T cells directed against alternative leukemia cell surface antigens that may help to overcome immunotherapeutic resistance. The fms-like tyrosine kinase 3 receptor (FLT3) is constitutively activated via FLT3 mutation in acute myeloid leukemia (AML) or wild-type FLT3 overexpression in KMT2A (lysine-specific methyltransferase 2A)-rearranged ALL, which are associated with poor clinical outcomes in children and adults. We developed monovalent FLT3-targeted CAR T cells (FLT3CART) and bispecific CD19xFLT3CART and assessed their anti-leukemia activity in preclinical models of FLT3-mutant AML and KMT2A-rearranged infant ALL. We report robust in vitro FLT3CART-induced cytokine production and cytotoxicity against AML and ALL cell lines with minimal cross-reactivity against normal hematopoietic and non-hematopoietic tissues. We also observed potent in vivo inhibition of leukemia proliferation in xenograft models of both FLT3-mutant AML and KMT2A-rearranged ALL, including a post-tisagenlecleucel ALL-to-AML lineage switch patient-derived xenograft model pairing. We further demonstrate significant in vitro and in vivo activity of bispecific CD19xFLT3CART against KMT2Arearranged ALL and posit that this additional approach might also diminish potential antigen escape in these high-risk leukemias. Our preclinical data credential FLT3CART as a highly effective immunotherapeutic strategy for both FLT3- mutant AML and KMT2A-rearranged ALL which is poised for further investigation and clinical translation.


Figures

Figure 1.
Figure 1.
FLT3CART has potent in vitro and in vivo activity against human FLT3-ITD acute myeloid leukemia cell lines. (A) Flow cytometric quantification of FLT3 surface antigen density on acute myeloid leukemia (AML) cell lines. A split Y-axis is utilized to facilitate comparison with acute lymphoblastic leukemia (ALL) cell lines in Figure 2B. (B) AML cell lines were co-incubated in vitro with FLT3CART or mock-transduced T cells in a 1:1 ratio (30,000 cells) for 48 hours. Production of human interleukin-2 (IL-2, left panel) and interferon gamma (IFN-γ, right panel) in culture supernatant was measured by enzyme-linked immunosorbent assay. FLT3CART-induced cytokine production was highest with FLT3-internal tandem duplication (ITD) AML cell lines MOLM-14 and MV4;11. (C) Viability assays of luciferase-transduced AML cell lines co-incubated with FLT3CART at a 1:1 ratio demonstrate significant inhibition of leukemia cell growth in vitro over time with the most complete effects detected against FLT3-ITD AML cell lines. Experiments in (B) and (C) were performed with triplicate technical replicates and results are displayed ± standard error of the mean (SEM). (D) Luciferase-transduced AML cell lines (1x10⁶ cells/mouse) were injected intravenously (IV) into NSG mice. After confirming engraftment via bioluminescent imaging (BLI), cell line xenograft mice were randomized (n=5/group) to receive intravenous saline (yellow), 1x10⁷ mock-transduced T cells (green), or 1x10⁷ FLT3CART (blue) on day 3 or 4 (vertical dashed line). BLI radiance at indicated timepoints is presented graphically ± SEM. FLT3CART displayed in vivo anti-leukemia activity against both tested FLT3-ITD AML cell line models (MOLM-14 and MV4;11), but not against a FLT3 wild-type cell line (THP-1) despite some detection of in vitro activity as above. Data in (B) and (D) were analyzed by one-way analysis of variance (ANOVA) and in (C) by two-way ANOVA with the Dunnett post-test for multiple comparisons using FLT3CART as the comparator. The statistical significance of the effects of FLT3CART compared to those of the mock T-cell group at the last measured time point is displayed. *P<0.05, **P<0.01, ***P<0.001, ****P<0.0001, ns = not significant.
Figure 2.
Figure 2.
FLT3CART has potent in vitro and in vivo activity against human KMT2A-rearranged acute lymphoblastic leukemia cell lines. (A) Flow cytometric quantification of FLT3 surface antigen density on acute lymphoblastic leukemia (ALL) cell lines showed higher expression on KMT2A-rearranged (KMT2A-R) ALL cell lines (HB11;19, KOPN-8, SEM) than on KMT2A wild-type NALM-6 control cells. KMT2A-R ALL cell lines showed equivalent or higher FLT3 surface expression than the FLT3-ITD acute myeloid leukemia cell lines assayed (compare to Figure 2A). SEM uniquely has FLT3 intrachromosomal gene amplification, which explains its almost 10-fold higher number of surface FLT3 molecules. (B) ALL cell lines were co-incubated in vitro with FLT3CART or mock-transduced T cells at a 1:1 (30,000 cells) ratio for 48 hours. Production of human interleukin-2 (IL-2, left panel) and interferon gamma (IFN-γ, right panel) in culture supernatant was measured by enzyme-linked immunosorbent assay. FLT3CART-induced cytokine production was highest in co-culture with SEM cells, which had the greatest FLT3 antigen density among ALL cell lines assayed. Minimal IL-2 and IFN-γ production was detected for the negative control NALM-6 cells. (C) In vitro live cell imaging of GFP-transduced ALL cell lines demonstrated significant inhibition of cell growth of KMT2A-R ALL cell lines HB11;19, KOPN-8, and SEM over time when co-incubated with FLT3CART (blue) at a 1:1 ratio. Experiments in (B) and (C) were performed with triplicate technical replicates and results are displayed ± standard error of the mean. (D) Luciferase-transduced ALL cell lines (1x10⁶ cells/mouse) were injected intravenously (IV) into NSG mice. After confirming engraftment via bioluminescent imaging (BLI), cell line xenograft mice were randomized (n=5/group) to receive IV saline (yellow), 1x10⁷ mock-transduced T cells (green), or 1x10⁷ FLT3CART (blue) on day 4 (vertical dashed line). BLI radiance at indicated timepoints is displayed graphically ± standard error of the mean. Rapid and sustained FLT3CART-induced inhibition of leukemia proliferation was observed in HB11;19 and SEM cell line models versus mock T-cell and saline control treatments, while an initially observed anti-leukemia effect in the KOPN-8 cell line model was not sustained. No effects of FLT3CART were detected in the KMT2A wild-type cell line model NALM-6. Data in (B) and (D) were analyzed by one-way analysis of variance (ANOVA) and in (C) by two-way ANOVA with the Dunnett post-test for multiple comparisons using FLT3CART as the comparator. The statistical significance of the effects of FLT3CART compared to those of the mock T-cell group at the last measured time point is displayed. *P<0.05, **P<0.01, ***P<0.001, ****P<0.0001, ns = not significant.
Figure 3.
Figure 3.
FLT3CART is highly effective against FLT3-mutant acute myeloid leukemia and KMT2A-rearranged acute lymphoblastic leukemia and patient-derived xenografs in vivo. Busulfan-conditioned NSGS mice were engrafted with primary acute myeloid leukemia (AML) cells for the patient-derived xenograft (PDX) models (A) AML11c and (B) JMML117. Once 1-5% CD33+/CD45+ human AML were detectable in peripheral blood, mice were randomized (n=5-8/group) to intravenous (IV) treatment with 1x10⁶ FLT3CART (light blue), mock-transduced T cells (green), or saline (yellow). AML (first panel) and CD3+CD45+ T cells (second panel) were quantified in spleens by flow cytometry at the end of the study, which was determined by the rate of AML progression in control mice (6 weeks of treatment for AML11c, 4 weeks of treatment for JMML117). Unconditioned NSG mice were engrafted with KMT2A-rearranged (KMT2A-R) primary acute lymphoblastic leukemia (ALL) cells for the PDX models (C) ALL3113 and (D) ALL3103, and engraftment was monitored by quantitative flow cytometry analysis of sampled peripheral venous blood. Once human leukemia was detected, mice were randomized (n=4/group) to IV treatment with 1x10⁶ (light blue) or 5x10⁶ (dark blue) FLT3CART, mocktransduced T cells (green), or saline (yellow). CD19+CD45+ ALL (first panel) and CD3+CD45+ T cells (second panel) were quantified in spleens by flow cytometry at the end of the study, which was determined by rate of ALL progression in control mice (4 weeks and 2 weeks after treatment for ALL3113 and ALL3103, respectively). Please note that a saline control group was not available for model ALL3113 and that a dose of 5x10⁶ FLT3CART was also included for this study. FLT3CART was effective in clearing KMT2A-R ALL and both FLT3-mutant (AML11c) and FLT3 wild-type (JMML117) AML. (E) Flow cytometric quantification of FLT3 surface antigen density on KMT2A-R ALL (green) and FLT3-mutant AML (dark blue) and FLT3 wild-type (light blue) PDX cells. FLT3CART is effective in vivo in PDX models with low FLT3 surface expression. Data are displayed ± standard error of the mean and were analyzed by one-way analysis of variance with the Dunnett post-test for multiple comparisons with significance displayed compared to the mock T-cell control group. Absence of a symbol indicates lack of statistical significance. *P<0.05, **P<0.01, ***P<0.001, ****P<0.0001.
Figure 4.
Figure 4.
FLT3CART potently inhibits in vivo leukemia proliferation in KMT2A-rearranged acute lymphoblastic leukemia-to-acute myeloid leukemia lineage switch patient-derived xenograf models. (A) NSG mice were injected intravenously (IV) with KMT2A-rearranged (KMT2A-R) acute lymphoblastic leukemia (ALL) patient-derived xenograft (PDX) cells and engraftment was monitored by flow cytometry of sampled peripheral blood. Once human leukemia was detected, mice (n=4-5/group) were randomized to IV treatment with 1x10⁶ (light blue) or 5x10⁶ (dark blue) FLT3CART, 1x10⁶ mock-transduced T cells (green), or saline (yellow). CD19+/CD45+ human ALL cells were quantified weekly by flow cytometry of peripheral blood (left panel) and at study endpoint after 4 weeks of treatment in murine spleen (middle panel). Human T cells (CD3+/CD45+) were also enumerated in the spleen (right panel). (B) Busulfan-conditioned NSGS mice were injected with cells from the KMT2A-R acute myeloid leukemia (AML) PDX model established from the same patient in (A) following lineage-switch relapse after having been treated with tisagenlecleucel. Once human AML was detected in peripheral blood by flow cytometry, mice (n=4-5/group) were treated with 1x10⁶ (light blue) or 5x10⁶ (dark blue) FLT3CART, mock-transduced T cells (green), or saline (yellow). Human CD33+/CD45+ AML cells were monitored by flow cytometry in the peripheral blood (left panel) and at study endpoint after 2 weeks of treatment in the spleen (middle-left panel) and bone marrow (middle-right panel). CD3+/CD45+ T cells were also measured in end-study spleens (right panel). FLT3CART cleared leukemia in vivo in both KMT2A-R ALL and lineage-switched KMT2A-R AML relapsed PDX models despite differential FLT3 cell surface expression. (C) Flow cytometric quantification of FLT3 surface antigen density on KMT2A-R ALL (green) and AML (blue) PDX cells demonstrates marked antigen downregulation (arrow) upon lineage-switch relapse. Data in (A) and (B) are displayed ± standard error of the mean and were analyzed by one-way analysis of variance with the Tukey post-test for multiple comparisons with significance displayed compared to the mock T-cell control group. *P<0.05, **P<0.01.
Figure 5.
Figure 5.
Robust in vitro cytokine production of bicistronic CD19xFLT3CART against KMT2A-rearranged acute lymphoblastic leukemia. (A) Schematic of bicistronic chimeric antigen receptor constructs containing the same FLT3 scFv (red) with 4-1BB costimulatory domain/CD3ξ signaling domain shown in Figure 1A linked with a P2A element (black line) to anti-CD19 scFv FMC63 (yellow) with either 4-1BB/CD3ξ (BBz) or CD28/CD3ξ (28z) co-stimulatory domains. (B) CD19 antigen expression (molecules/cell) is highly enriched on the cell surface of both KMT2A wild-type (light green) and KMT2A-rearranged (dark green) acute lymphoblastic leukemia (ALL) cell lines, but not expressed on FLT3 wild-type (light blue) or FLT3-mutant (dark blue) acute myeloid leukemia (AML) cell lines, as assessed by quantitative flow cytometry analysis. Luciferase-transduced AML (left panel) and ALL (right panel) cell lines were co-incubated at a 1:1 ratio (30,000 cells) for 48 hours with the indicated CD19CART, FLT3CART, bicistronic CD19xFLT3CART, or mock-transduced T cells. (C) Interleukin-2 (IL-2) and (D) interferon-gamma (IFN-γ) were quantified in culture supernatant by enzyme-linked immunosorbent assay. Cytokine production with dual-targeting CD19xFLT3CART (purple and pink) was either similar or more substantive compared to that with monovalent FLT3CART with the AML and ALL cell lines. Experiments in (C) and (D) were performed in triplicate and results are displayed ± standard error of the mean. Data in (C) and (D) were analyzed by one-way analysis of variance with the Dunnett post-test for multiple comparisons using the mock T-cell group as the comparator. **P<0.01, ***P<0.001, ****P<0.0001.
Figure 6.
Figure 6.
Effective in vitro activity of CD19xFLT3CART against KMT2A-rearranged acute lymphoblastic leukemia. Inhibition of viability of luciferase-transduced human acute myeloid leukemia (AML, top panel) and acute lymphoblastic leukemia (ALL, bottom panel) cell lines co-incubated with CD19CART, FLT3CART, or one of two CD19xFLT3CART in a 1:1 ratio was assessed via luciferase reporter assay at 24, 48, 72, and 96 hours. FLT3CART and both CD19xFLT3CART significantly inhibited the viability of FLT3-ITD AML (CD19-negative) and KMT2A-rearranged ALL (CD19-positive) cell lines, suggesting sufficiency of FLT3 targeting in these ‘OR’-gated chimeric antigen receptor constructs. Experiments were performed in triplicate and results are displayed ± standard error of the mean. Data were analyzed by two-way analysis of variance with the Dunnett post-test for multiple comparisons using the mock T-cell group as the comparator. Both CD19xFLT3CART induced statistically significant killing at day 4 versus mock T-cell controls in all cell lines tested (P<0.01).
Figure 7.
Figure 7.
Bispecific CD19xFLT3CART inhibits in vivo leukemia proliferation in cell line xenograf models. (A) Luciferase-transduced SEM KMT2A-rearranged acute lymphoblastic leukemia (ALL) cells were injected intravenously into NSG mice on day 0. Once engraftment was detected by bioluminescent imaging (BLI), mice were randomized (n=5/group) to receive intravenous treatment (vertical dashed line) with saline, mock-transduced T cells, monovalent CD19CART, FLT3CART, or bicistronic CD19xFLT3CART (1x10⁷ cell dosing for all groups). Mice were followed by serial BLI twice- or once-weekly with radiance ± standard error of the mean displayed graphically. CD19CART, FLT3CART, and both CD19xFLT3CART resulted in rapid clearance of ALL. (B) In a parallel experiment, luciferase-transduced MOLM-14 FLT3-ITD acute myeloid leukemia (AML) cells were injected into NSG mice on day 0. Once engraftment was detected, mice were randomized (n=5/group) to experimental treatment, followed by BLI as described in (A). Monovalent FLT3CART and bicistronic CD19xFLT3CART potently inhibited in vivo AML proliferation. As expected for CD19negative MOLM-14, monovalent CD19CART had no anti-leukemia activity, confirming ‘OR’ gating logic of the bispecific CD19xFLT3CART seen in Figure 6. Data ± standard error of the mean were analyzed by one-way analysis of variance with significance shown for FLT3CART versus the mock T-cell group. Absence of a symbol indicates lack of statistical significance. ****P<0.0001.
Figure 8.
Figure 8.
Bispecific CD19xFLT3CART inhibits in vivo leukemia proliferation in patient-derived xenograf models of KMT2A-rearranged acute lymphoblastic leukemia. Patient-derived xenograft (PDX) models (A) iALL150MD and (B) ALL3113 were randomized (n=5 mice/group) to intravenous (IV) treatment with saline, mock-transduced T cells, CD19CART, FLT3CART, or one of the bicis-tronic CD19xFLT3CART (5x10⁶ cell dosing for all groups) as designated. Weekly quantitative flow cytometric monitoring of CD19+/CD45+ human acute lymphoblastic leukemia and CD3+ CAR T cells was performed with peripheral venous blood sampling, and interferon gamma (IFN-γ) was measured in prepared plasma by enzyme-linked immunosorbent assay. The study endpoint was determined by the rate of leukemia progression in control mice (3 weeks or 4 weeks of treatment in iALL135MD or ALL3113, respectively). No leukemia was detected in peripheral blood or end-study spleens in either PDX model following treatment with CD19xFLT3CART. An unexpectedly large xenogeneic anti-leukemia effect was observed in the iALL135MD PDX model with mock CAR T-cell versus saline treatment, but was not detected in other PDX models. Peripheral blood T-cell expansion and detectable IFN-γ were equal or greater for the bicistronic CD19xFLT3CART than for the monovalent CD19CART or FLT3CART. Data ± standard error of the mean were analyzed by two-way analysis of variance with the Tukey post-test for multiple comparisons with significance shown for FLT3CART versus CD19(28z)xFLT3CART for the T-cell and IFN-γ panels and versus the mock T-cell group for all other panels. Absence of a symbol indicates lack of statistical significance. *P<0.05, ***P<0.001, ****P<0.0001.

References

    1. Small D, Levenstein M, Kim E, et al. . STK-1, the human homolog of Flk-2/Flt-3, is selectively expressed in CD34+ human bone marrow cells and is involved in the proliferation of early progenitor/stem cells. Proc Natl Acad Sci U S A. 1994;91(2):459-463. - PMC - PubMed
    1. Kuchenbauer F, Kern W, Schoch C, et al. . Detailed analysis of FLT3 expression levels in acute myeloid leukemia. Haematologica. 2005;90(12):1617-1625. - PubMed
    1. Thiede C, Steudel C, Mohr B, et al. . Analysis of FLT3-activating mutations in 979 patients with acute myelogenous leukemia: association with FAB subtypes and identification of subgroups with poor prognosis. Blood. 2002;99(12):4326-4335. - PubMed
    1. Bolouri H, Farrar JE, Triche T, et al. . The molecular landscape of pediatric acute myeloid leukemia reveals recurrent structural alterations and age-specific mutational interactions. Nat Med. 2018;24(1):103-112. - PMC - PubMed
    1. Perl AE, Martinelli G, Cortes JE, et al. . Gilteritinib or chemotherapy for relapsed or refractory FLT3-mutated AML. N Engl J Med. 2019;381(18):1728-1740. - PubMed

Publication types

Substances