. 2022 Oct;23(10):e13741.
doi: 10.1002/acm2.13741. Epub 2022 Aug 11.

Performance evaluation of two interventional fluoroscope suites for cardiovascular imaging

Affiliations

Performance evaluation of two interventional fluoroscope suites for cardiovascular imaging

Gregory Anthony et al. J Appl Clin Med Phys. 2022 Oct.

Abstract

Interventional cardiology involves catheter-based treatment of heart disease, generally through fluoroscopically guided interventional procedures. Patients can be subject to considerable radiation dose due to prolonged fluoroscopy time and radiographic exposure, and therefore efforts to minimize patient dose should always be undertaken. Developing standardized, effective quality control programs for these systems is a difficult task owing to cross-vendor differences and automated control of imaging protocols. Furthermore, analyses of radiation dose should be performed in the context of its associated effects on image quality. The aim of the study is to investigate radiation dose and image quality in two fluoroscopic systems used for interventional cardiology procedures. Image quality was assessed in terms of spatial resolution and modulation transfer function, signal-to-noise and contrast-to-noise ratios, and spatial-temporal resolution of fluoroscopy and cineradiography images with phantoms simulating various patient thicknesses under routine cardiology protocols. The entrance air kerma (or air kerma rate) was measured and used to estimate entrance surface dose (or dose rate) in the phantoms.

Keywords: fluoroscopy; image quality; radiation dose.


Conflict of interest statement

The authors have no conflict of interest to declare.

Figures
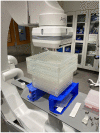
FIGURE 1
FIGURE 1
Polymethyl methacrylate (PMMA) slabs used for automatic exposure control (AEC) dosimetry measurements.
FIGURE 2
FIGURE 2
Line pair phantom used for spatial resolution measurements. The line pair phantom was affixed to the image receptor surface and exposed with three simulated patient thicknesses in the beam (6, 9, and 12 in. polymethyl methacrylate [PMMA]) to assess limiting spatial resolution.
FIGURE 3
FIGURE 3
A 24‐well specimen plate filled with 1‐ml samples of iopamidol contrast (Isovue 370 with dilution factors of 80×, 40×, 20×, and 10×, from left to right). The plate was placed on top of simulated patient thicknesses of 6, 9, and 12 in. polymethyl methacrylate (PMMA). Contrast (red) and background (yellow) regions of interest (ROIs) were drawn for contrast‐to‐noise ratio (CNR) measurement.
FIGURE 4
FIGURE 4
Fluoroscopy (a) and cineradiography (b) images of rotating spoke phantom used to assess temporal resolution/motion blur. Images were acquired at 25‐cm field of view (FOV) on the Artis Q system with 6 in polymethyl methacrylate (PMMA) attenuation. Yellow arrows indicate “ghost” objects due to recursive filtering of fluoroscopy images.
FIGURE 5
FIGURE 5
Air kerma rate in mGy/min using intermediate (20/19 cm) field of view (FOV) for varying thicknesses of polymethyl methacrylate (PMMA). The two systems had distinct automatic exposure control (AEC) functions but still produced comparable air kerma rates over the range of patient thicknesses simulated.
FIGURE 6
FIGURE 6
Half‐value layer in mm Al for varying levels of phantom attenuation. The Azurion system half‐value layer (HVL) changed continually as a result of kVp adjustment with phantom thickness. The Artis Q system maintained a consistent beam quality for lower phantom thicknesses through the use of dynamic beam filtering.
FIGURE 7
FIGURE 7
Estimated entrance skin dose rate in mGy/min using intermediate (20/19 cm) field of view (FOV) for varying levels of phantom attenuation. The skin entrance of the simulated patient was assumed to be at the patient entrance reference point (PERP) (15 cm below device isocenter).
FIGURE 8
FIGURE 8
Signal‐to‐noise ratio (SNR) dose efficiency for three simulated patient thicknesses at (a) 25/27‐cm field of view (FOV), (b) 20/19‐cm FOV, and (c) 16/15‐cm FOV. The Artis Q system exhibited consistently lower image noise per unit air kerma rate across all thicknesses.
FIGURE 9
FIGURE 9
Contrast‐to‐noise ratio (CNR) dose efficiency for three simulated patient thicknesses with (a) 80× dilution (4.625 mg/ml), (b) 40× dilution (9.25 mg/ml), (c) 20× dilution (18.5 mg/ml), and (d) 10× dilution (37 mg/ml) of Isovue 370. The Artis Q system exhibited consistently greater CNR per unit air kerma rate across all thicknesses, with a greater difference in performance for small simulated patient sizes.
FIGURE 10
FIGURE 10
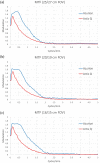
Modulation transfer function (MTF) curves for Azurion and Artis Q systems at (a) 25/27‐cm field of view (FOV), (b) 20/19‐cm FOV, and (c) 16/15‐cm FOV. Elevation of the curves above unity indicates edge‐enhancement processing effects. The Azurion demonstrated a greater degree of edge enhancement, but both systems exhibited similar limiting spatial resolution between 1.8 and 2.0 cycles/mm.
FIGURE 11
FIGURE 11
Siemens Artis Q (a) and Philips Azurion (b) cine images of rotating spoke phantom at 25/27‐cm field of view (FOV) with attenuation of 6 in. polymethyl methacrylate (PMMA). Contrary to fluoro mode, edge enhancement effects are more pronounced in the Artis Q images. Yellow arrows indicate iodine‐filled infusion catheter.

References

    1. Goode AR, Snyder C, Snyder A, Collins P, DeLorenzo M, Lin PJ. Signal and contrast to noise ratio evaluation of fluoroscopic loops for interventional fluoroscope quality control. J Appl Clin Med Phys. 2019;20:172‐180. - PMC - PubMed
    1. Christopoulos G, Christakopoulos GE, Rangan BV, et al. Comparison of radiation dose between different fluoroscopy systems in the modern catheterization laboratory: results from bench testing using an anthropomorphic phantom. Catheter Cardiovasc Interv. 2015;86:927‐932. - PubMed
    1. Trunz LM, Eschelman DJ, Gonsalves CF, Adamo RD, Dave JK. Investigation of radiation dose estimates and image quality between commercially available interventional fluoroscopy systems for fluoroscopically guided interventional procedures. Acad Radiol. 2021;28(11):1159‐1569. - PubMed
    1. Dehairs M, Bosmans H, Desmet W, Marshall NW. Evaluation of automatic dose rate control for flat panel imaging using a spatial frequency domain figure of merit. Phys Med Biol. 2017;62:6610‐6630. - PubMed
    1. Low‐dose imaging is becoming a clinical reality. 2014. https://www.semanticscholar.org/paper/Low‐dose‐imaging‐is‐becoming‐a‐cli...