. 2023 Apr;19(4):1204-1215.
doi: 10.1002/alz.12751. Epub 2022 Aug 11.

An accurate fully automated panel of plasma biomarkers for Alzheimer's disease

Affiliations

An accurate fully automated panel of plasma biomarkers for Alzheimer's disease

Sebastian Palmqvist et al. Alzheimers Dement. 2023 Apr.

Abstract

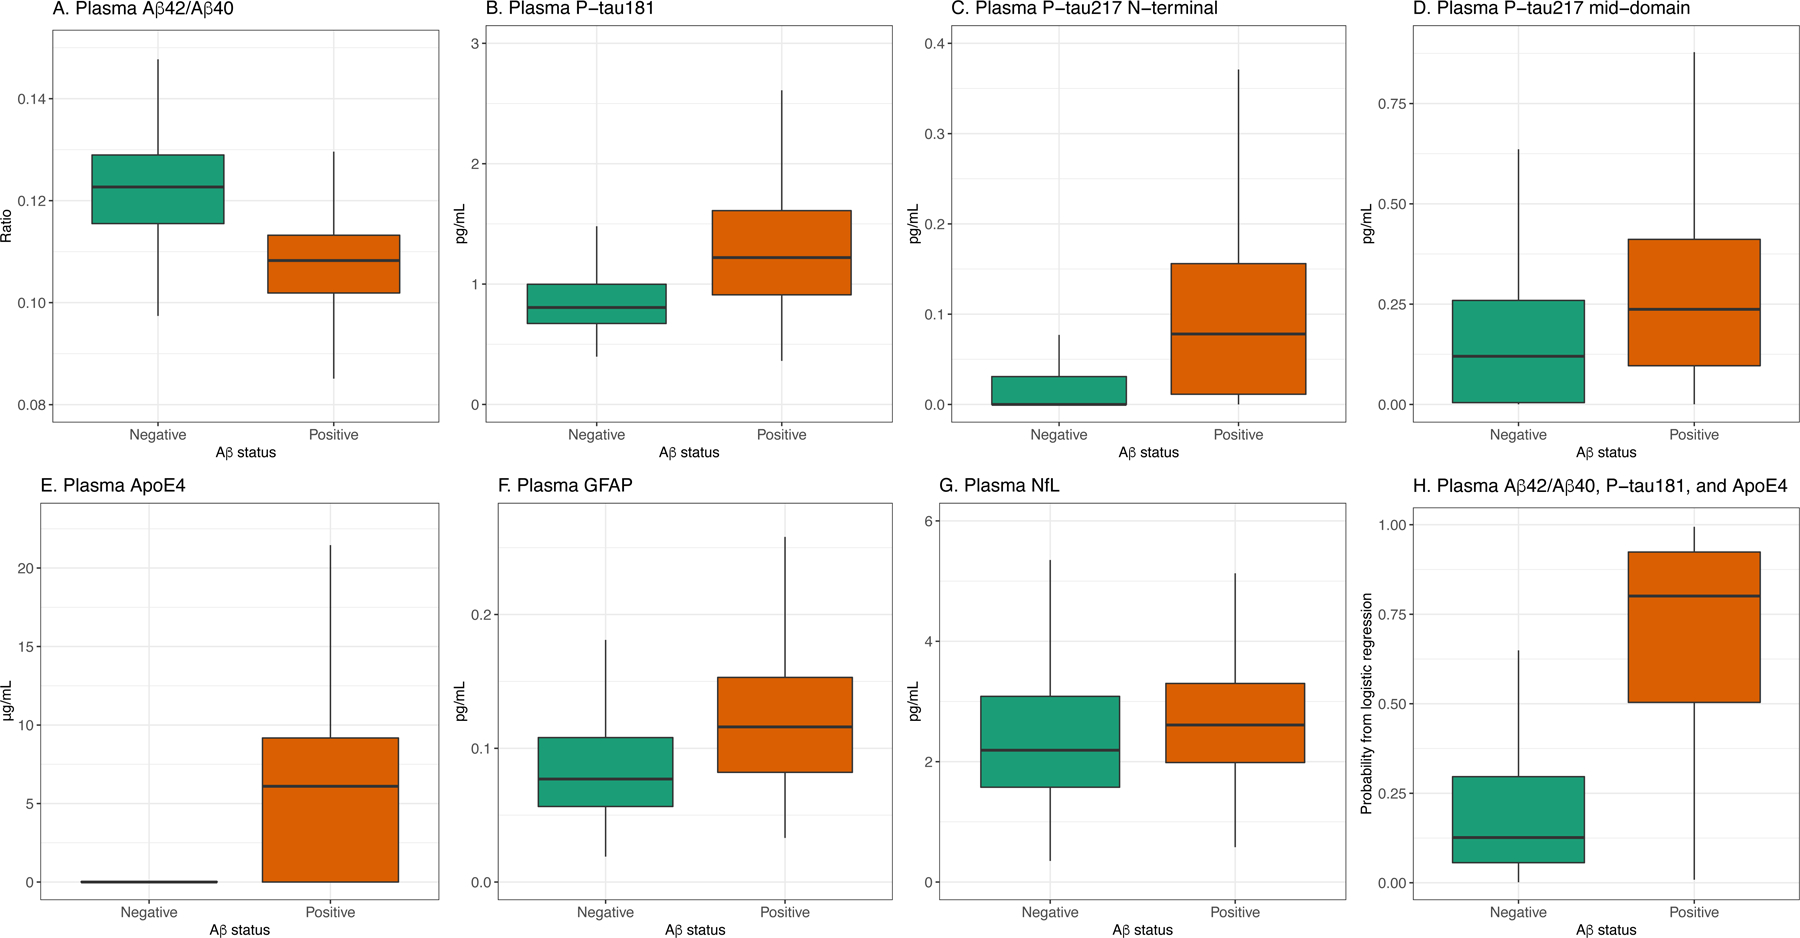
Introduction: There is a great need for fully automated plasma assays that can measure amyloid beta (Aβ) pathology and predict future Alzheimer's disease (AD) dementia.

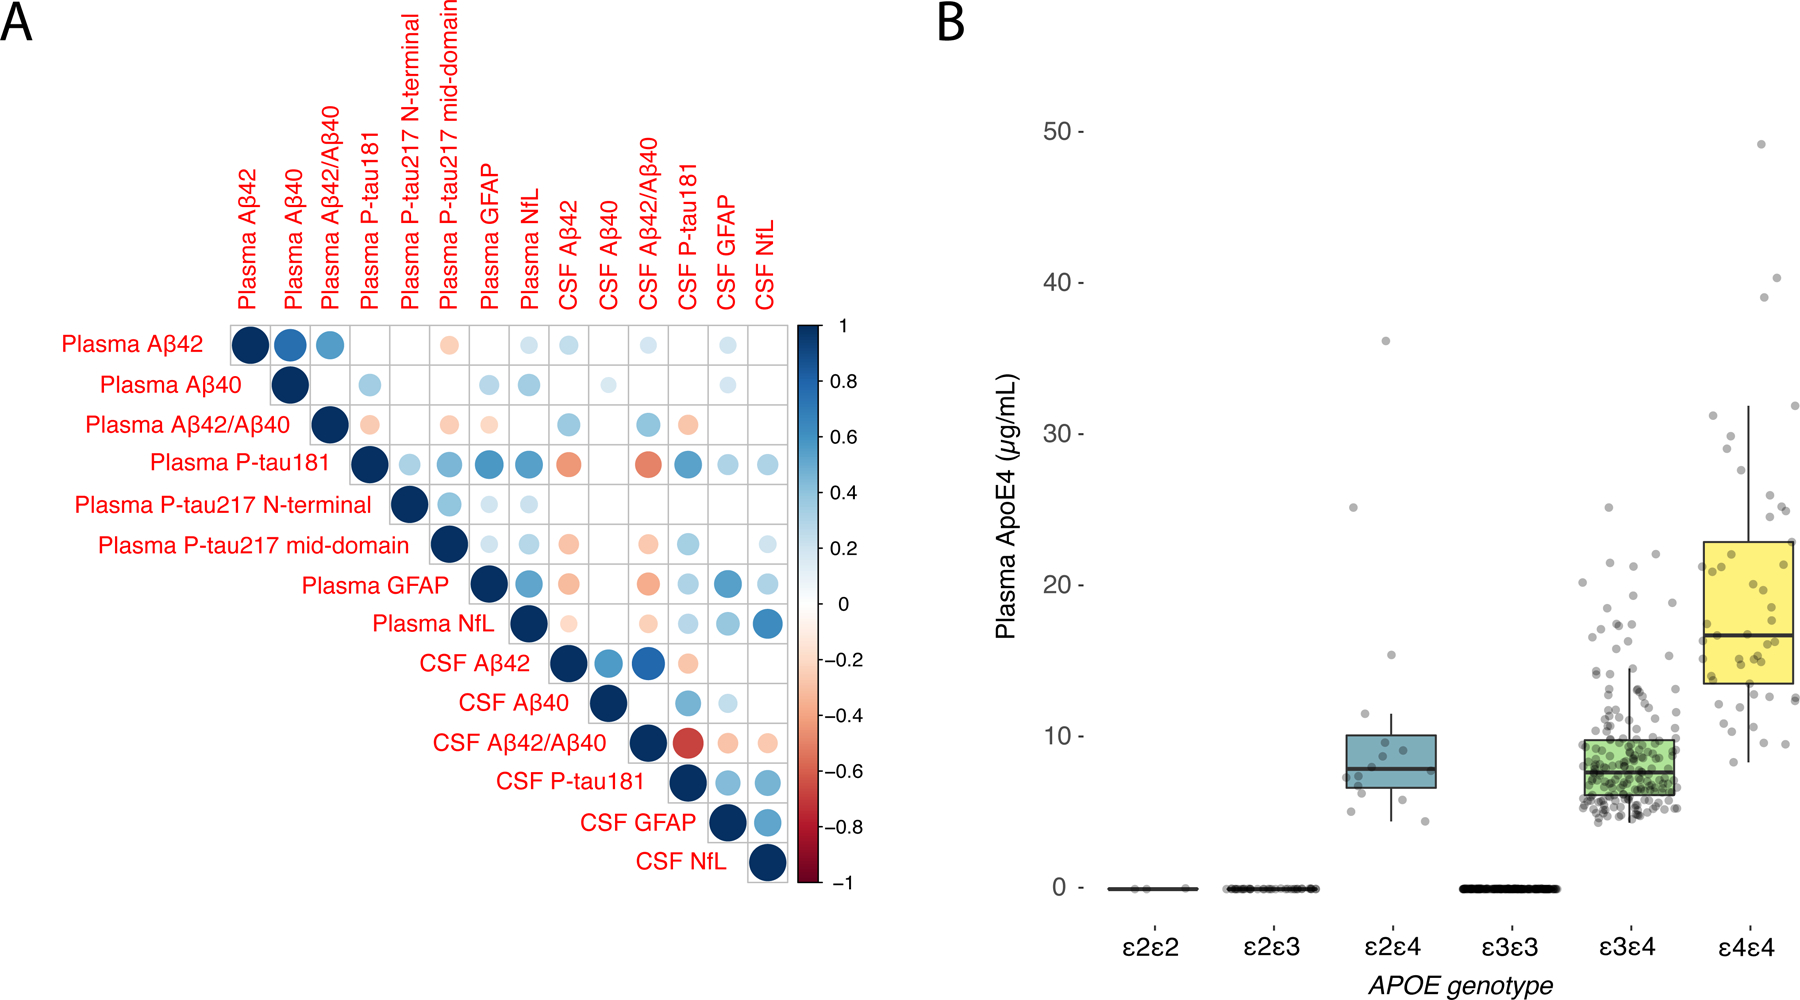
Methods: Two cohorts (n = 920) were examined: Panel A+ (n = 32 cognitively unimpaired [CU], n = 106 mild cognitive impairment [MCI], and n = 89 AD) and BioFINDER-1 (n = 461 CU, n = 232 MCI). Plasma Aβ42/Aβ40, phosphorylated tau (p-tau)181, two p-tau217 variants, ApoE4 protein, neurofilament light, and GFAP were measured using Elecsys prototype immunoassays.

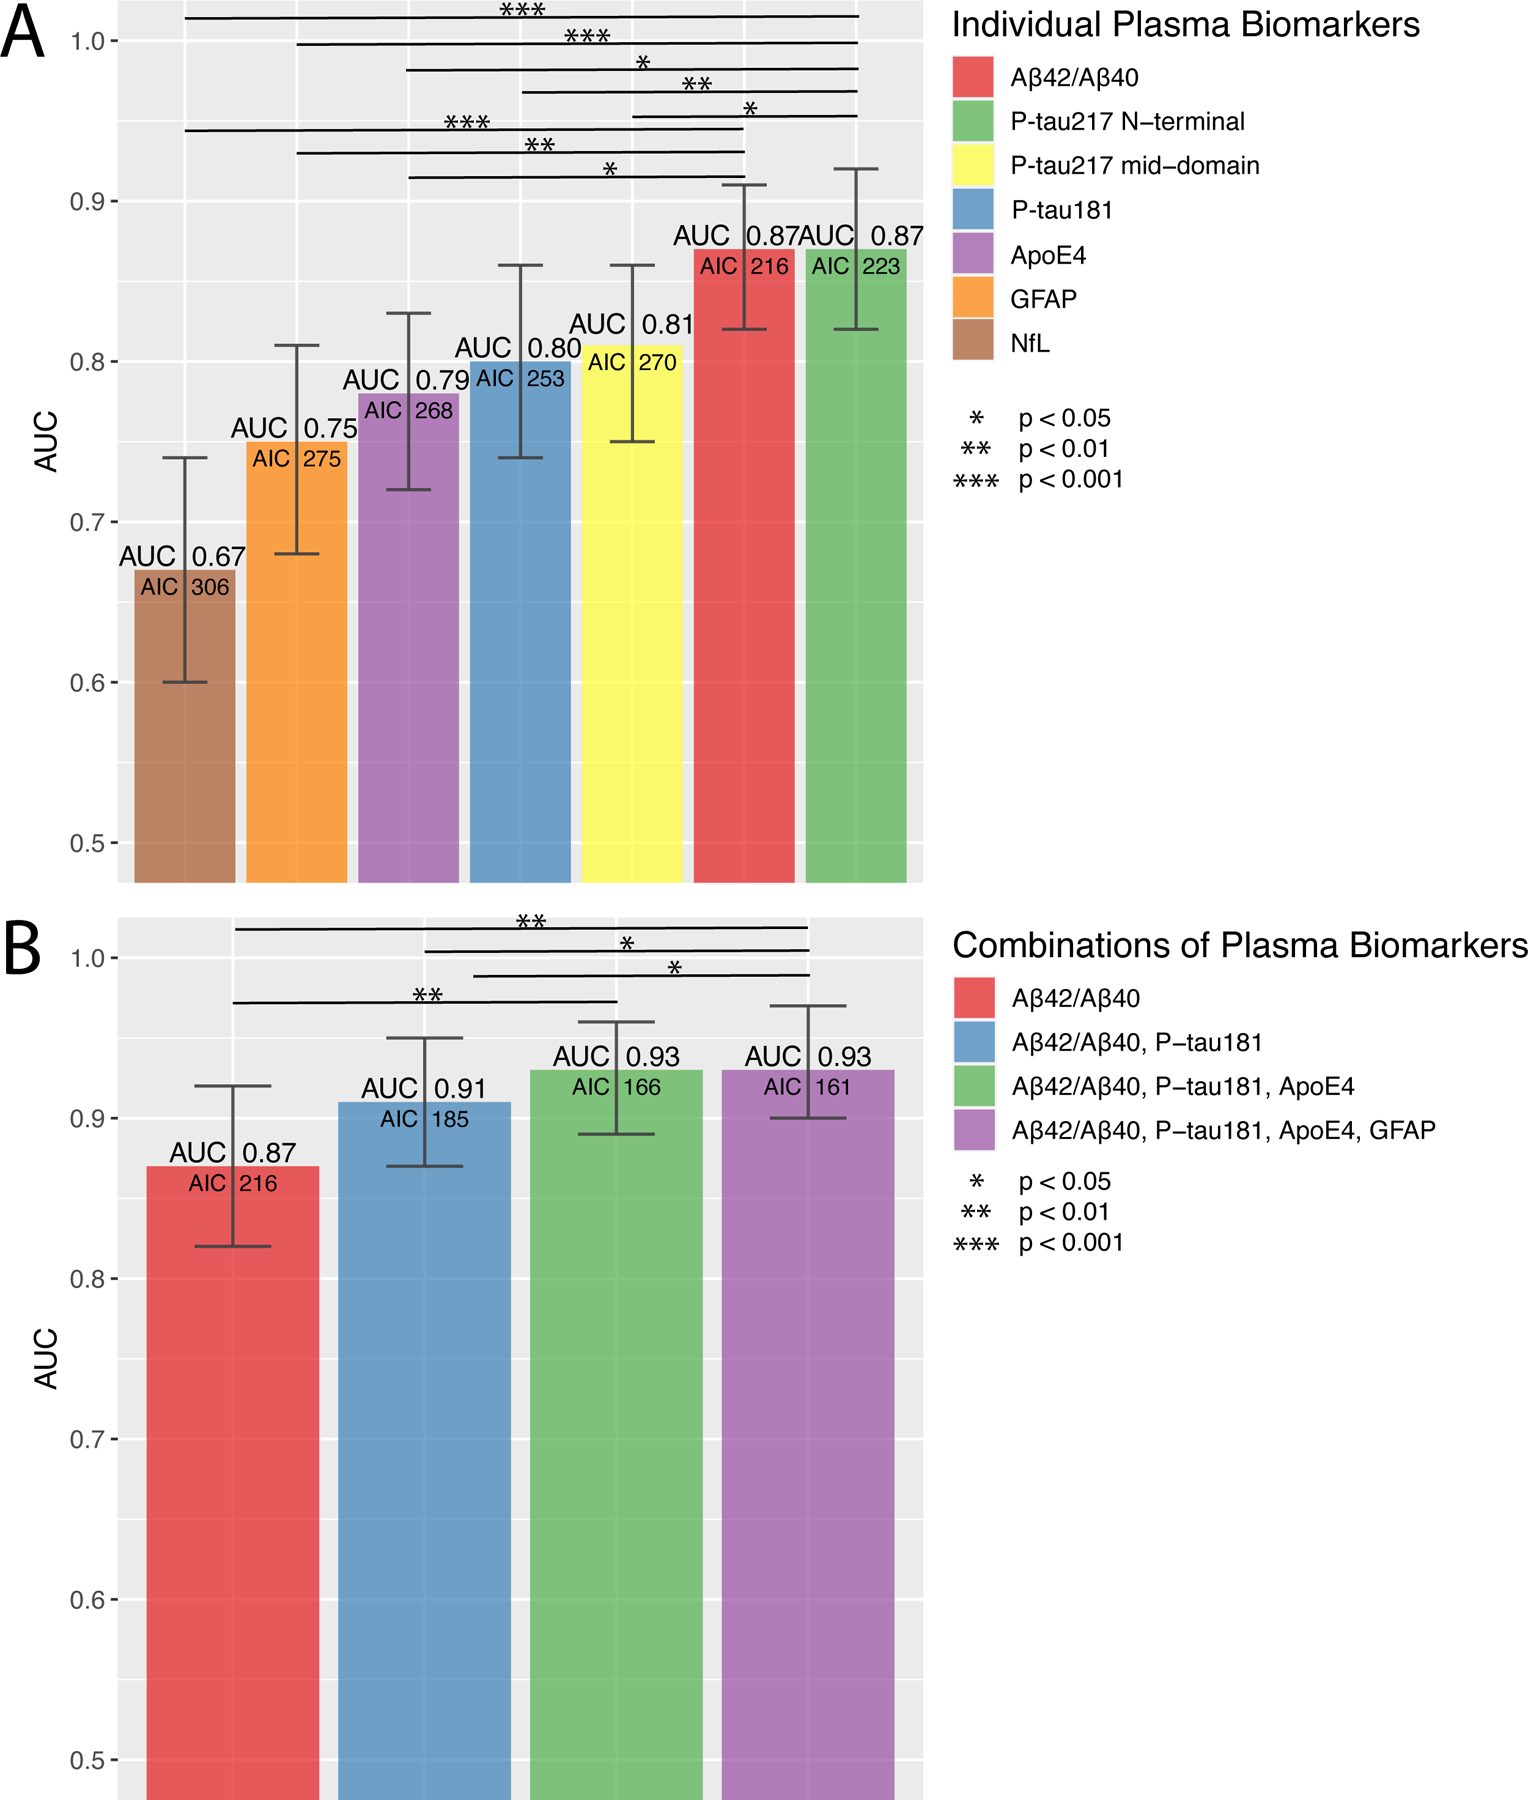
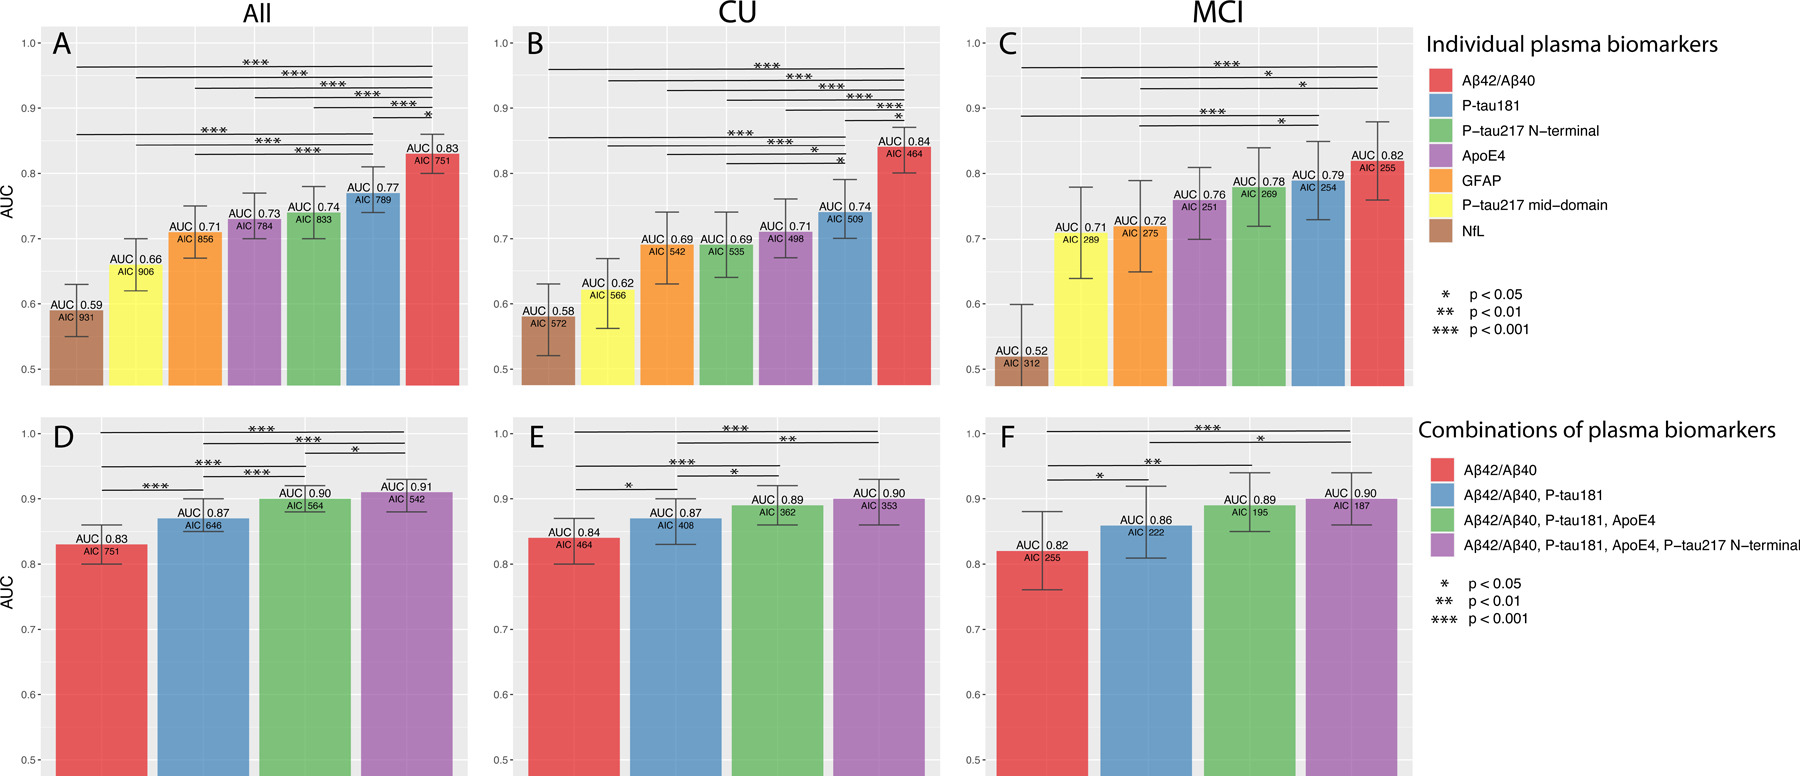
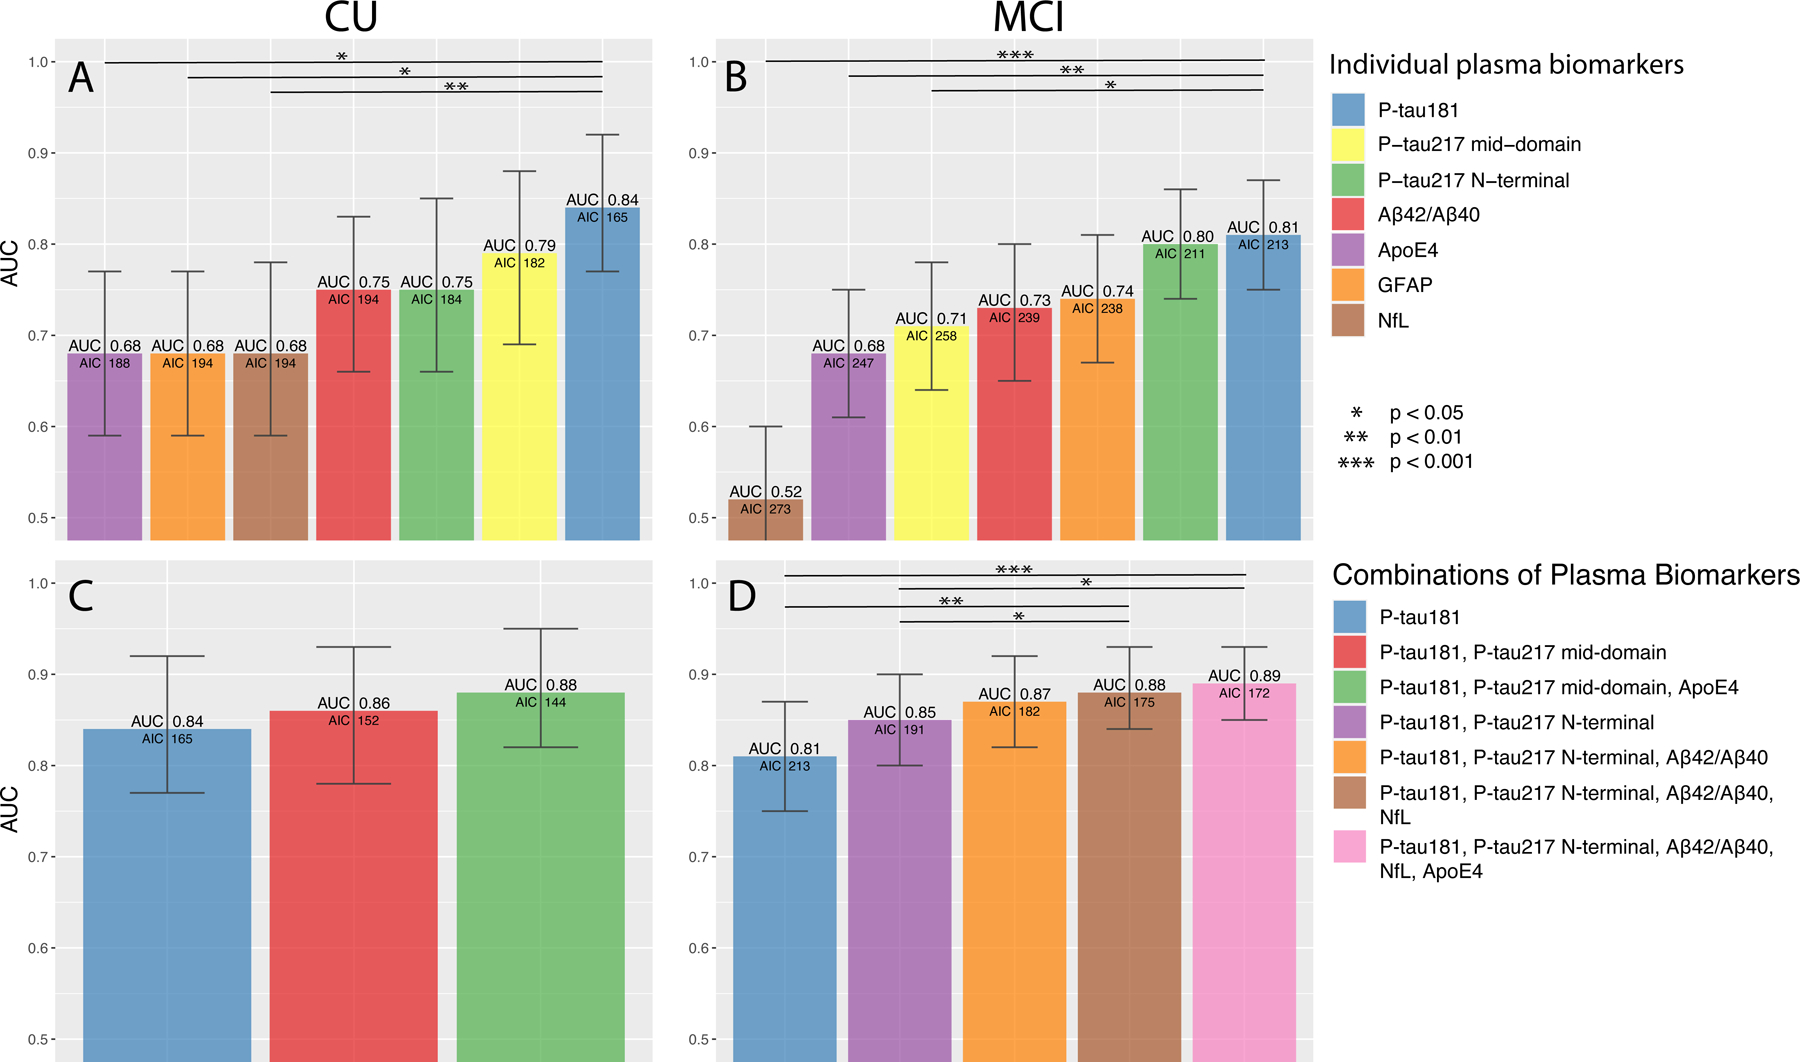
Results: The best biomarker for discriminating Aβ-positive versus Aβ-negative participants was Aβ42/Aβ40 (are under the curve [AUC] 0.83-0.87). Combining Aβ42/Aβ40, p-tau181, and ApoE4 improved the AUCs significantly (0.90 to 0.93; P< 0.01). Adding additional biomarkers had marginal effects (ΔAUC ≤0.01). In BioFINDER, p-tau181, p-tau217, and ApoE4 predicted AD dementia within 6 years in CU (AUC 0.88) and p-tau181, p-tau217, and Aβ42/Aβ40 in MCI (AUC 0.87).

Discussion: The high accuracies for Aβ pathology and future AD dementia using fully automated instruments are promising for implementing plasma biomarkers in clinical trials and clinical routine.

Keywords: Alzheimer's disease; Elecsys; amyloid beta; apolipoprotein E; area under the curve; blood; cerebrospinal fluid; clinical practice; cognitively unimpaired; diagnostics; fully automated instruments; glial fibrillary acidic protein; immunoassays; implementation; mild cognitive impairment; neurofilament light; phosphorylated tau; plasma; prediction; prognostics.


Figures

Figure 1.
Figure 1.. Discrimination of Aβ positive (n=117) vs negative (n=110) participants in Panel A+.
ROC analysis of single (A) and combinations (B) of plasma biomarkers for discriminating Aβ positive vs Aβ negative participants. Bars show the AUC and whiskers the 95% CI of the AUC. Models (B) were built, starting with the biomarker with the highest AUC. Additional biomarkers were added step-wise based on how much the AIC was reduced. Biomarkers that did not reduce the AIC were not added. Statistical comparisons of AUCs between the two best models and the other models are shown in the figures. Note that using P-tau217 N-terminal instead of P-tau181 provided similar AUCs (ΔAUC<0.01), see Supplementary Table 9. Additional models and model comparisons are shown in Supplementary Tables 7–9. Abbreviations: Aβ, β-amyloid (positivity defined by CSF Aβ42/Aβ40) AIC, Akaike information criterion; ApoE4, the E4 isoform of apolipoprotein E; AUC, area under the receiver operating characteristic curve; CI, confidence interval; GFAP, glial fibrillary acidic protein; NfL, neurofilament light; P-tau217 mid-domain, Phospho-tau217 using an antibody pair recognizing a mid-domain tau epitope; P-tau217 N-terminal, Phospho-tau217 using an antibody pair recognizing an N-terminal tau epitope.
Figure 2.
Figure 2.. Boxplots of the plasma biomarker concentrations in BioFINDER grouped by Aβ status.
A, Aβ42/40, B, P-tau181, C, P-tau217 N-terminal, D, P-tau217 mid-domain, E, ApoE4, F, GFAP, G, NfL, G, probability from a logistic regression model including Aβ42/40, P-tau181, and ApoE4. Individual data points are shown in Supplementary Fig. 4. Corresponding data for Panel A+ are shown in Supplementary Fig. 2–3.
Figure 3.
Figure 3.. Discrimination of Aβ positive (n=403) vs negative (n=290) participants in BioFINDER (n=693).
ROC analysis from all participants (A, D), CU (B, E) and MCI (C, F) using single (AC) and combinations (DF) of plasma biomarkers. Bars show the AUC and whiskers the 95% CI of the AUC. Models were built, starting with the biomarker with the highest AUC. Additional biomarkers were added step-wise based on how much the AIC was reduced. Biomarkers that did not reduce the AIC were not added. Statistical comparisons of AUCs between the two best models and the other models are shown in the figures. Additional models and model comparisons are shown in Supplementary Tables 10–16. Abbreviations: Aβ, β-amyloid (positivity defined by CSF Aβ42/Aβ40) AIC, Akaike information criterion; ApoE4, the E4 isoform of apolipoprotein E; AUC, area under the receiver operating characteristic curve; CI, confidence interval; CU, cognitively unimpaired; GFAP, glial fibrillary acidic protein; MCI, mild cognitive impairment; NfL, neurofilament light; P-tau217 mid-domain, Phospho-tau217 using an antibody pair recognizing a mid-domain tau epitope; P-tau217 N-terminal, Phospho-tau217 using an antibody pair recognizing an N-terminal tau epitope.
Figure 4.
Figure 4.. Prediction of development of AD dementia within 6 years in BioFINDER.
ROC analysis from participants that were CU (A, C) or had MCI (B, D) at baseline using single (A-B) and combinations (C-D) of plasma biomarkers. Bars show the AUC and whiskers the 95% CI of the AUC. Models were built, starting with the one with the highest AUC. Additional biomarkers were added step-wise based on how much the AIC was reduced. Biomarkers that did not reduce the AIC were not added. Statistical comparisons of AUCs between the two best models and the other models are shown in the figures. Additional models and model comparisons are shown in Supplementary Tables 17–20 (including all steps in panel D). Abbreviations: Aβ, β-amyloid (positivity defined by CSF Aβ42/Aβ40) AIC, Akaike information criterion; ApoE4, the E4 isoform of apolipoprotein E; AUC, area under the receiver operating characteristic curve; CI, confidence interval; CU, cognitively unimpaired; GFAP, glial fibrillary acidic protein; MCI, mild cognitive impairment; NfL, neurofilament light; P-tau217 mid-domain, Phospho-tau217 using an antibody pair recognizing a mid-domain tau epitope; P-tau217 N-terminal, Phospho-tau217 using an antibody pair recognizing an N-terminal tau epitope.
Figure 5.
Figure 5.. Associations between plasma and CSF biomarkers and between plasma ApoE4 and APOE genotype in BioFINDER.
(A) Spearman correlation matrix of the association between plasma and CSF biomarkers. Size and color of the circles indicates the Spearman rho (according to the scale on the right side). Blank boxes are non-significant correlations. Exact Spearman rho values are shown in Supplementary Fig. 5. (B) Boxplots of plasma ApoE4 levels by APOE genotype. Box ends denotes the 25th and 75th percentile and the horizontal line the median. Whiskers extend to the upper and lower adjacent values within 1.5 × interquartile range of the 25th and 75th percentiles. Black dots indicated values above/below the whiskers. In addition, shaded grey dots show all individual participants. 1 participant was missing APOE genotyping and was excluded. 1 outlier with APOE ε4/ε4 genotype and plasma ApoE4 concentration of 117.7 µg/mL is not shown (to improve visualization), but that participant is included in the calculation of the median, box and whiskers. Corresponding data for Panel A+ is shown in Supplementary Fig. 6. Abbreviations: Aβ, β-amyloid (positivity defined by CSF Aβ42/Aβ40) AIC, Akaike information criterion; ApoE4, the E4 isoform of apolipoprotein E; AUC, area under the receiver operating characteristic curve; CI, confidence interval; CSF, cerebrospinal fluid; CU, cognitively unimpaired; GFAP, glial fibrillary acidic protein; MCI, mild cognitive impairment; NfL, neurofilament light; P-tau217 mid-domain, Phospho-tau217 using an antibody pair recognizing a mid-domain tau epitope; P-tau217 N-terminal, Phospho-tau217 using an antibody pair recognizing an N-terminal tau epitope.

References

    1. Hansson O, Biomarkers for neurodegenerative diseases. Nat Med, 2021. 27(6): p. 954–963. - PubMed
    1. Palmqvist S, et al. , Prediction of future Alzheimer’s disease dementia using plasma phospho-tau combined with other accessible measures. Nat Med, 2021. 27(6): p. 1034–1042. - PubMed
    1. Thijssen EH, et al. , Diagnostic value of plasma phosphorylated tau181 in Alzheimer’s disease and frontotemporal lobar degeneration. Nat Med, 2020. 26(3): p. 387–397. - PMC - PubMed
    1. Palmqvist S, et al. , Discriminative Accuracy of Plasma Phospho-tau217 for Alzheimer Disease vs Other Neurodegenerative Disorders. JAMA, 2020. 324(8): p. 772–781. - PMC - PubMed
    1. Karikari TK, et al. , Blood phosphorylated tau 181 as a biomarker for Alzheimer’s disease: a diagnostic performance and prediction modelling study using data from four prospective cohorts. Lancet Neurol, 2020. 19(5): p. 422–433. - PubMed

Publication types