

Gastrointestinal Biogeography of Luminal Microbiota and Short-Chain Fatty Acids in Sika Deer (Cervus nippon)
- PMID: 35950850
- PMCID: PMC9469704
- DOI: 10.1128/aem.00499-22
Gastrointestinal Biogeography of Luminal Microbiota and Short-Chain Fatty Acids in Sika Deer (Cervus nippon)
Abstract
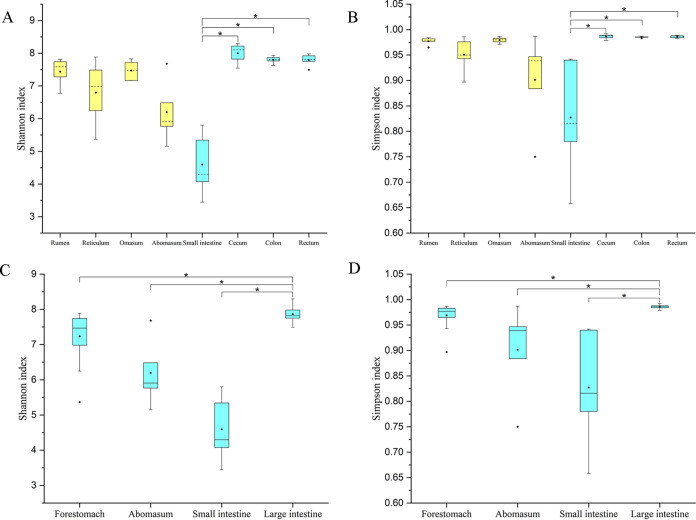
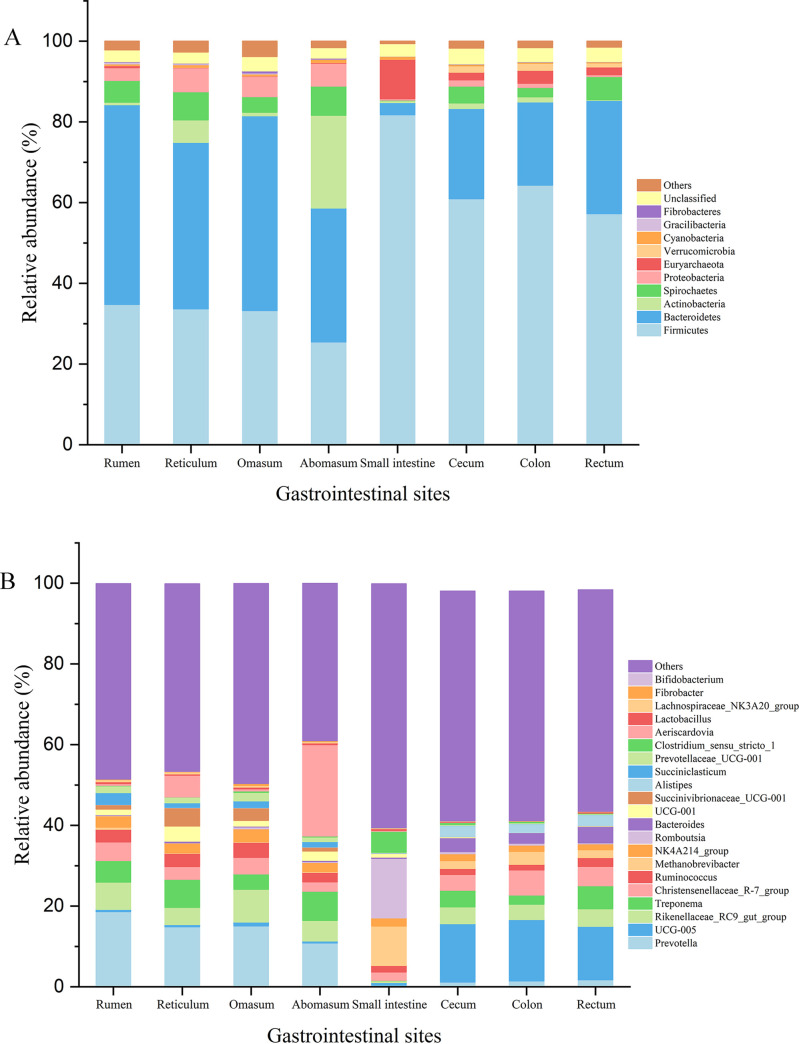
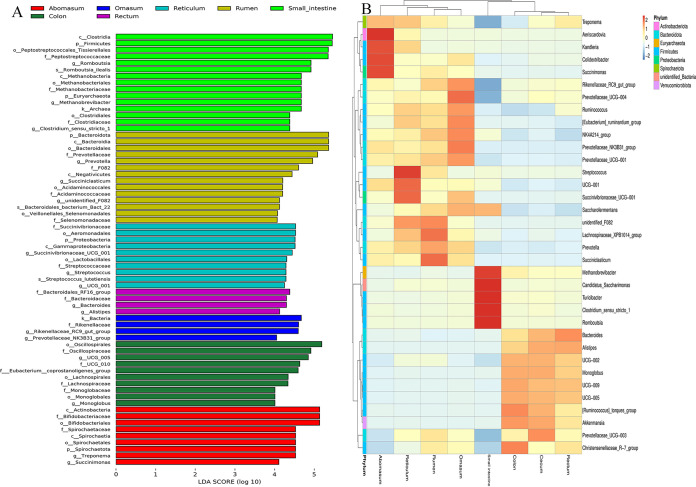
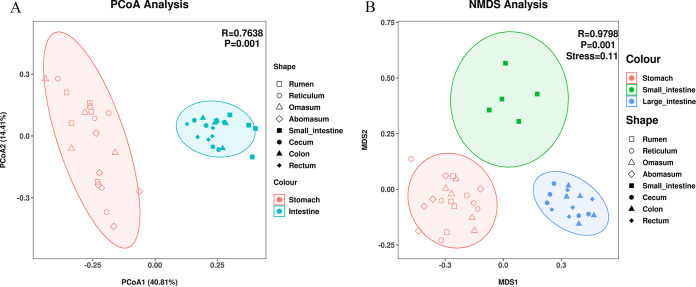
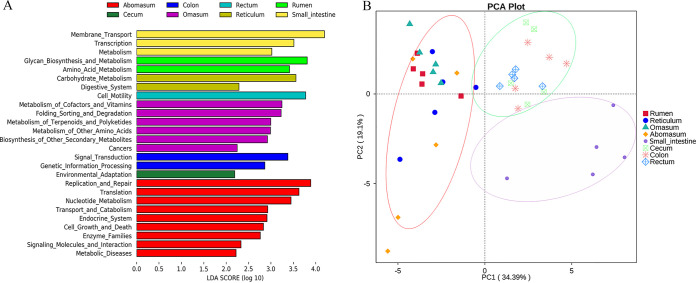
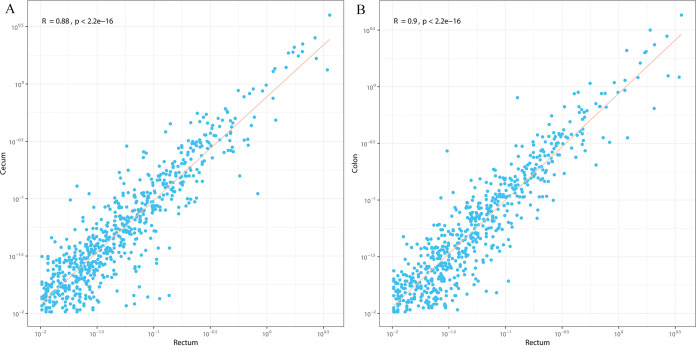
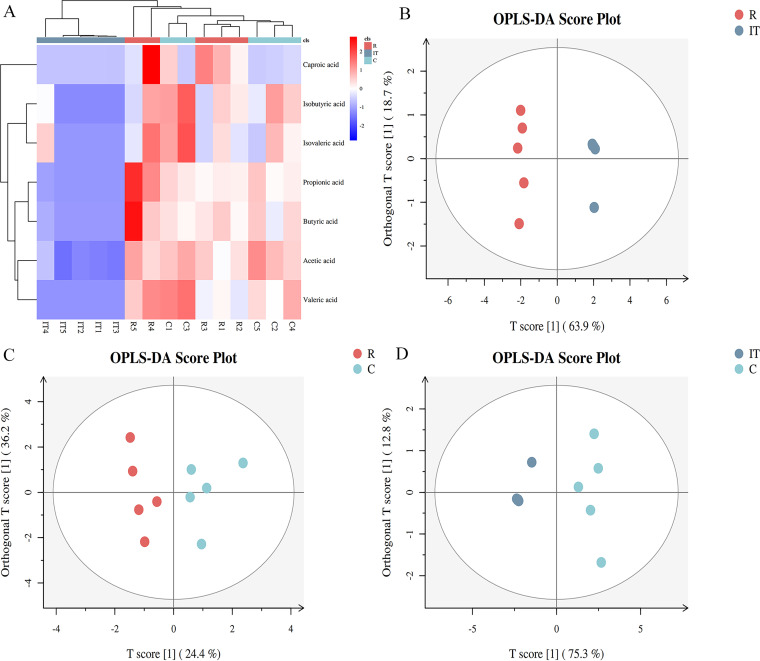
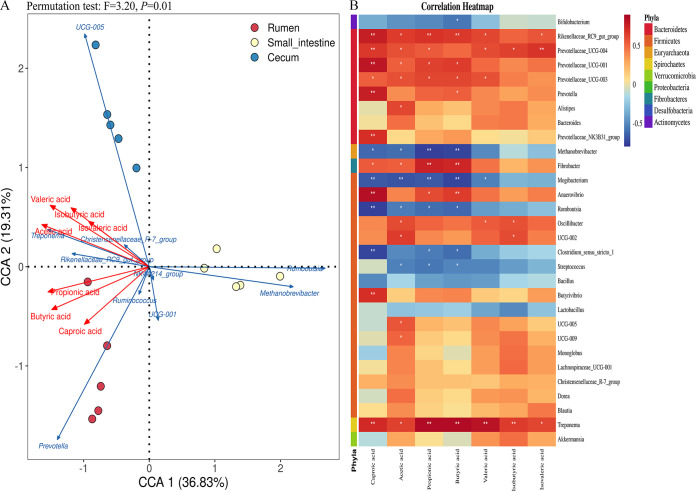
The gut microbiota of sika deer has been widely investigated, but the spatial distribution of symbiotic microbes among physical niches in the gastrointestinal tract remains to be established. While feces are the most commonly used biological samples in these studies, the accuracy of fecal matter as a proxy of the microbiome at other gastrointestinal sites is as yet unknown. In the present study, luminal contents obtained along the longitudinal axis of deer gastrointestinal tract (rumen, reticulum, omasum, abomasum, small intestine, cecum, colon, and rectum) were subjected to 16S rRNA gene sequencing for profiling of the microbial composition, and samples from the rumen, small intestine, and cecum were subjected to metabolomic analysis to evaluate short-chain fatty acid (SCFA) profiles. Prevotella bacteria were the dominant gastric core microbes, while Christensenellaceae_R-7_group was predominantly observed in the intestine. While the eight gastrointestinal sites displayed variations in microbial diversity, abundance, and function, they could be clustered into stomach, small intestine, and large intestine segments, and the results further highlighted a specific microbial niche of the small intestine. SCFA levels in the rumen, small intestine, and cecum were significantly different, with Bacteroidetes and Spirochaetes were shown to play a critical role in SCFA production. Finally, the rectal microbial composition was significantly correlated with colonic and cecum communities but not those of the small intestine and four gastric sites. Quantification of the compositions and biogeographic relationships between gut microbes and SCFAs in sika deer should provide valuable insights into the interactions contributing to microbial functions and metabolites. IMPORTANCE Feces or specific segments of the gastrointestinal tract (in particular, the rumen) were sampled to explore the gut microbiome. The gastrointestinal biogeography of the luminal microbiota in ruminants, which is critical to guide accurate sampling for different purposes, is poorly understood at present. The microbial community of the rectal sample (as a proxy of fecal sample) showed higher correlation with those of other large intestinal sites relative to the small intestine or stomach, suggesting that the microbial composition is specifically shaped by the unique physiological characteristics of different gastrointestinal niches. In addition, significant differences in microbiomes and SCFAs were observed among the different gastrointestinal sites.
Keywords: biogeography; deer; gastrointestinal tract; gut microbiome; ruminants; short-chain fatty acids.
Conflict of interest statement
The authors declare no conflict of interest.
Figures
Similar articles
-
Characterisation of the bacterial community in the gastrointestinal tracts of elk (Cervus canadensis).Antonie Van Leeuwenhoek. 2019 Feb;112(2):225-235. doi: 10.1007/s10482-018-1150-5. Epub 2018 Aug 28. Antonie Van Leeuwenhoek. 2019. PMID: 30155662
-
Dynamics of Intestinal Mucosa Microbiota in Juvenile Sika Deer During Early Growth.Int J Mol Sci. 2025 Jan 22;26(3):892. doi: 10.3390/ijms26030892. Int J Mol Sci. 2025. PMID: 39940663 Free PMC article.
-
Heterogeneous development of methanogens and the correlation with bacteria in the rumen and cecum of sika deer (Cervus nippon) during early life suggest different ecology relevance.BMC Microbiol. 2019 Jun 11;19(1):129. doi: 10.1186/s12866-019-1504-9. BMC Microbiol. 2019. PMID: 31185894 Free PMC article.
-
Short-Chain Fatty Acids-A Product of the Microbiome and Its Participation in Two-Way Communication on the Microbiome-Host Mammal Line.Curr Obes Rep. 2023 Jun;12(2):108-126. doi: 10.1007/s13679-023-00503-6. Epub 2023 May 19. Curr Obes Rep. 2023. PMID: 37208544 Free PMC article. Review.
-
Fecal Microbiota Composition as a Metagenomic Biomarker of Dietary Intake.Int J Mol Sci. 2023 Mar 3;24(5):4918. doi: 10.3390/ijms24054918. Int J Mol Sci. 2023. PMID: 36902349 Free PMC article. Review.
Cited by
-
Microbial Biogeography along the Gastrointestinal Tract of a Wild Chinese Muntjac (Muntiacus reevesi).Microorganisms. 2024 Aug 4;12(8):1587. doi: 10.3390/microorganisms12081587. Microorganisms. 2024. PMID: 39203429 Free PMC article.
-
Large-scale metagenomic assembly provide new insights into the genetic evolution of gut microbiomes in plateau ungulates.NPJ Biofilms Microbiomes. 2024 Nov 6;10(1):120. doi: 10.1038/s41522-024-00597-3. NPJ Biofilms Microbiomes. 2024. PMID: 39505908 Free PMC article.
-
Fecal and vaginal microbiota of vaccinated and non-vaccinated pregnant elk challenged with Brucella abortus.Front Vet Sci. 2024 Jan 30;11:1334858. doi: 10.3389/fvets.2024.1334858. eCollection 2024. Front Vet Sci. 2024. PMID: 38352039 Free PMC article.
-
Unraveling the distinctive gut microbiome of khulans (Equus hemionus hemionus) in comparison to their drinking water and closely related equids.Sci Rep. 2025 Jan 22;15(1):2767. doi: 10.1038/s41598-025-87216-z. Sci Rep. 2025. PMID: 39843625 Free PMC article.
-
Linking Gut Microbiota and Stereotypic Behavior of Endangered Species Under Ex Situ Conservation: First Evidence from Sun Bears.Animals (Basel). 2025 Feb 4;15(3):435. doi: 10.3390/ani15030435. Animals (Basel). 2025. PMID: 39943205 Free PMC article.
References
-
- Ermund A, Schütte A, Johansson MEV, Gustafsson JK, Hansson GC. 2013. Studies of mucus in mouse stomach, small intestine, and colon. I. Gastrointestinal mucus layers have different properties depending on location as well as over the Peyer’s patches. Am J Physiol Gastrointest Liver Physiol 305:G341–G347. 10.1152/ajpgi.00046.2013. - DOI - PMC - PubMed
Publication types
MeSH terms
Substances
LinkOut - more resources
Full Text Sources
