. 2022 Oct 4;82(19):3532-3548.
doi: 10.1158/0008-5472.CAN-22-0018.

Targeting Plk1 Sensitizes Pancreatic Cancer to Immune Checkpoint Therapy

Affiliations

Targeting Plk1 Sensitizes Pancreatic Cancer to Immune Checkpoint Therapy

Zhuangzhuang Zhang et al. Cancer Res. .

Abstract

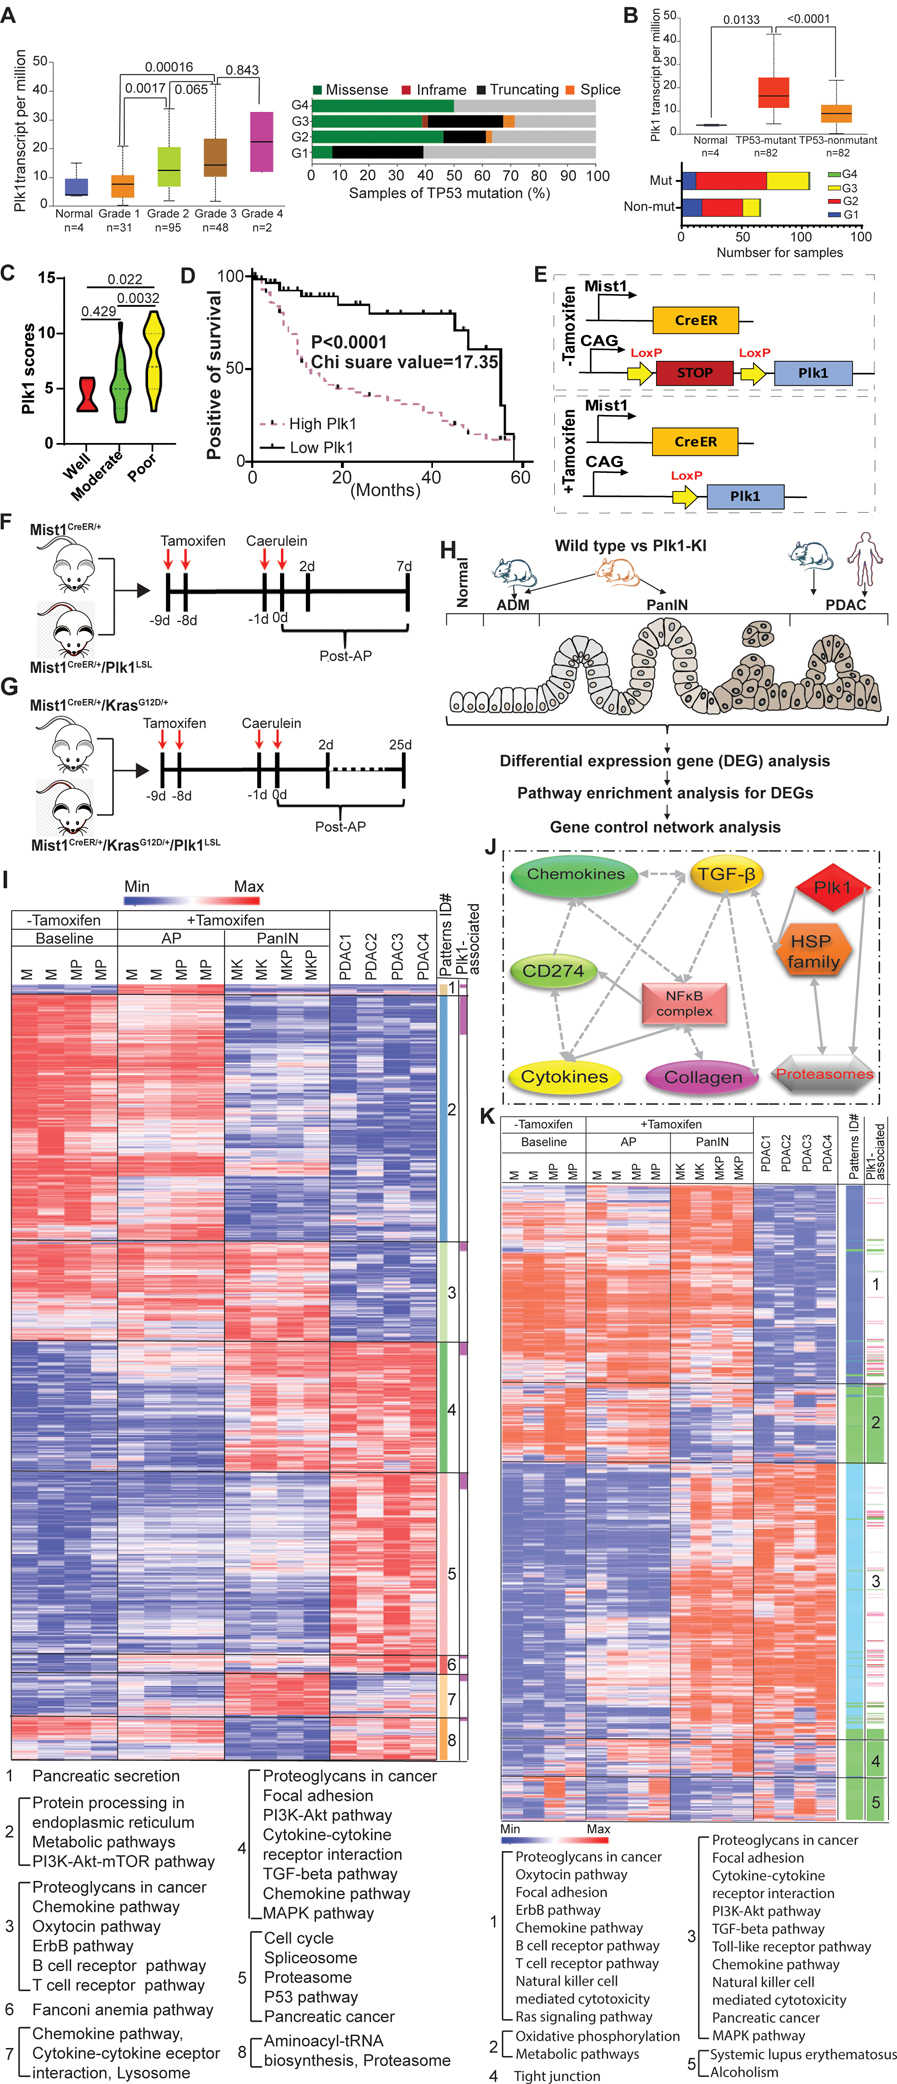
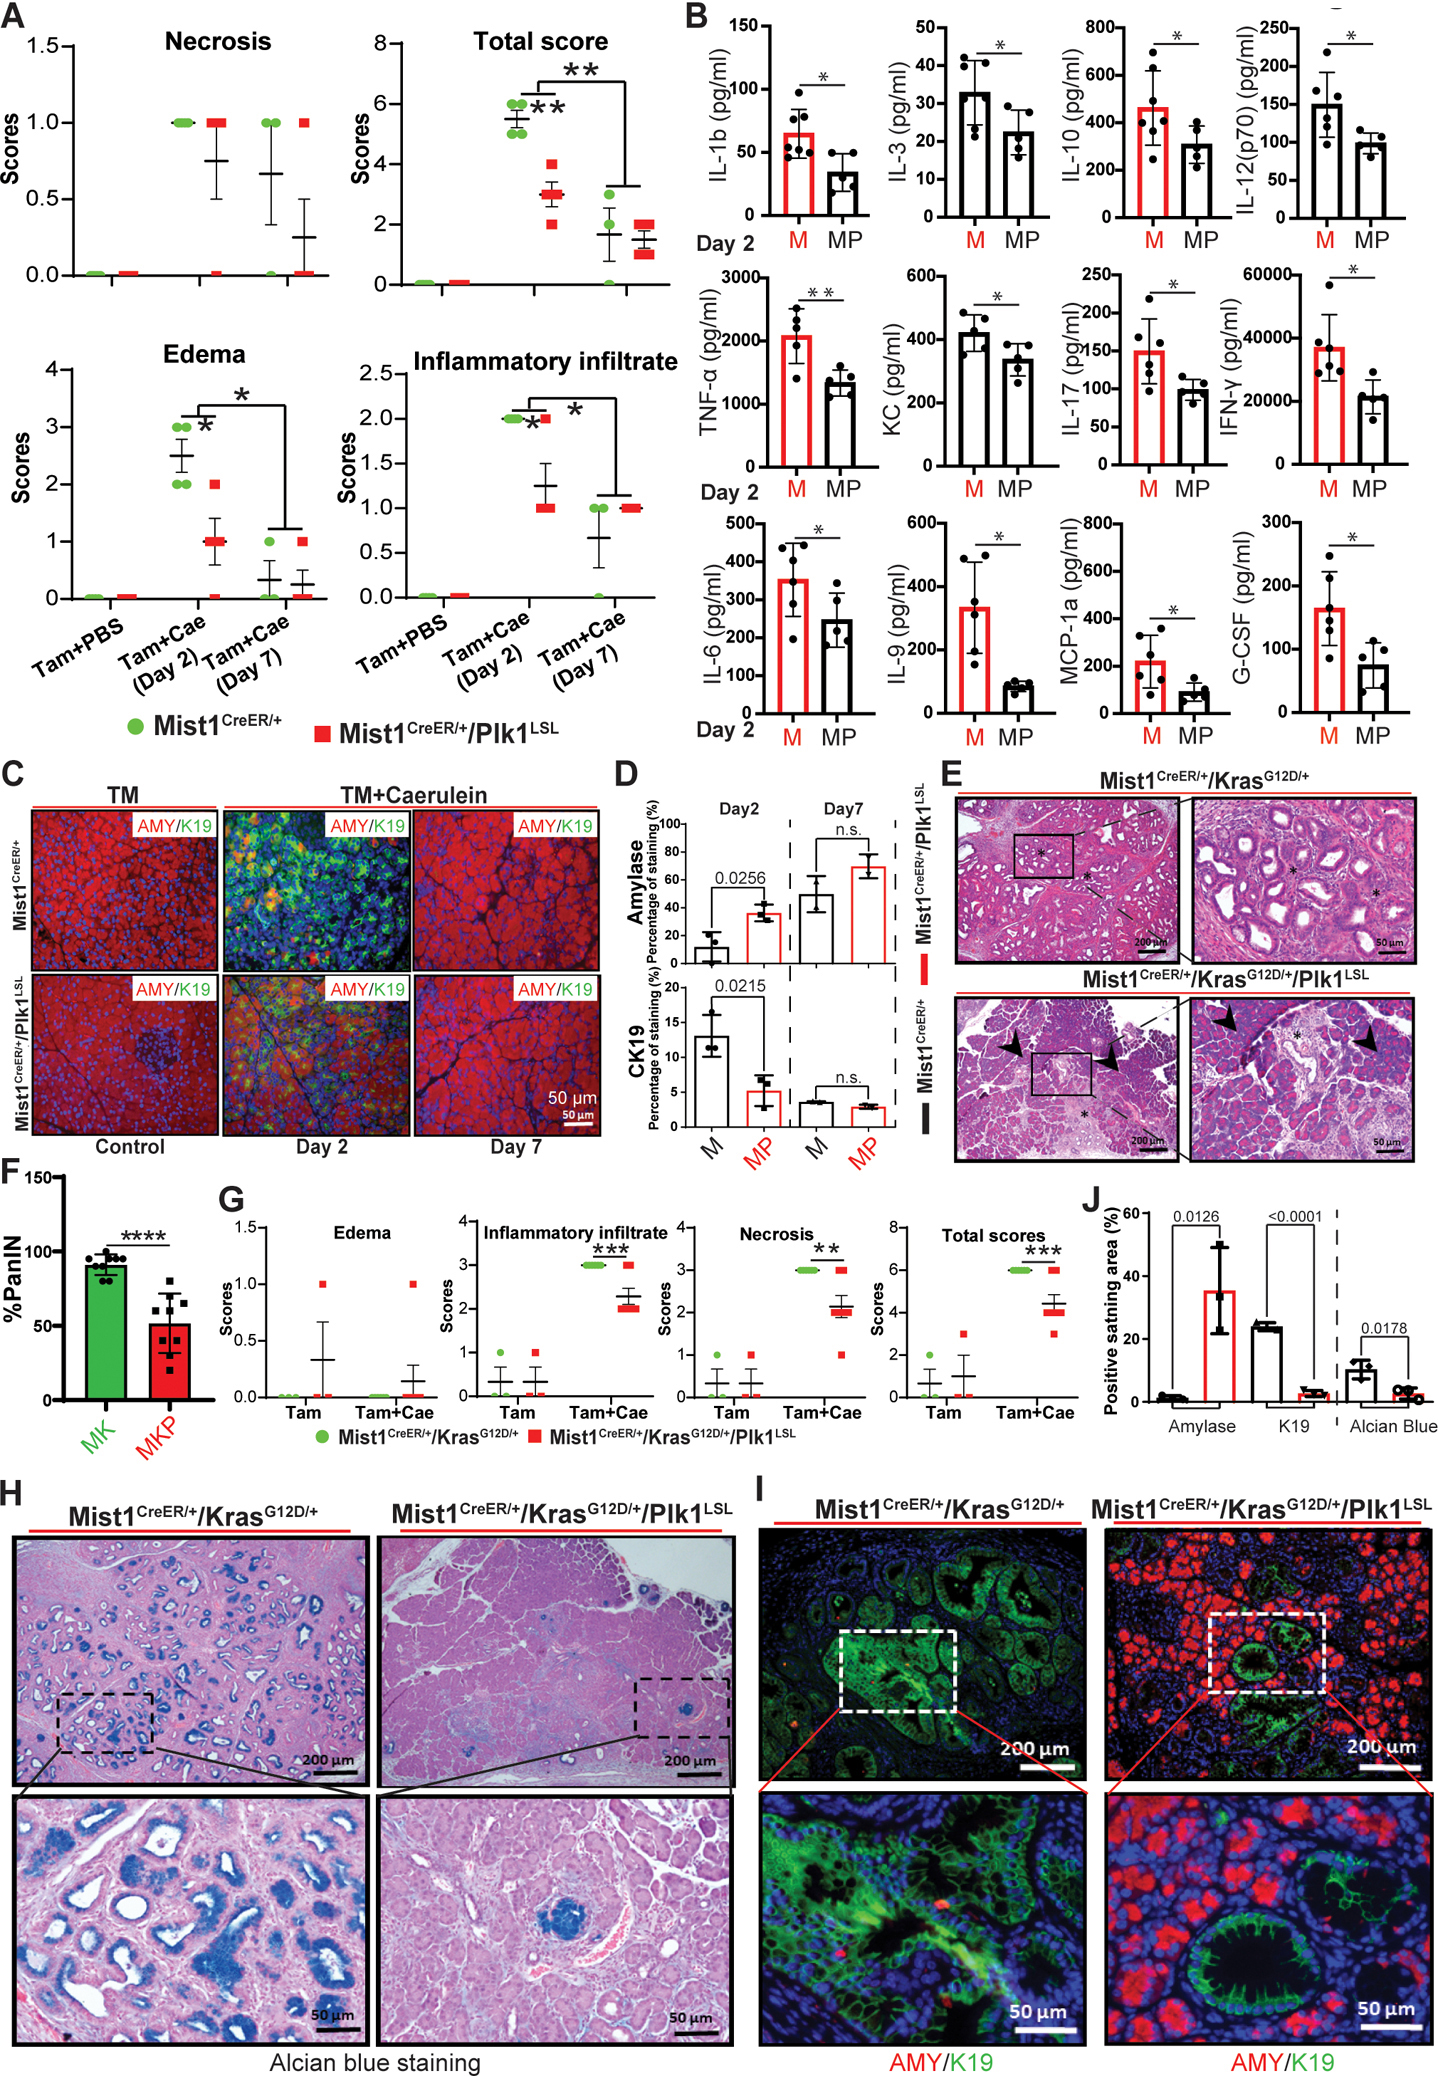
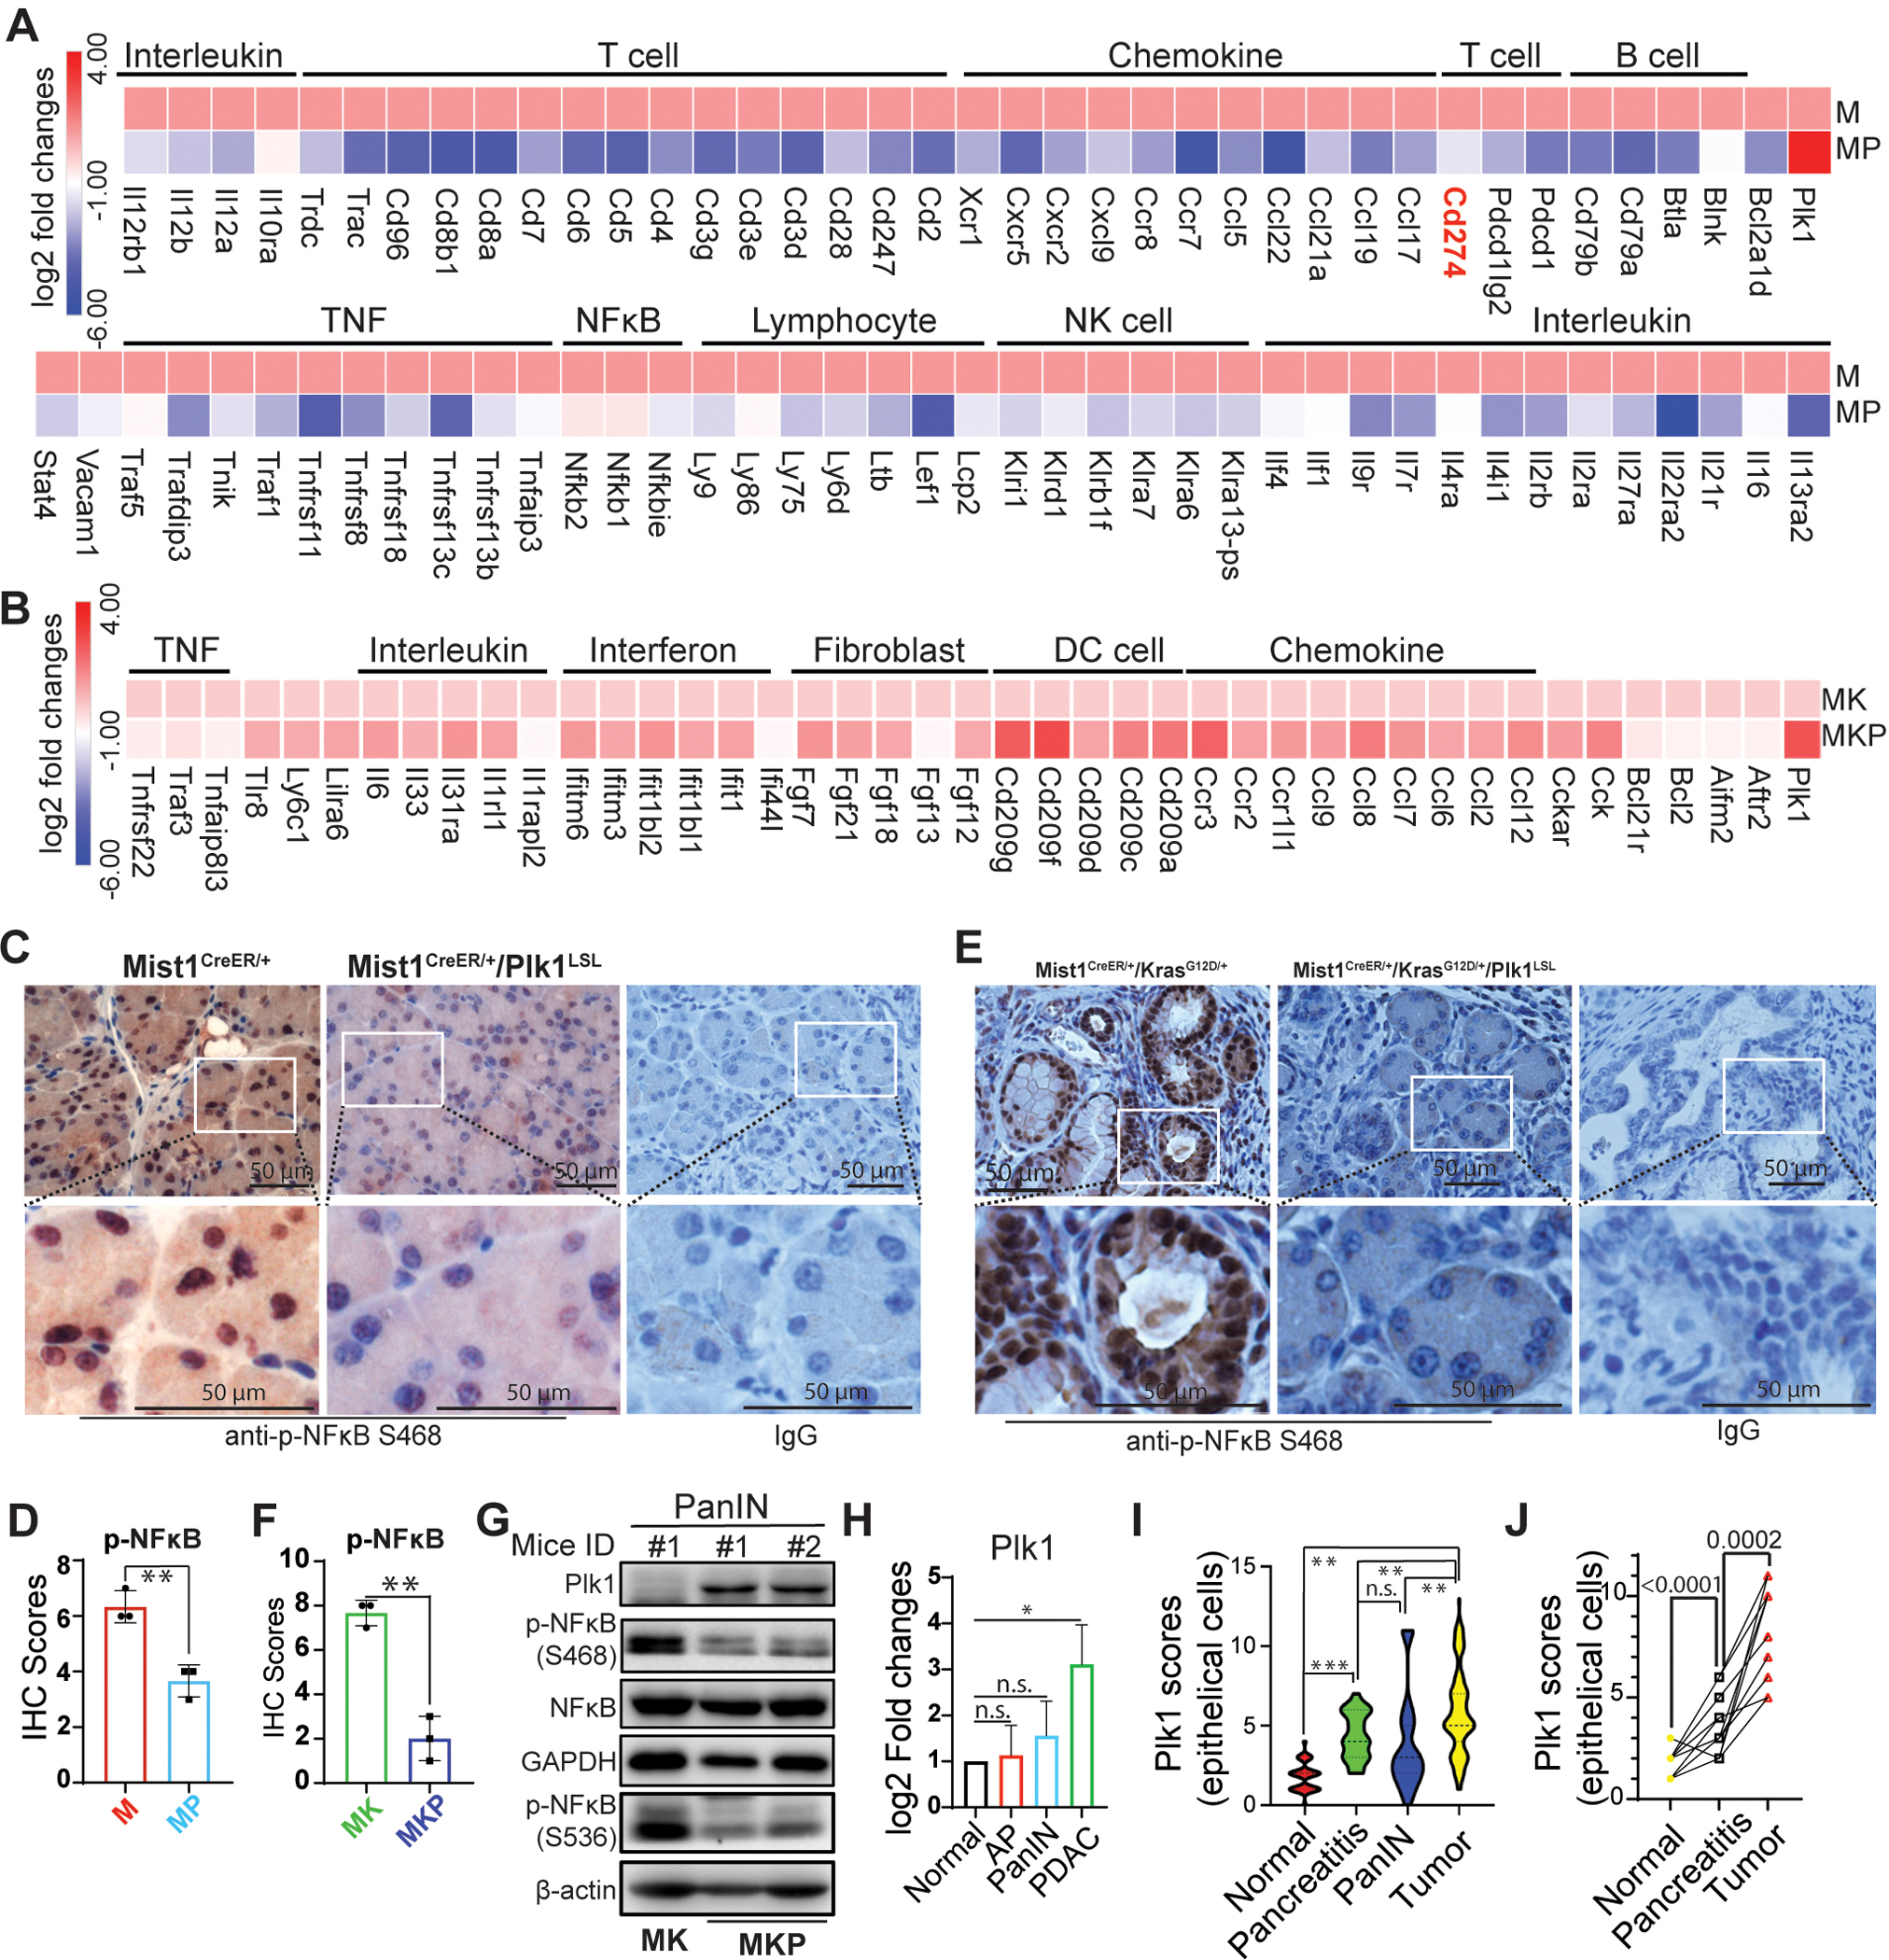
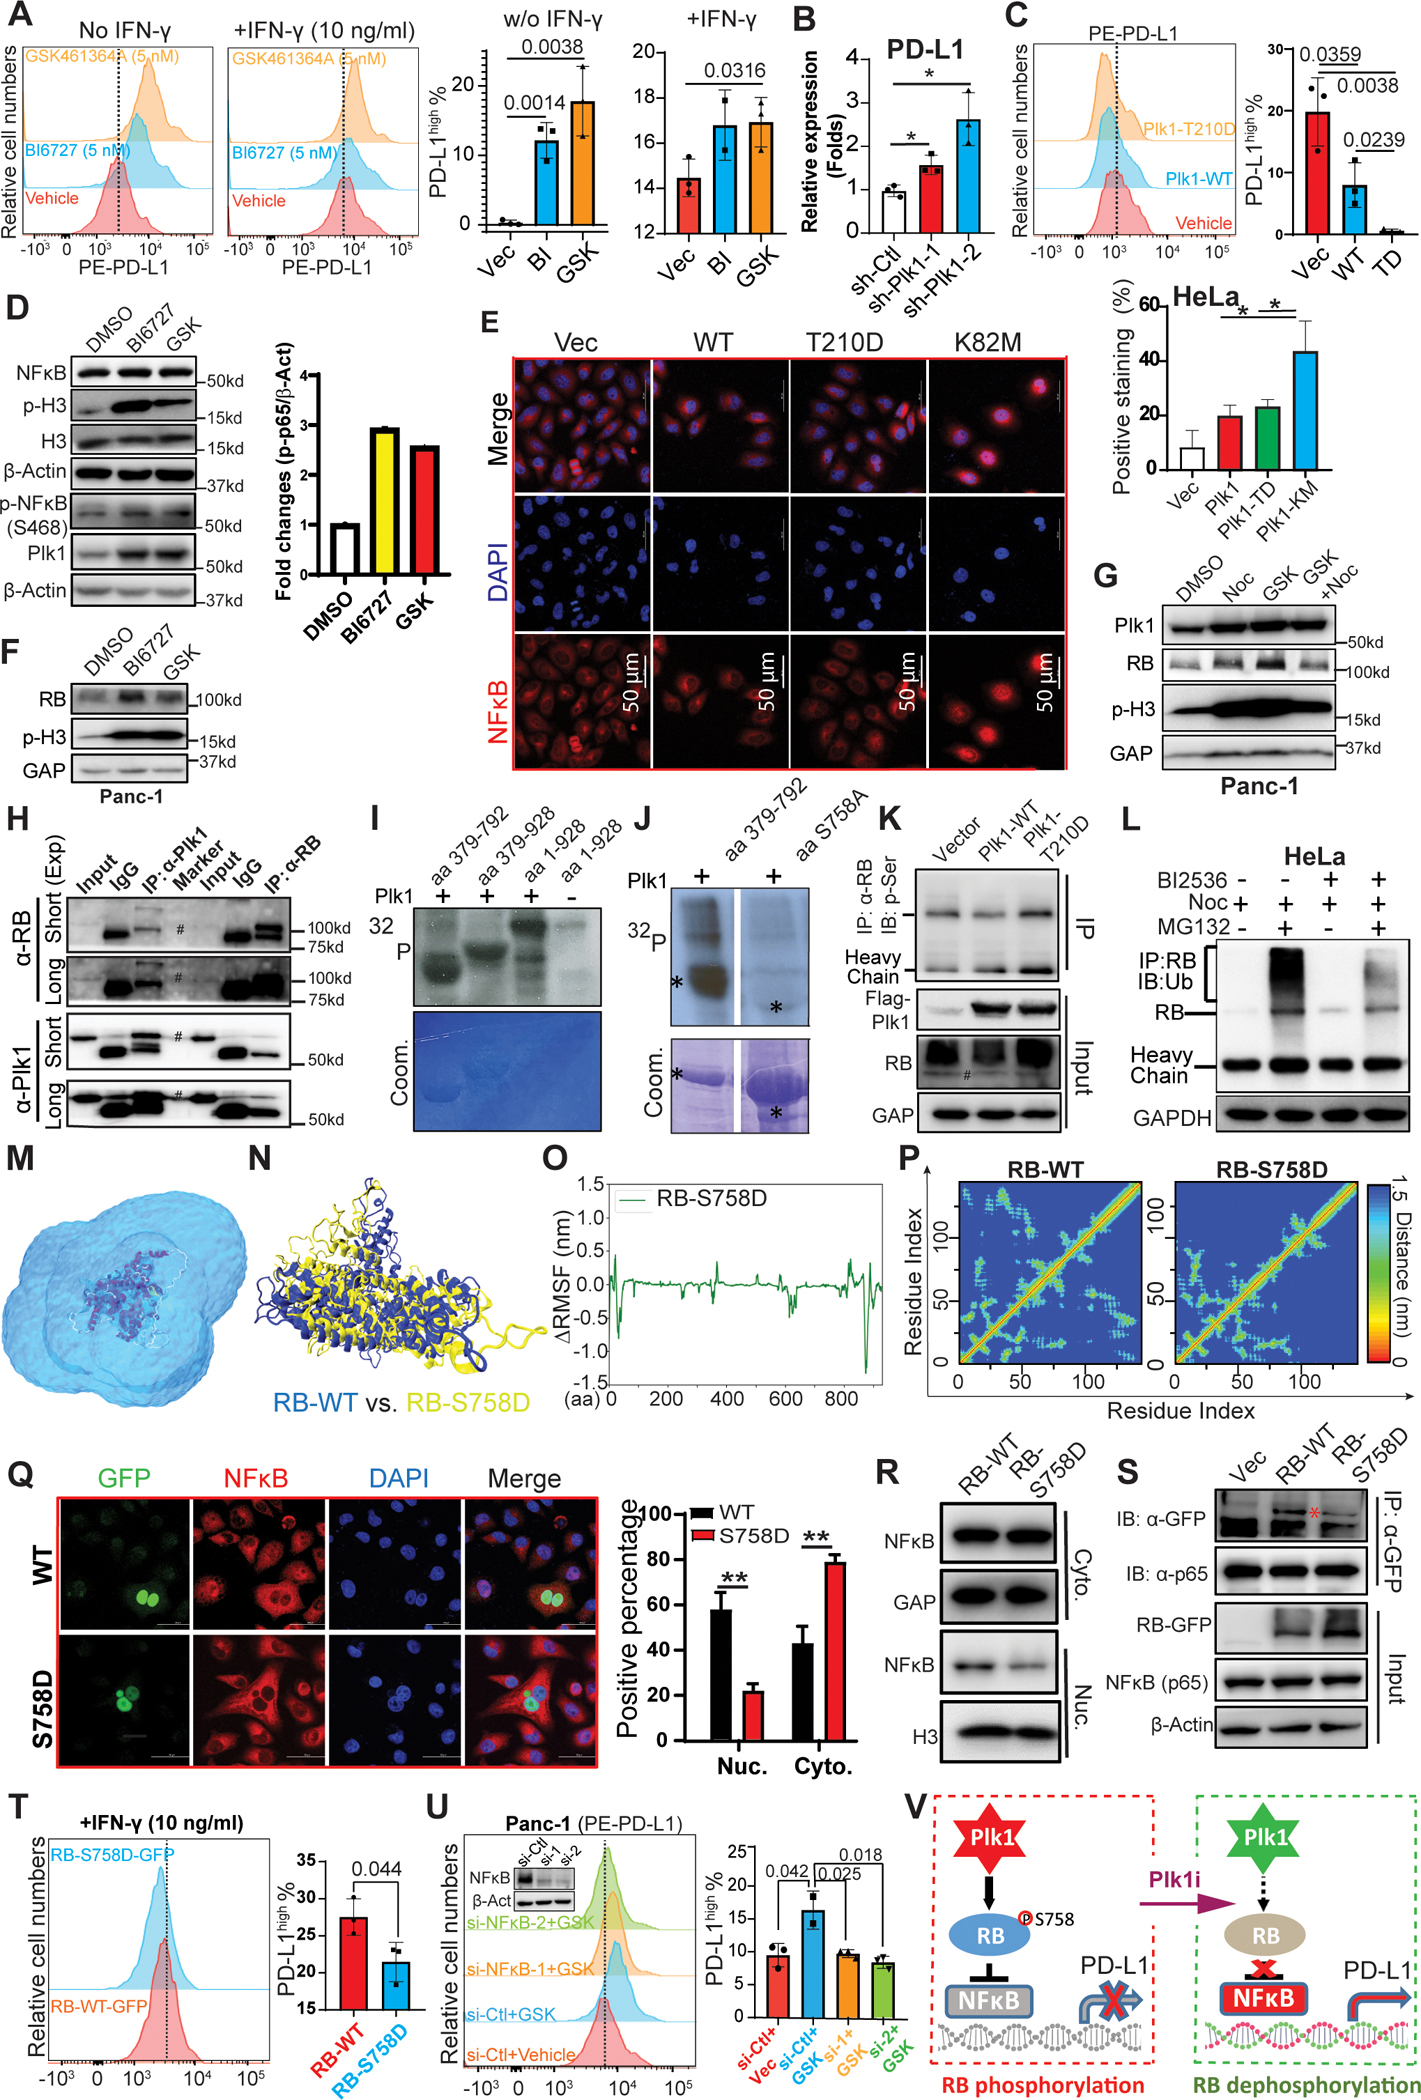
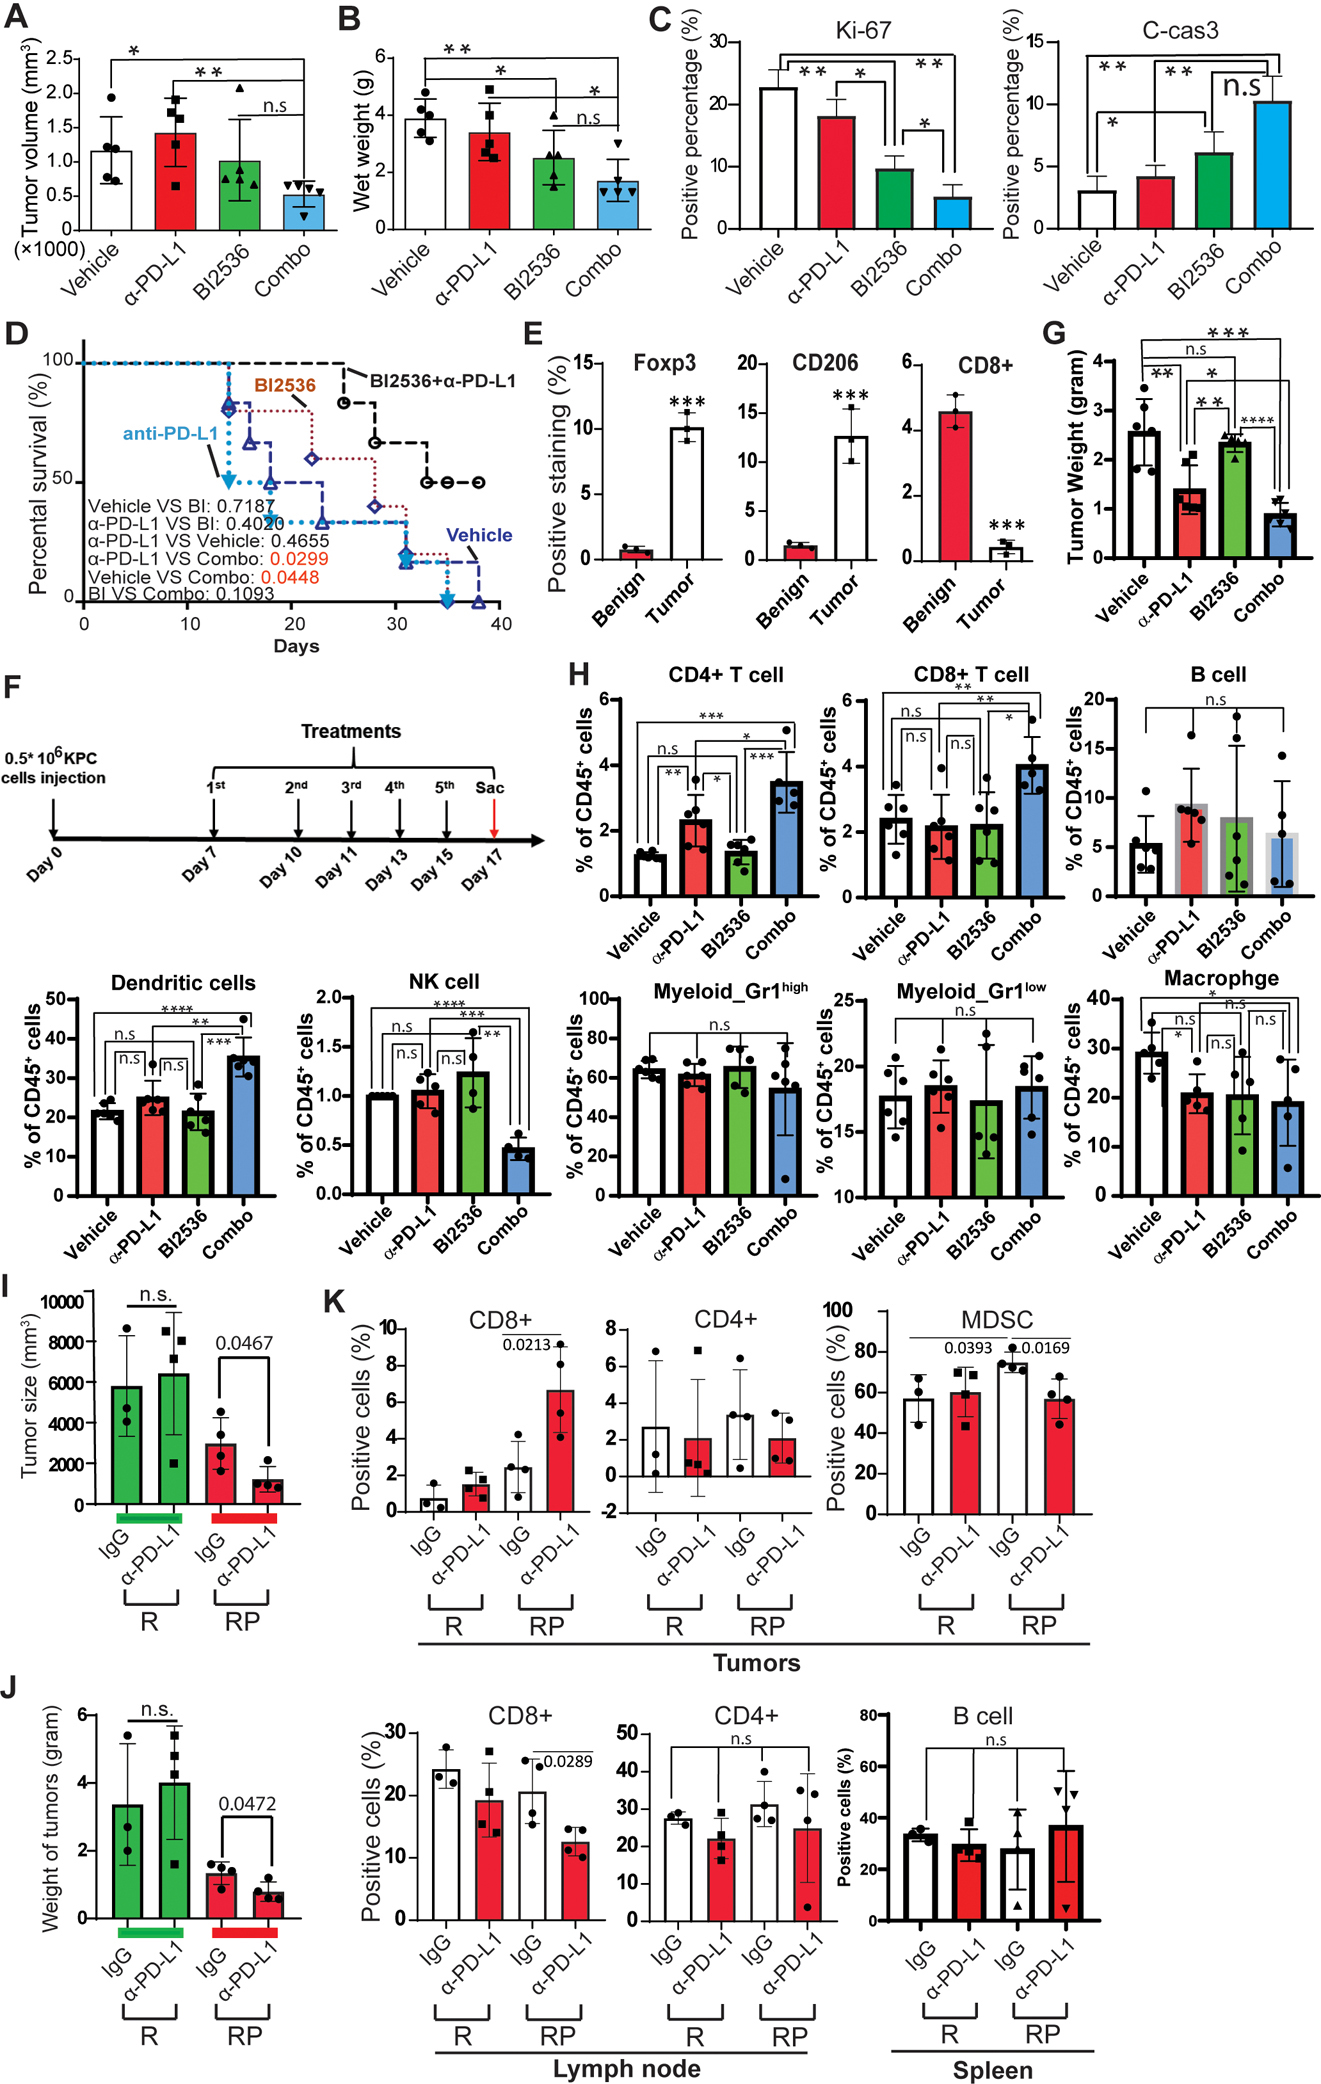
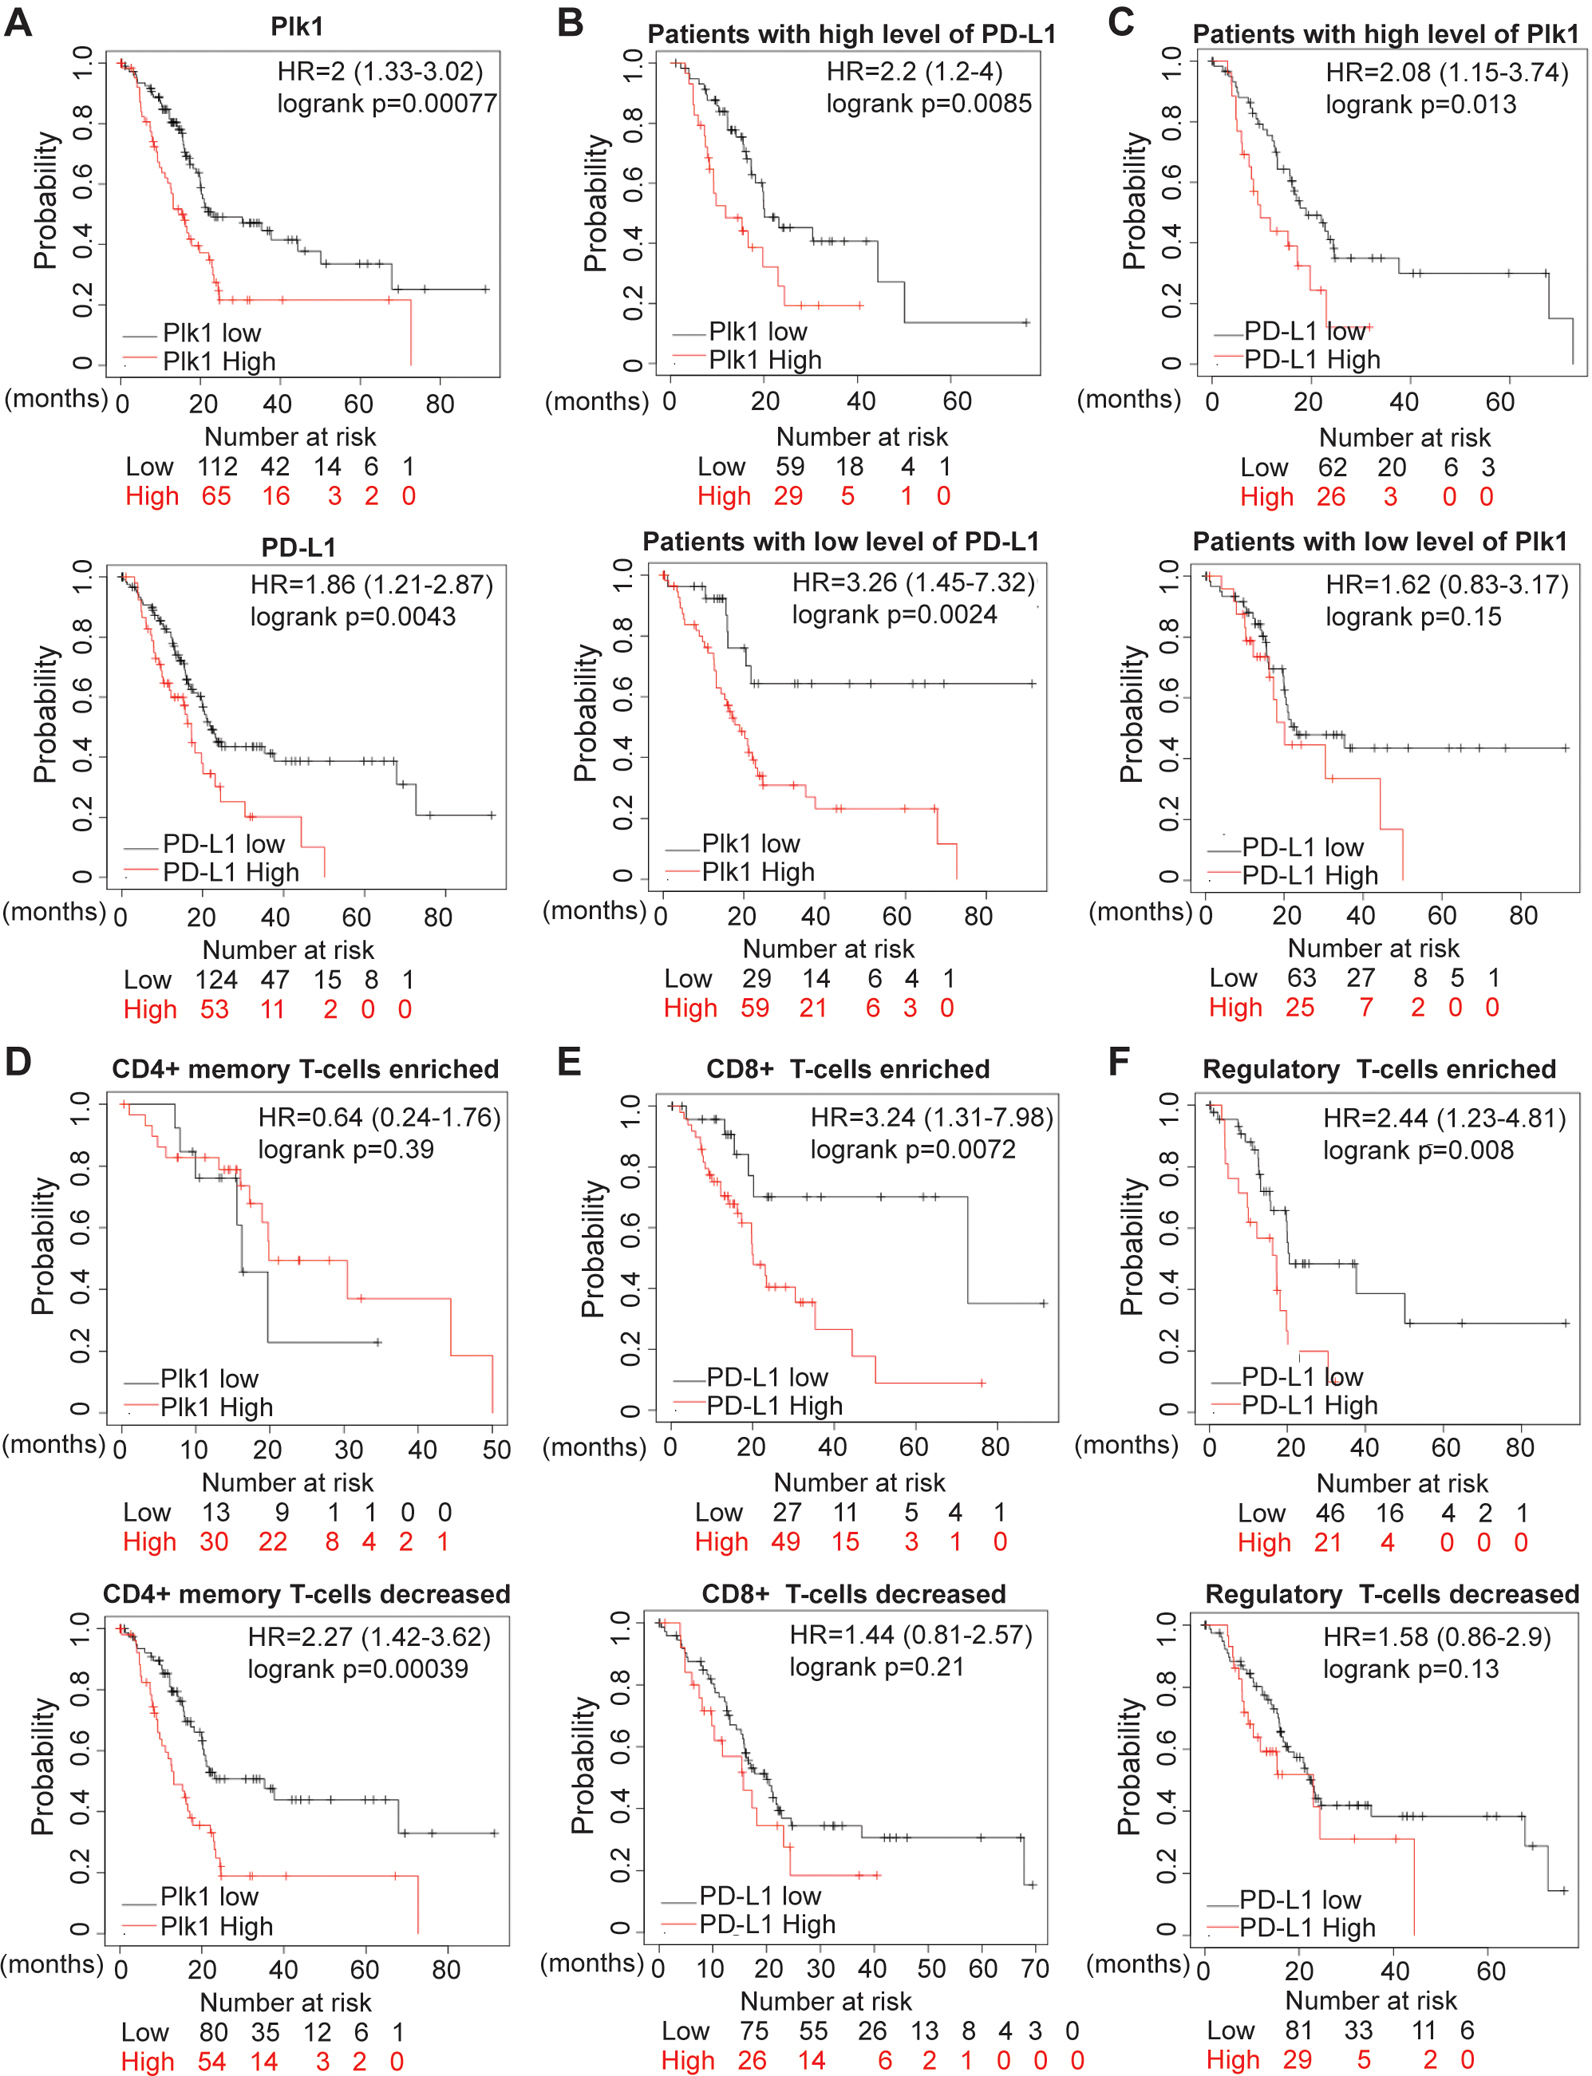
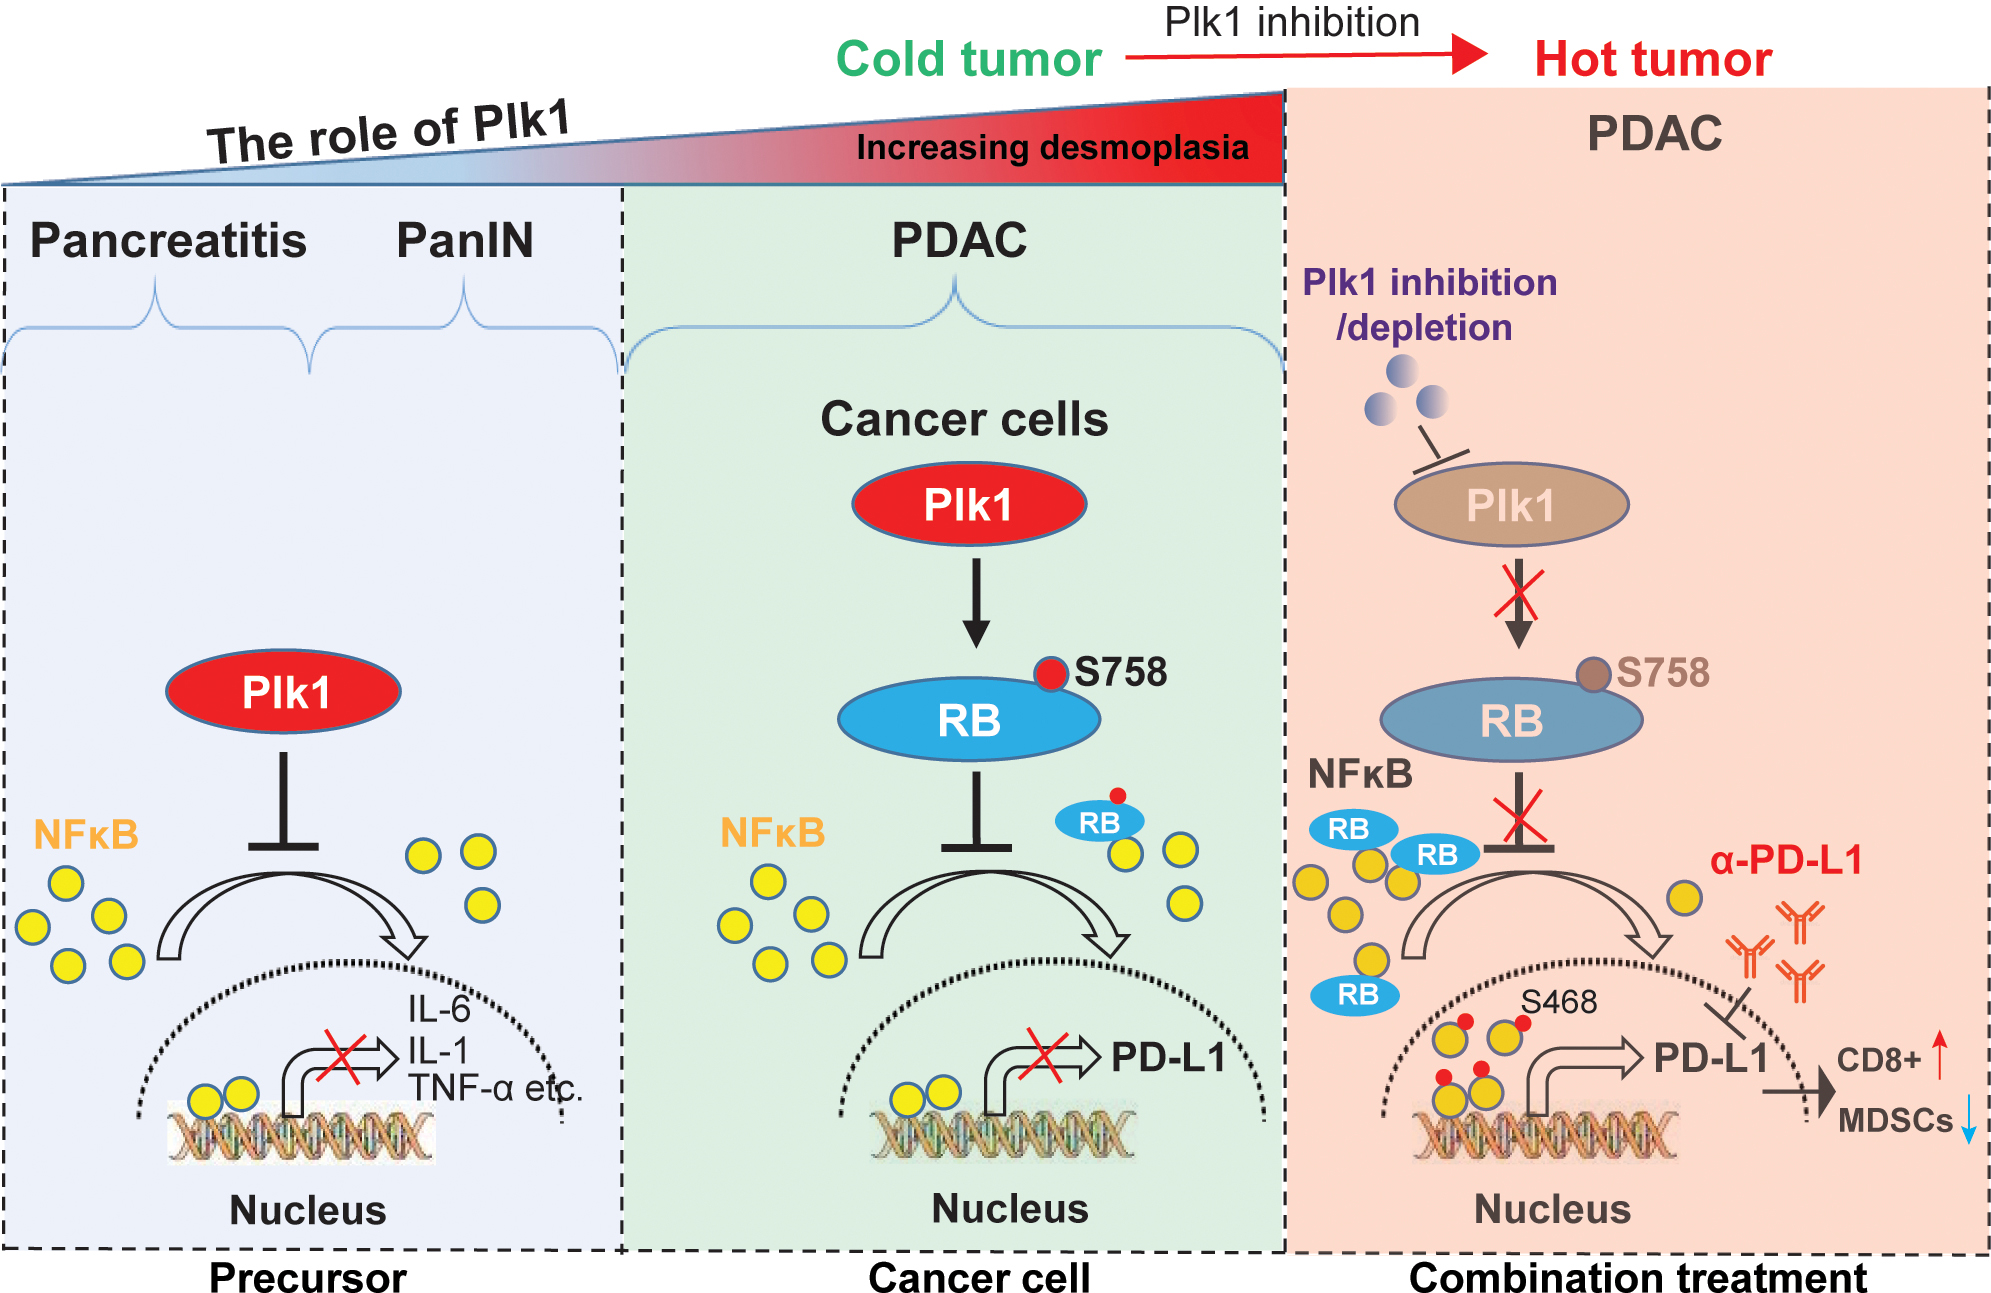
Polo-like kinase 1 (Plk1) plays an important role in cell-cycle regulation. Recent work has suggested that Plk1 could be a biomarker of gemcitabine response in pancreatic ductal adenocarcinoma (PDAC). Although targeting Plk1 to treat PDAC has been attempted in clinical trials, the results were not promising, and the mechanisms of resistance to Plk1 inhibition is poorly understood. In addition, the role of Plk1 in PDAC progression requires further elucidation. Here, we showed that Plk1 was associated with poor outcomes in patients with PDAC. In an inducible transgenic mouse line with specific expression of Plk1 in the pancreas, Plk1 overexpression significantly inhibited caerulein-induced acute pancreatitis and delayed development of acinar-to-ductal metaplasia and pancreatic intraepithelial neoplasia. Bioinformatics analyses identified the regulatory networks in which Plk1 is involved in PDAC disease progression, including multiple inflammation-related pathways. Unexpectedly, inhibition or depletion of Plk1 resulted in upregulation of PD-L1 via activation of the NF-κB pathway. Mechanistically, Plk1-mediated phosphorylation of RB at S758 inhibited the translocation of NF-κB to nucleus, inactivating the pathway. Inhibition of Plk1 sensitized PDAC to immune checkpoint blockade therapy through activation of an antitumor immune response. Together, Plk1 suppresses PDAC progression and inhibits NF-κB activity, and targeting Plk1 can potentiate the efficacy of immunotherapy in PDAC.

Significance: Inhibition of Plk1 induces upregulation of PD-L1 expression in pancreatic ductal adenocarcinoma, stimulating antitumor immunity and sensitizing tumors to immunotherapy.


Conflict of interest statement

Declaration of interests: The authors declare no potential conflicts of interest.

Figures

Figure 1.
Figure 1.. Plk1 is associated with a poor prognosis in PDAC and is involved in PDAC progression.
A, Plk1 expression and TP53 mutation status in pancreatic cancer patients with different tumor grades from TCGA. B, Plk1 expression and tumor grades in patients with different TP53 mutation status. Transcription data were analyzed by unpaired Student t test. C, The levels of Plk1 in tumor samples with different differentiation status. Statistical analysis of IHC staining was performed by unpaired Student t test. D, Correlation analysis between survival and expression level of Plk1 in a tissue microarray. Wilcoxon test was used to calculate patient survival. E, Schematic representation of the Plk1LSL alleles from tamoxifen-untreated and -treated mice. F, Time course of caerulein-induced acute pancreatitis. G, Time course of KrasG12D/+-driven PanIN development. H, Overview of bioinformatics analysis strategy. I, Heatmap for genes differentially expressed across AP, PanIN, and PDAC. Mouse PDAC were derived from Mist1CreER+/KrasG12D/+/p53R172H/+ mice. J, IPA network analysis identified the enrichment of immune-associated pathways across baseline, AP, PanIN, and PDAC. One-way ANAVO analysis was used to evaluate the statistical significance (p-value <0.001). The node colored in red denotes its variation significance of p-value. Solid lines denote direct interactions, whereas broken lines denote indirect interactions. K, Heatmap for genes identified by mapping Plk1-associated genes and gene signature of patterns 3 and 4 in I. M: Mist1CreER/+, MP: Mist1CreER/+/Plk1LSL, MK: Mist1CreER/+/KrasG12D/+, MKP: Mist1CreER/+/KrasG12D/+/Plk1LSL.
Figure 2.
Figure 2.. Effect of induction of Plk1 on progression of KrasG12D/+-driven PanINs in the pancreas.
A, Quantification of H&E staining of Mist1CreER/+ pancreas samples with or without Plk1 expression in the absence of caerulein treatment or post-treatment for the indicated times. B, Detection of inflammatory cytokines and chemokines by ELISA in mice 2 days post-caerulein injection. C, IF staining with acinar cell marker amylase (AMY) and ductal cell marker K19 from pancreas samples. D, Statistical analysis of IF staining of amylase and CK19 in C. n=3. Representative images (E) and quantification (F) of PanIN lesions in mouse pancreas. G, Quantification of H&E staining of mouse pancreas samples with or without Plk1 expression 25 days post-caerulein injection. Asterisks indicate areas of PanIN lesions, whereas arrowheads highlight areas of normal acinar tissue. H, Alcian blue staining of ducts for detection of mucin (dark blue) was performed on paraffin sections prepared from the indicated pancreas samples. I, IF staining with markers of acinar cells (amylase) and ductal cells (K19) on paraffin sections prepared from Mist1CreER/+/KrasG12D/+ pancreas samples with or without Plk1 expression. J, Quantification of amylase/K19/Alcian blue-positive areas in Mist1CreER/+/KrasG12D and Mist1CreER/+/KrasG12D/+/Plk1LSL pancreata. Multiple pancreas sections were examined (means ± sem of the means). n=3. Inflammation and staining data were analyzed by unpaired Student t test. *, p<0.05, **, p<0.01, ***, p<0.001. M: Mist1CreER/+, MP: Mist1CreER/+/Plk1LSL; MK: Mist1CreER/+/KrasG12D/+, MKP: Mist1CreER/+/KrasG12D/+/Plk1LSL.
Figure 3.
Figure 3.. Plk1 inhibits inflammation via silencing NFκB signaling in precursor of PDAC.
RNAseq analysis in acute pancreatitis (2 days post caerulein injection) (A) and PanIN (25 days post caerulein injection) (B). C, IHC staining against phosphor-NFκB in Mist1CreER/+ pancreas samples with or without Plk1 expression in the absence of caerulein treatment or post-treatment for 2 days. D, Quantification of IHC staining in C. E, IHC staining against phosphor-NFκB in Mist1CreER/+/KrasG12D/+ pancreas samples with or without Plk1 expression 25 days post caerulein injection. F, Quantification of IHC staining in E. G, Whole lysates of pancreas of mice with PanIN were harvested for IB. H, The endogenous levels of Plk1 in normal, acute pancreatitis (AP), PanIN, and PDAC tissues. AP: Mist1CreER+, PanIN: Mist1CreER+/KrasG12D/+, PDAC: Mist1CreER+/KrasG12D/+/p53R172H/+. I, Detection of the levels of Plk1 in various human pancreatic samples by IHC. J, Measuring dynamic changes of expression of Plk1 in the human matched normal, pancreatitis and tumors samples from the same patients (n=17). M: Mist1CreER/+, MP: Mist1CreER/+/Plk1LSL, MK: Mist1CreER/+/KrasG12D/+, MKP: Mist1CreER/+/KrasG12D/+/Plk1LSL. TM: Tamoxifen. Data was analyzed by unpaired Student t test. *, p<0.05, **, p<0.01, ***, p<0.001.
Figure 4.
Figure 4.. Plk1 inhibition-induced upregulation of PD-L1 is NFκB dependent.
A, Panc-1 cells were pre-treated with inhibitors of Plk1, BI6727 (BI: 5 nM) and GSK461634A (GSK: 5 nM), for 8 hours, incubated with IFN-γ and Plk1 inhibitors overnight, and were harvested for flow cytometry assay. B, Transcriptions of Plk1 and PD-L1 were measured by Q-PCR in Panc-1 cells upon Plk1 depletion. n=3. C, Cells were transfected with Plk1-WT or -T210D mutant, followed by flow cytometry assay. D, Panc-1 cells were treated with BI6727 (50 nM) or GSK461634A (GSK: 50 nM) overnight, and harvested for IB. E, IF staining against NFκB in HeLa cells overexpressing different forms of Plk1 (WT, constitutively active T210D mutant, kinase-defective K82M mutant). n=3. F & G, Panc-1 cells were treated with Plk1 inhibitors in the absence or presence of nocodazole and were harvested for IB against RB. H, Detection of the interaction of Plk1 and RB in Panc-1 cells were analyzed by reciprocal IP. I, Plk1 targets middle domain of RB. Purified Plk1 was incubated with purified GST-RB regions (aa1–928, aa379–792, aa379–928) in the presence of [γ−32P] ATP. The reaction mixtures were resolved by SDS-PAGE, stained with Coomassie brilliant blue (Coom.) and detected by autoradiography. J, Plk1 was incubated with recombinant RB-aa379–792 (WT or S758A) as in I. K, HEK293T cells were transfected with Plk1 (WT or T210D mutant) and were harvested for IP with anti-RB, followed by IB against p-Ser. L, HeLa cells were synchronized with nocodazole (30 ng/ml), then incubated with 50 nM BI2536 and 8 μg/ml MG132 for 18 hours. Cells were harvested for IP with anti-RB, followed by IB against ubiquitin. M, The snapshot of a simulation system containing wild-type RB in an explicit solvent. The RB protein: New-Cartoon model, colored based on the secondary structure. The water molecules, Na+ and Cl ions are shown in the QuickSurf model, colored by ColorID: blue2. N, The snapshot of the final conformations of RB-S758D (yellow) and RB-WT (blue). O, ΔRMSF of Cα atoms on the RB-S758D protein. The value of ΔRMSFi is calculated as RMSFi (mutant) – RMSFi (wild type), where i refers to the Cα atom on amino acid residue i. A RMSF value >0 means the mutant is more flexible compared with wild type RB. A RMSF value <0 indicates the mutant is more rigid than the wild type RB protein. P, Mean smallest distance between Cα atoms of amino acid residues on RB-C domain for RB-WT and RB-S758D. Q, HeLa cells were transfected with GFP-RB (WT or S758D), and subjected to IF staining with antibodies against GFP and NFκB, followed by quantification. n=3. R, Detection of subcellular localization of NFκB by IB in Panc-1 cells transfected with different forms of RB (WT or S758D). S, Detection of interactions between NFκB (p65) and RB mutants in HEK293T cells. T, Detection of PD-L1 level by flow cytometry in Panc-1 cells transfected with different forms of RB (WT or S758D) upon IFN-γ treatment. U, Panc-1 cells were depleted of NFκB, treated with 5 nM GSK461364 overnight, and harvested for flow cytometry to measure the level of PD-L1, followed by quantification. V, A model depicting RB-S758 phosphorylation-mediated regulation of NFκB activity and PD-L1 expression. Q-PCR, IF staining and flow cytometry data were analyzed by unpaired Student t test. *, p<0.05, **, p<0.01, ***, p<0.001.
Figure 5.
Figure 5.. Depletion of Plk1 re-sensitizes immune response in PDAC.
A-D, KPC cells were orthotopically injected into wild type mouse pancreas, followed by treatment with BI2536 and α-PD-L1 antibody. Volume (A) and wet weight (B) of KPC tumors from selected treatment groups. C, Statistical analysis of IF staining of Ki-67 and cleaved caspase 3 with unpaired Student t test. n=3. D, Kaplan-Meier survival analysis of KPC mice treated with vehicle or BI2536 ± anti-PD-L1. Wilcoxon test was performed to analyze mice survival with different treatments. E, Quantification of IF staining against CD206, Foxp3 and CD8 in human patient samples. F, Time course of treatments with BI2536 and/or α-PD-L1 antibodies. After wild type mice were injected orthotopically with 5×10⁵ KPC cells, mice were treated with BI2536 (200 μg/mouse) and α-PD-L1 (250 μg/mouse) 7 days post KPC cell injection. G, Tumor weight at the end of the experiment. H, Flow cytometry was performed to analyze infiltration of immune cells in tumors after the indicated treatments. I-K, Rosa26CreERt2/Plk1f/+ mice were treated with 1.5 mg/per 20g body weight tamoxifen for 3 consecutive days, then with 200 μg/mouse α-PD-L1 every other day for 3 weeks. I, Tumor size. J, Tumor weight. K, Statistic analysis of flow cytometry analysis of CD8+ and CD4+ cells in lymph nodes (left), tumors (middle) and MDSCs in tumors (right). R: Rosa26CreERt2, RP: Rosa26CreERt2/Plk1f/+. IF staining, tumor mass and flow cytometry data were analyzed by unpaired Student t test. *, p<0.05, **, p<0.01, ***, p<0.001, ****, p<0.0001
Figure 6.
Figure 6.. Plk1 and PD-L1 association with poor prognosis in human PDAC is immune cell filtration determined.
A, Survival analysis of pancreatic cancer patients with Plk1 and PD-L1 expressions in patients from TCGA. B, Survival analysis of patients with low and higher Plk1 expression in patients grouped by expression levels of PD-L1. C, Survival analysis of patients with low and higher PD-L1 expression in patients grouped by expression levels of Plk1. D, Survival analysis of patients with low and higher Plk1 expression in patients grouped by enrichment of CD4+ T-cells. E, Survival analysis of patients with low and higher PD-L1 expression in patients grouped by enrichment of CD8+ T-cells. F, Survival analysis of patients with low and higher PD-L1 expression in patients grouped by enrichment of Tregs.
Figure 7.
Figure 7.. Schematic summary.
The mechanisms underlying the role of Plk1 in PDAC initiation and progression. At the stages of pancreatitis and PanIN, Plk1 expression inhibits induction of inflammation and delays ADM and PanIN by inactivating NFκB pathway through blocking nuclear translocation of NFκB (Left). When disease progresses to PDAC, Plk1 phosphorylation of RB at S758 inhibits its association with NFκB, contributing to reduced nuclear localization of NFκB and reduced expression of PD-L1 (Middle). Upon treatment with Plk1i, lack of RB phosphorylation promotes its association with NFκB, resulting in increased nuclear localization of phosphor NFκB and elevated expression of PD-L1 (Right). Plk1 inhibition-induced undesirable upregulation of PD-L1 provides a strong rationale for combination Plk1i and α-PD-L1 to treat PDAC. The combination of Plk1i and α-PD-L1 changes the “cold” tumor to “hot” tumor by restoring anti-tumor immune response via promoting CD8 positive T-cells and reducing MDSC cells populations and finally sensitizes PDAC to α-PD-L1 treatment again (Right).

References

    1. Siegel RL, Miller KD, Fuchs HE, Jemal A. Cancer Statistics, 2021. CA Cancer J Clin 2021;71:7–33 - PubMed
    1. Seton-Rogers S Tumorigenesis: Pushing pancreatic cancer to take off. Nat Rev Cancer 2012;12:739. - PubMed
    1. Mizrahi JD, Surana R, Valle JW, Shroff RT. Pancreatic cancer. Lancet 2020;395:2008–20 - PubMed
    1. Amrutkar M, Gladhaug IP. Pancreatic Cancer Chemoresistance to Gemcitabine. Cancers (Basel) 2017;9 - PMC - PubMed
    1. Strebhardt K Multifaceted polo-like kinases: drug targets and antitargets for cancer therapy. Nat Rev Drug Discov 2010;9:643–60 - PubMed

Publication types

MeSH terms