. 2022 Oct 17;82(20):3673-3686.
doi: 10.1158/0008-5472.CAN-21-3186.

A Distinct Chromatin State Drives Therapeutic Resistance in Invasive Lobular Breast Cancer

Affiliations

A Distinct Chromatin State Drives Therapeutic Resistance in Invasive Lobular Breast Cancer

Agostina Nardone et al. Cancer Res. .

Abstract

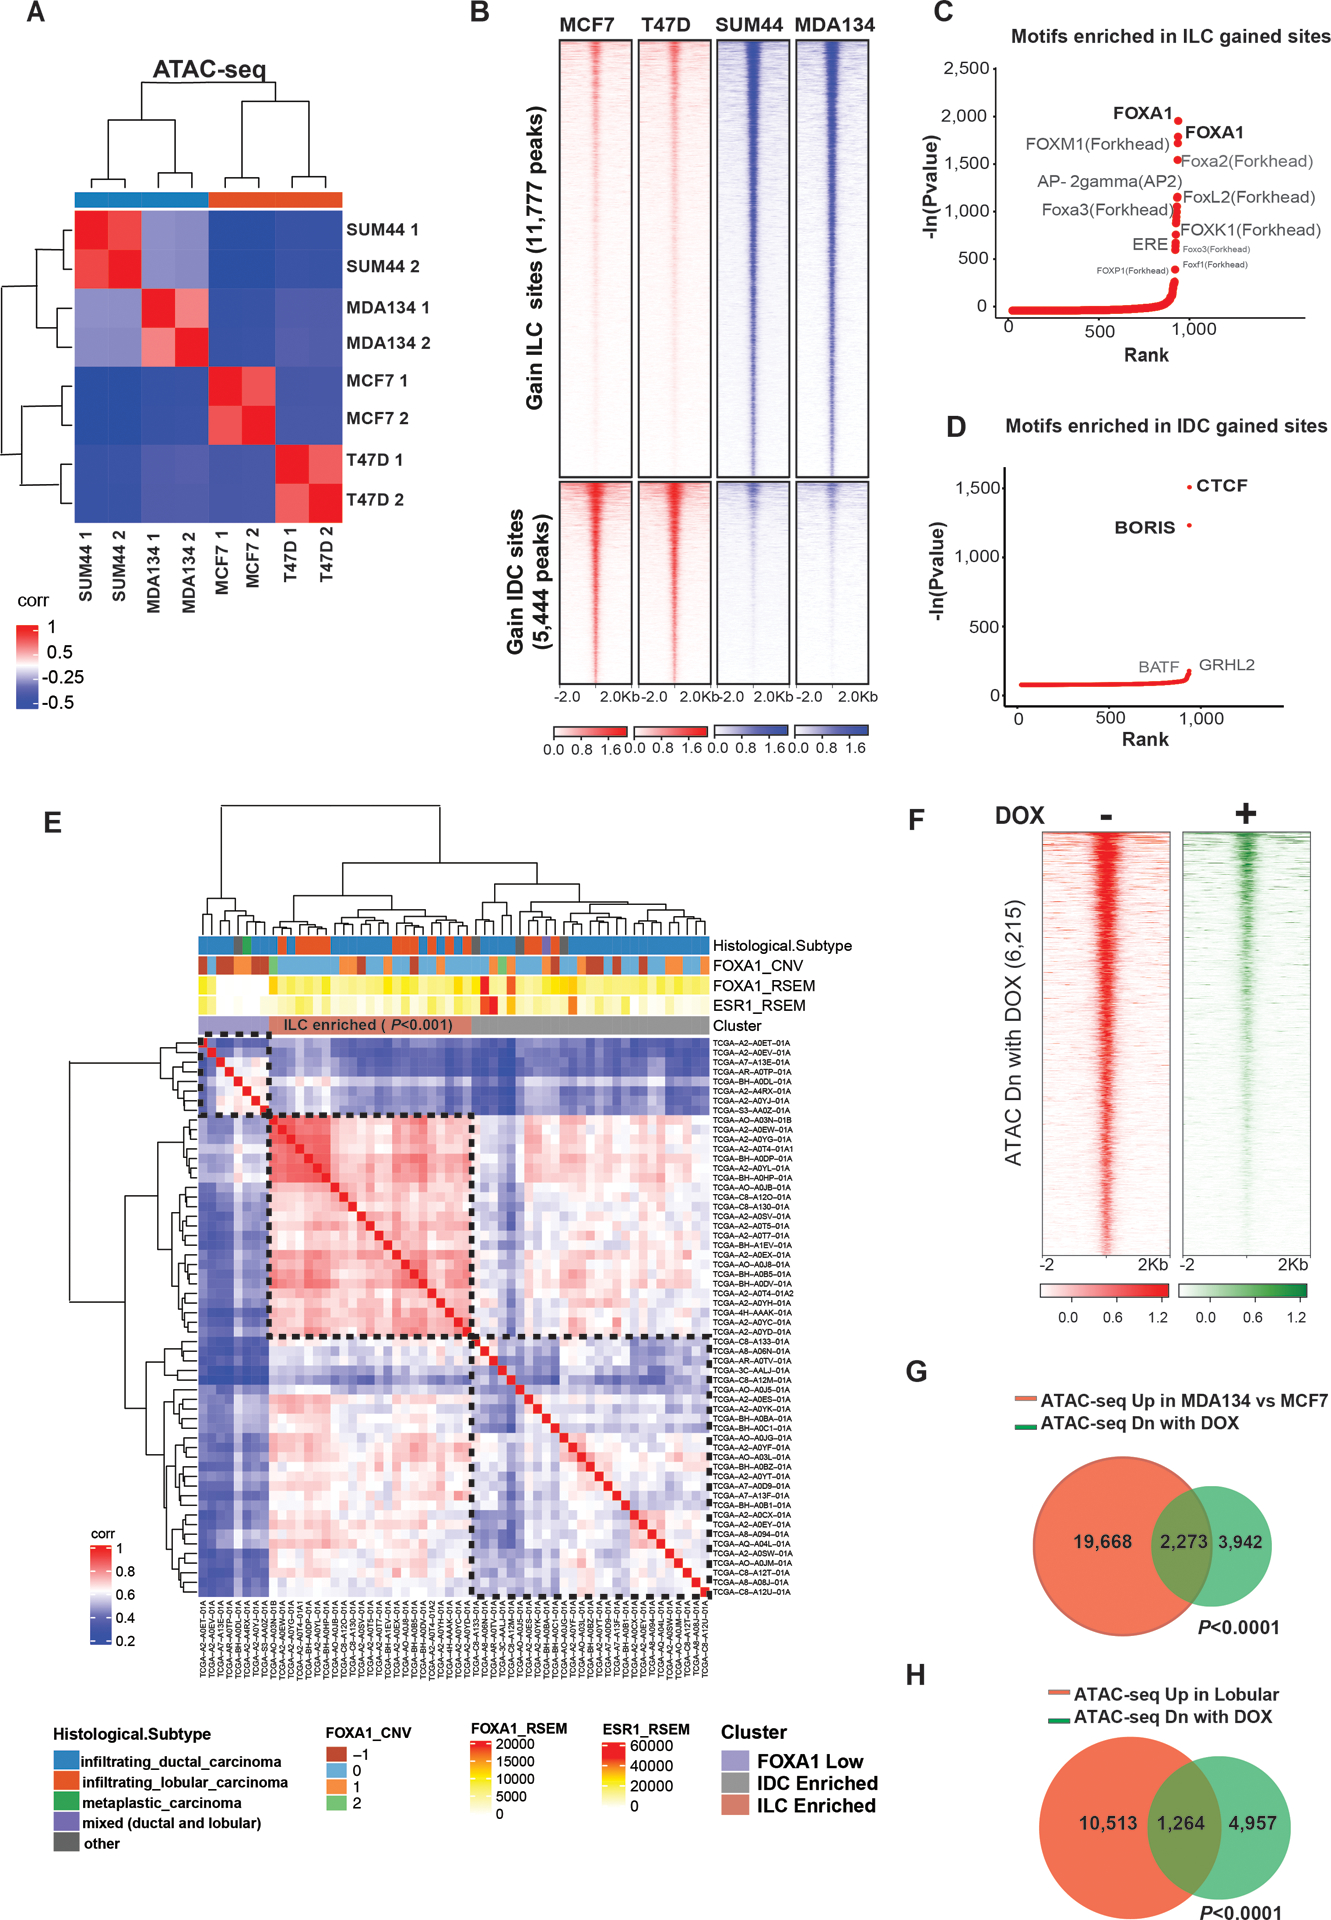
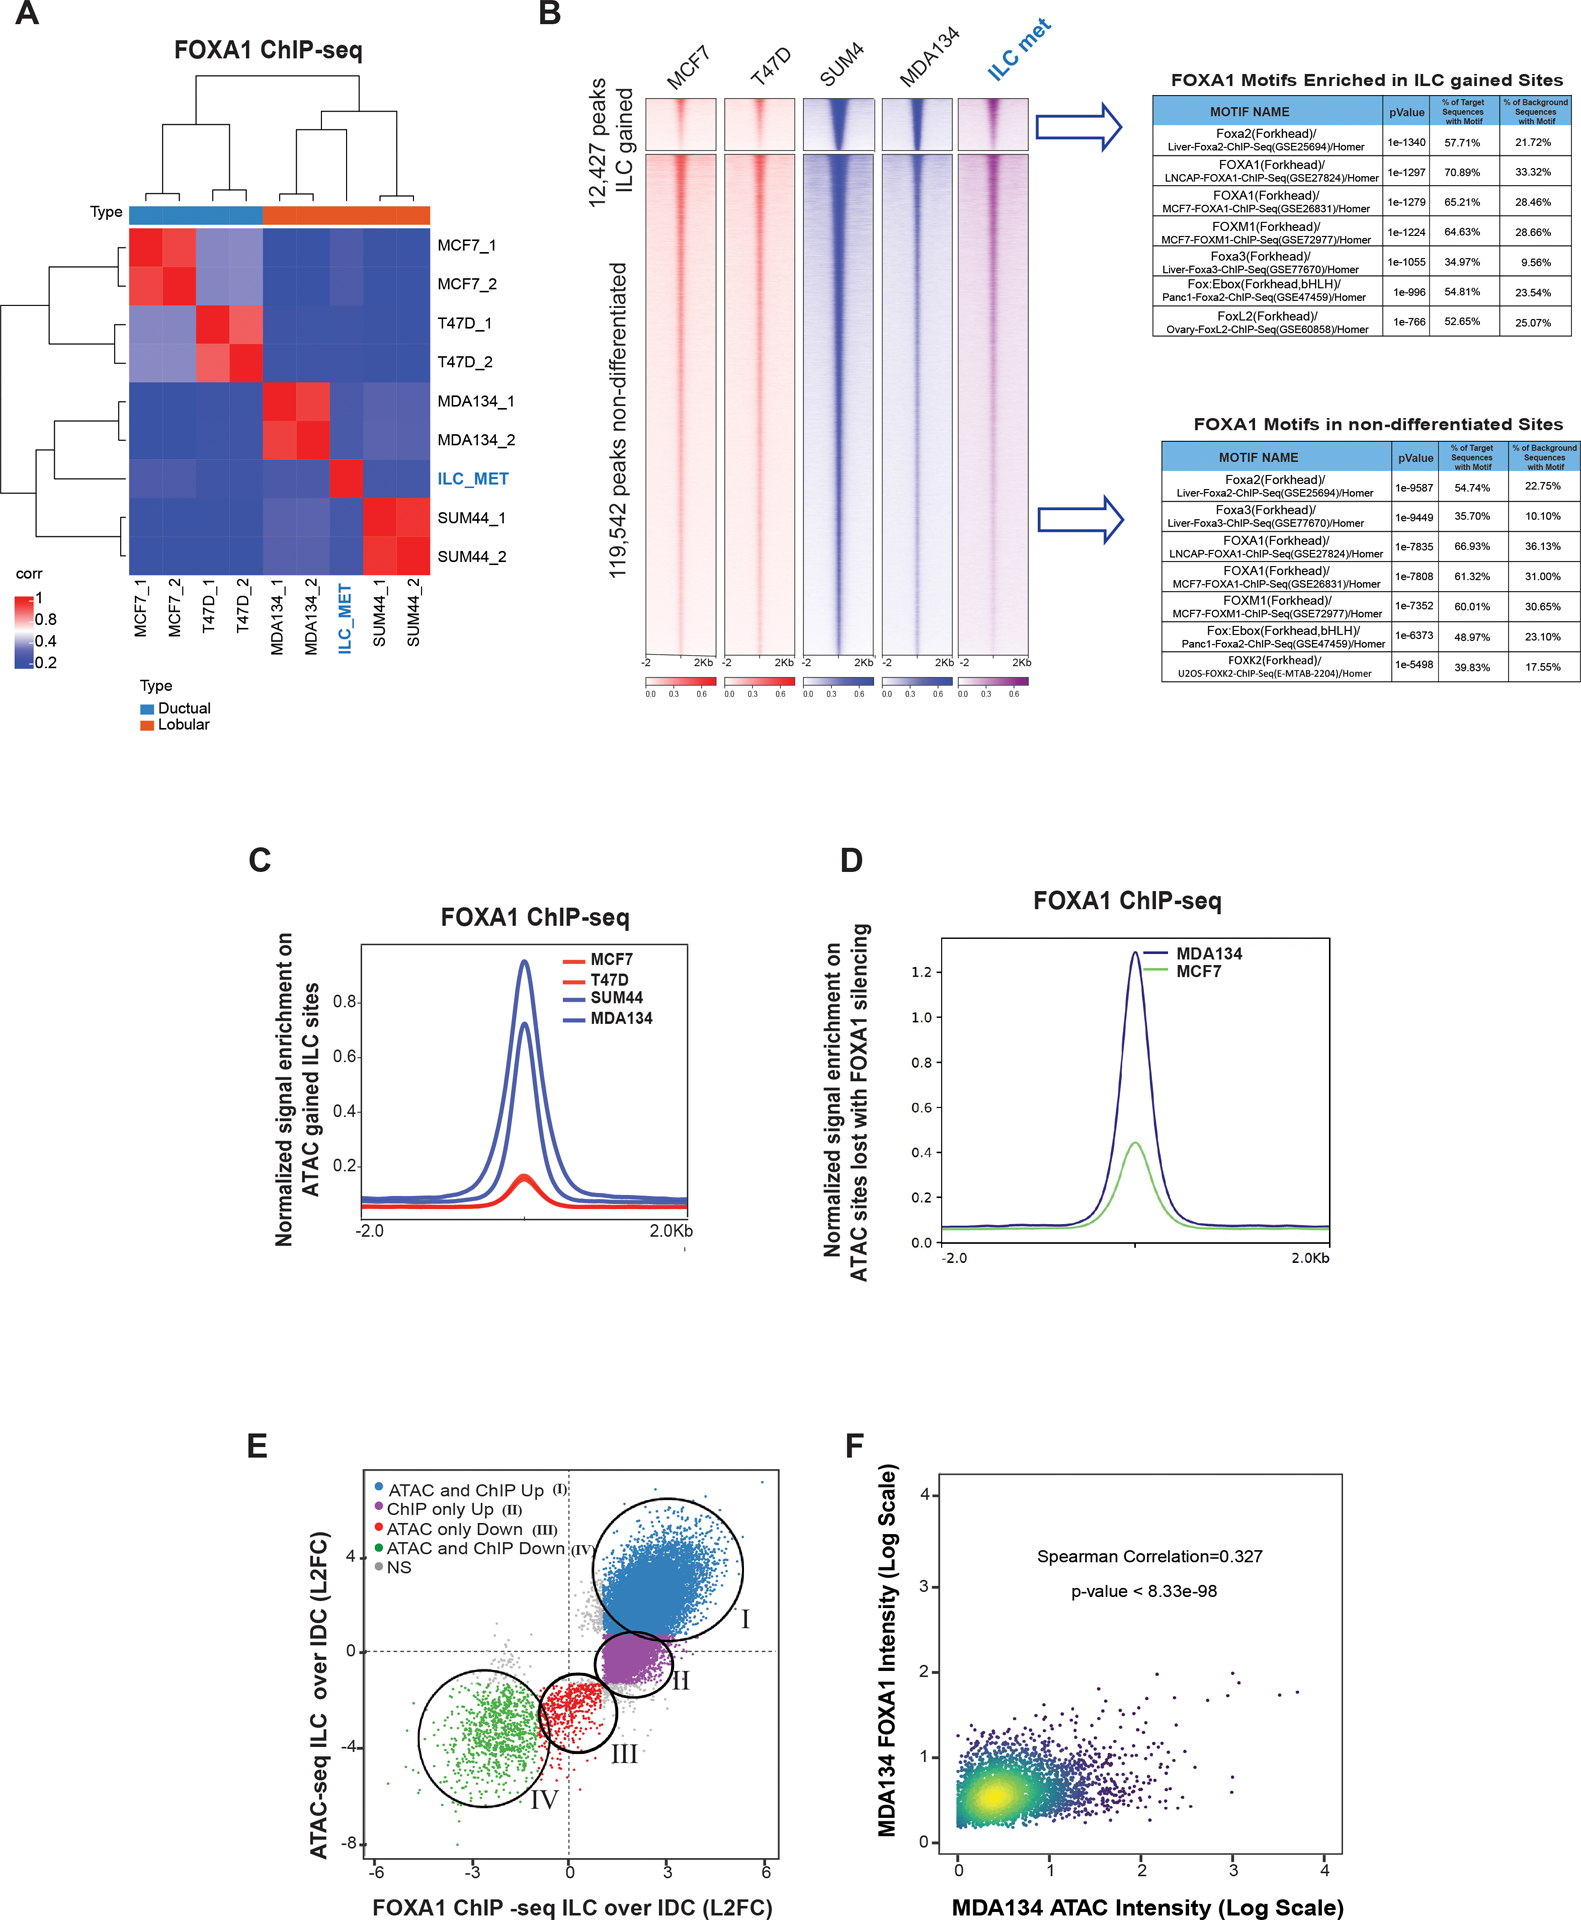
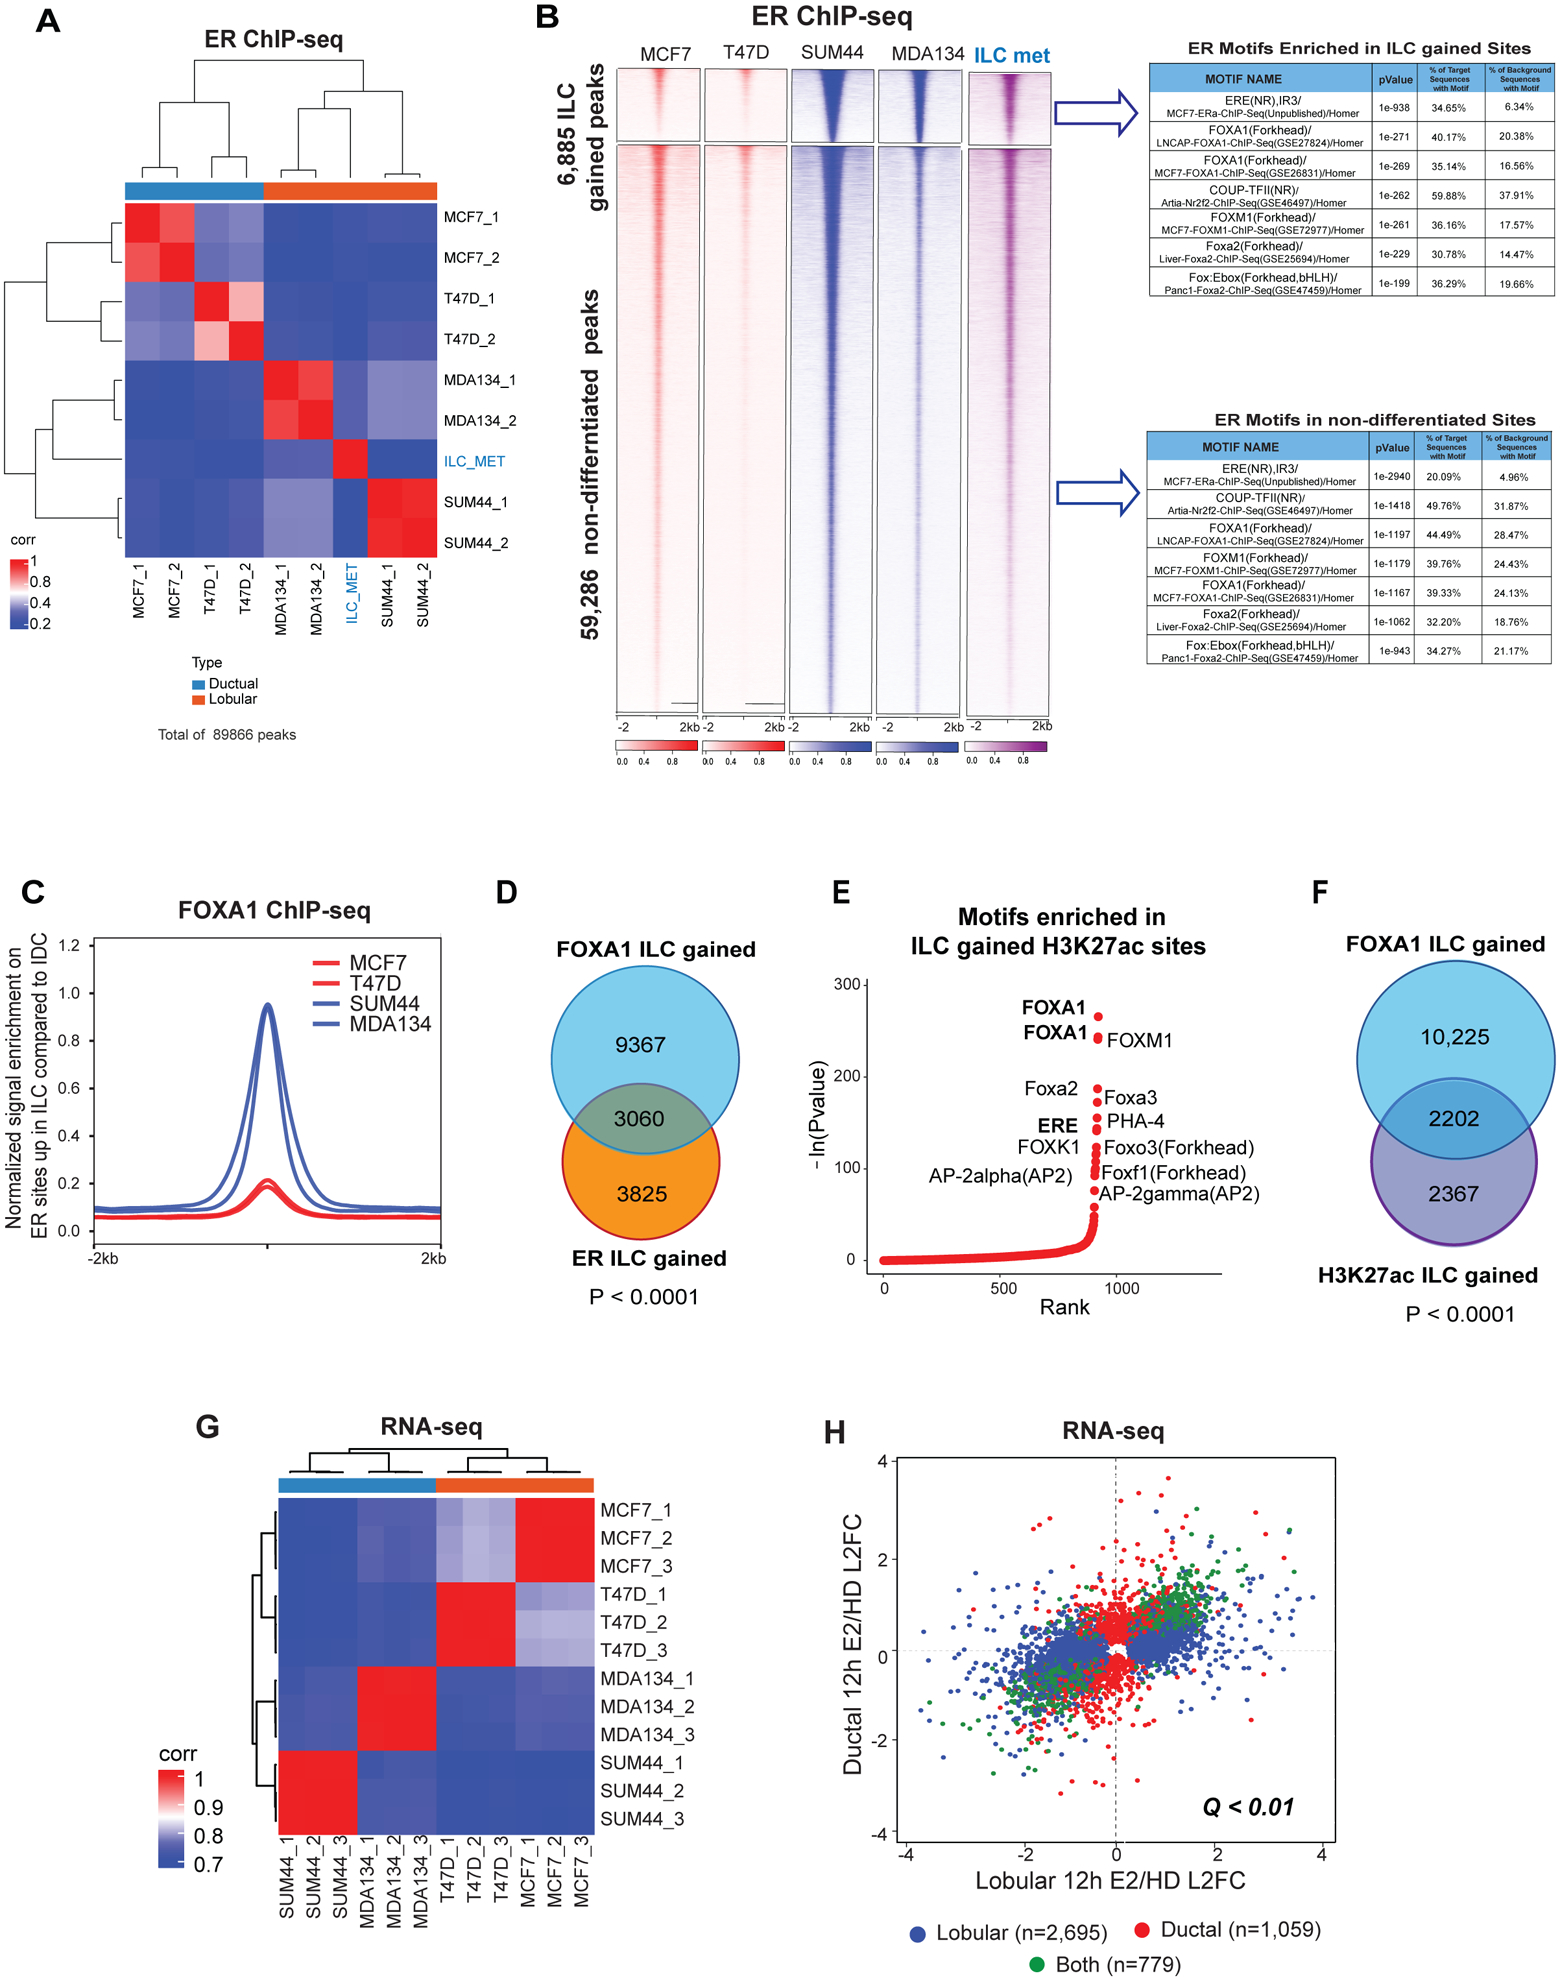
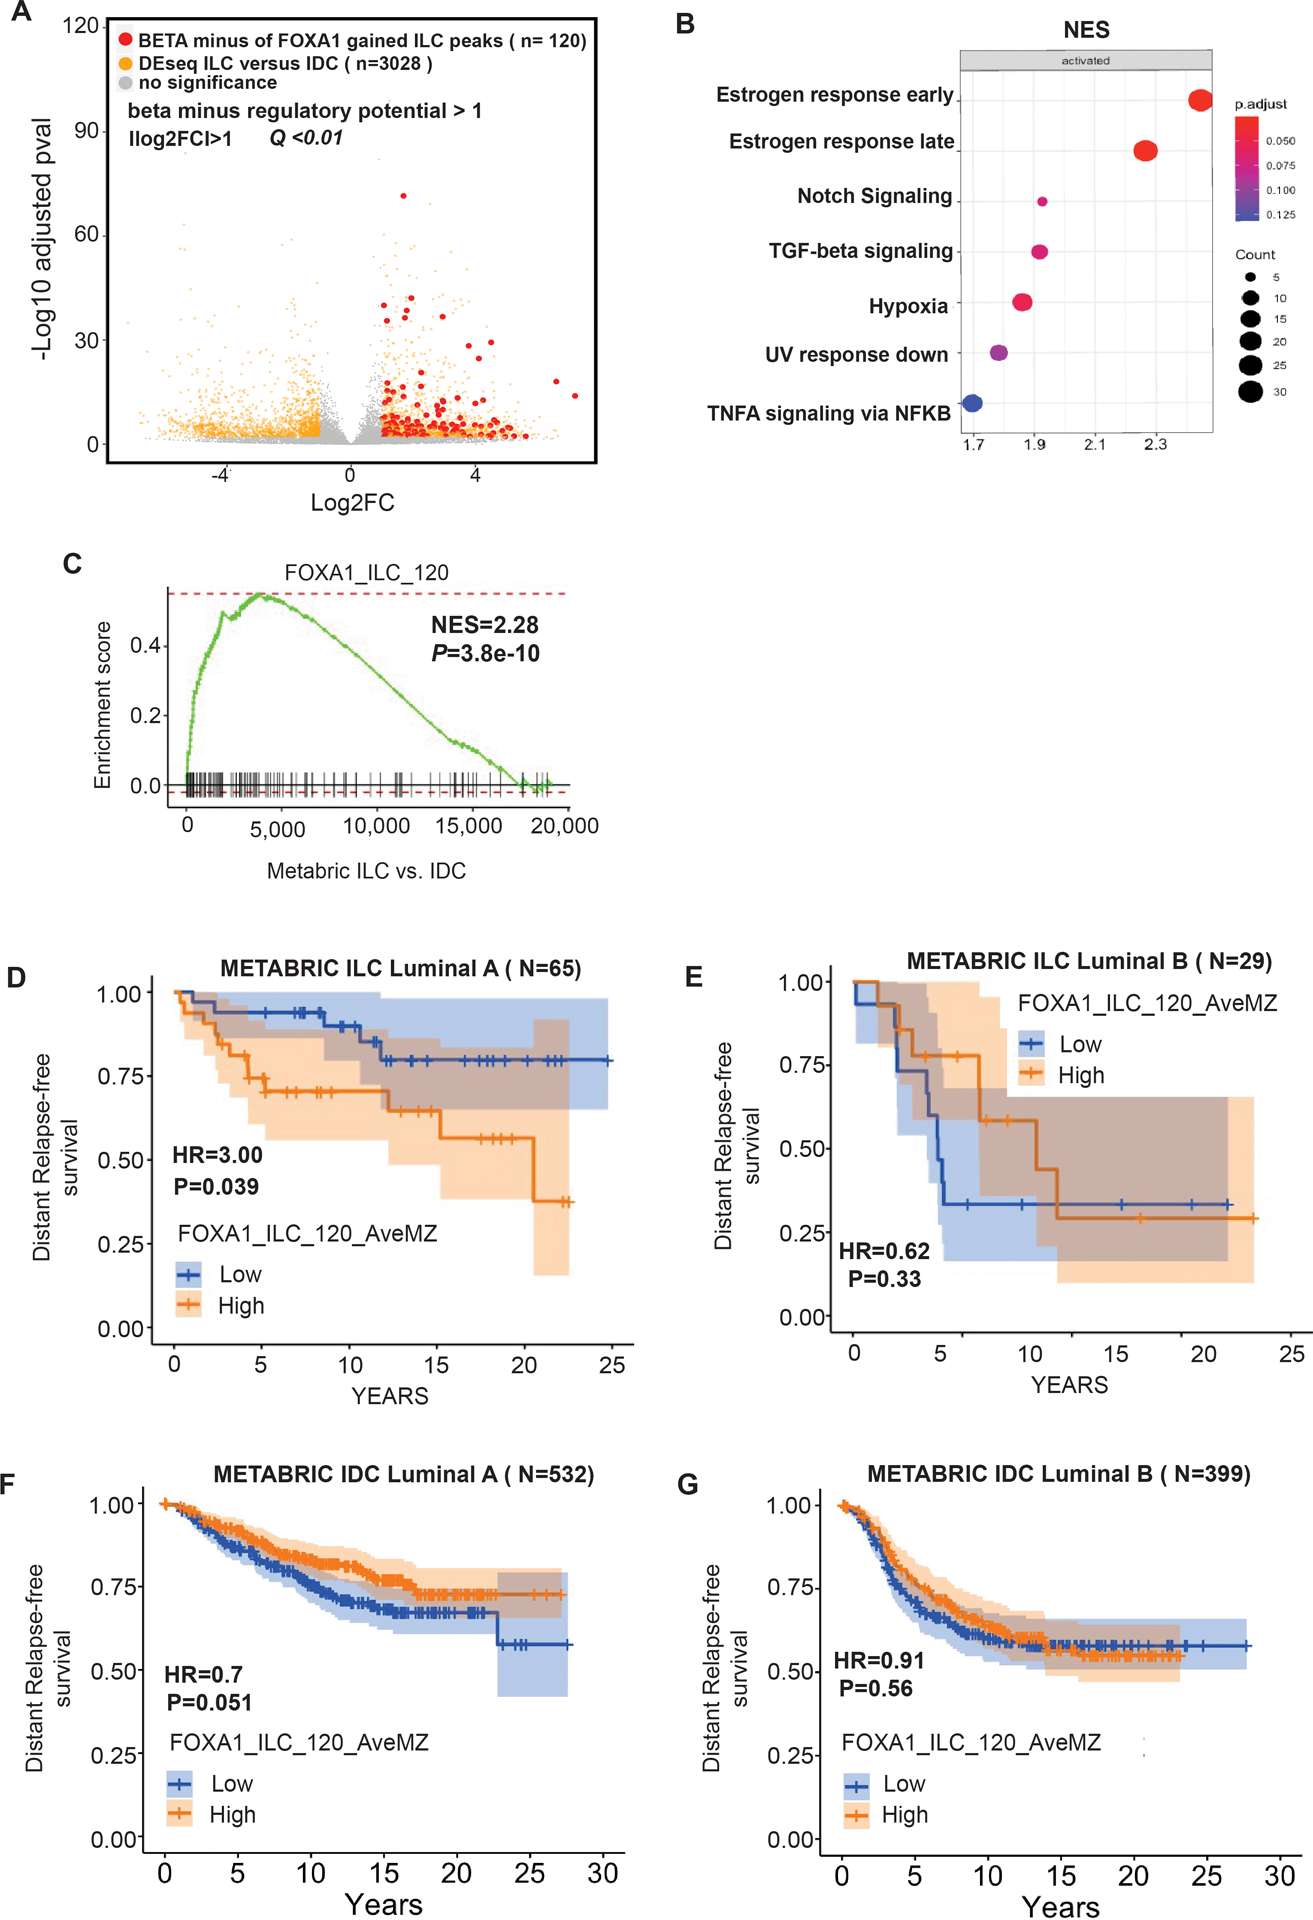
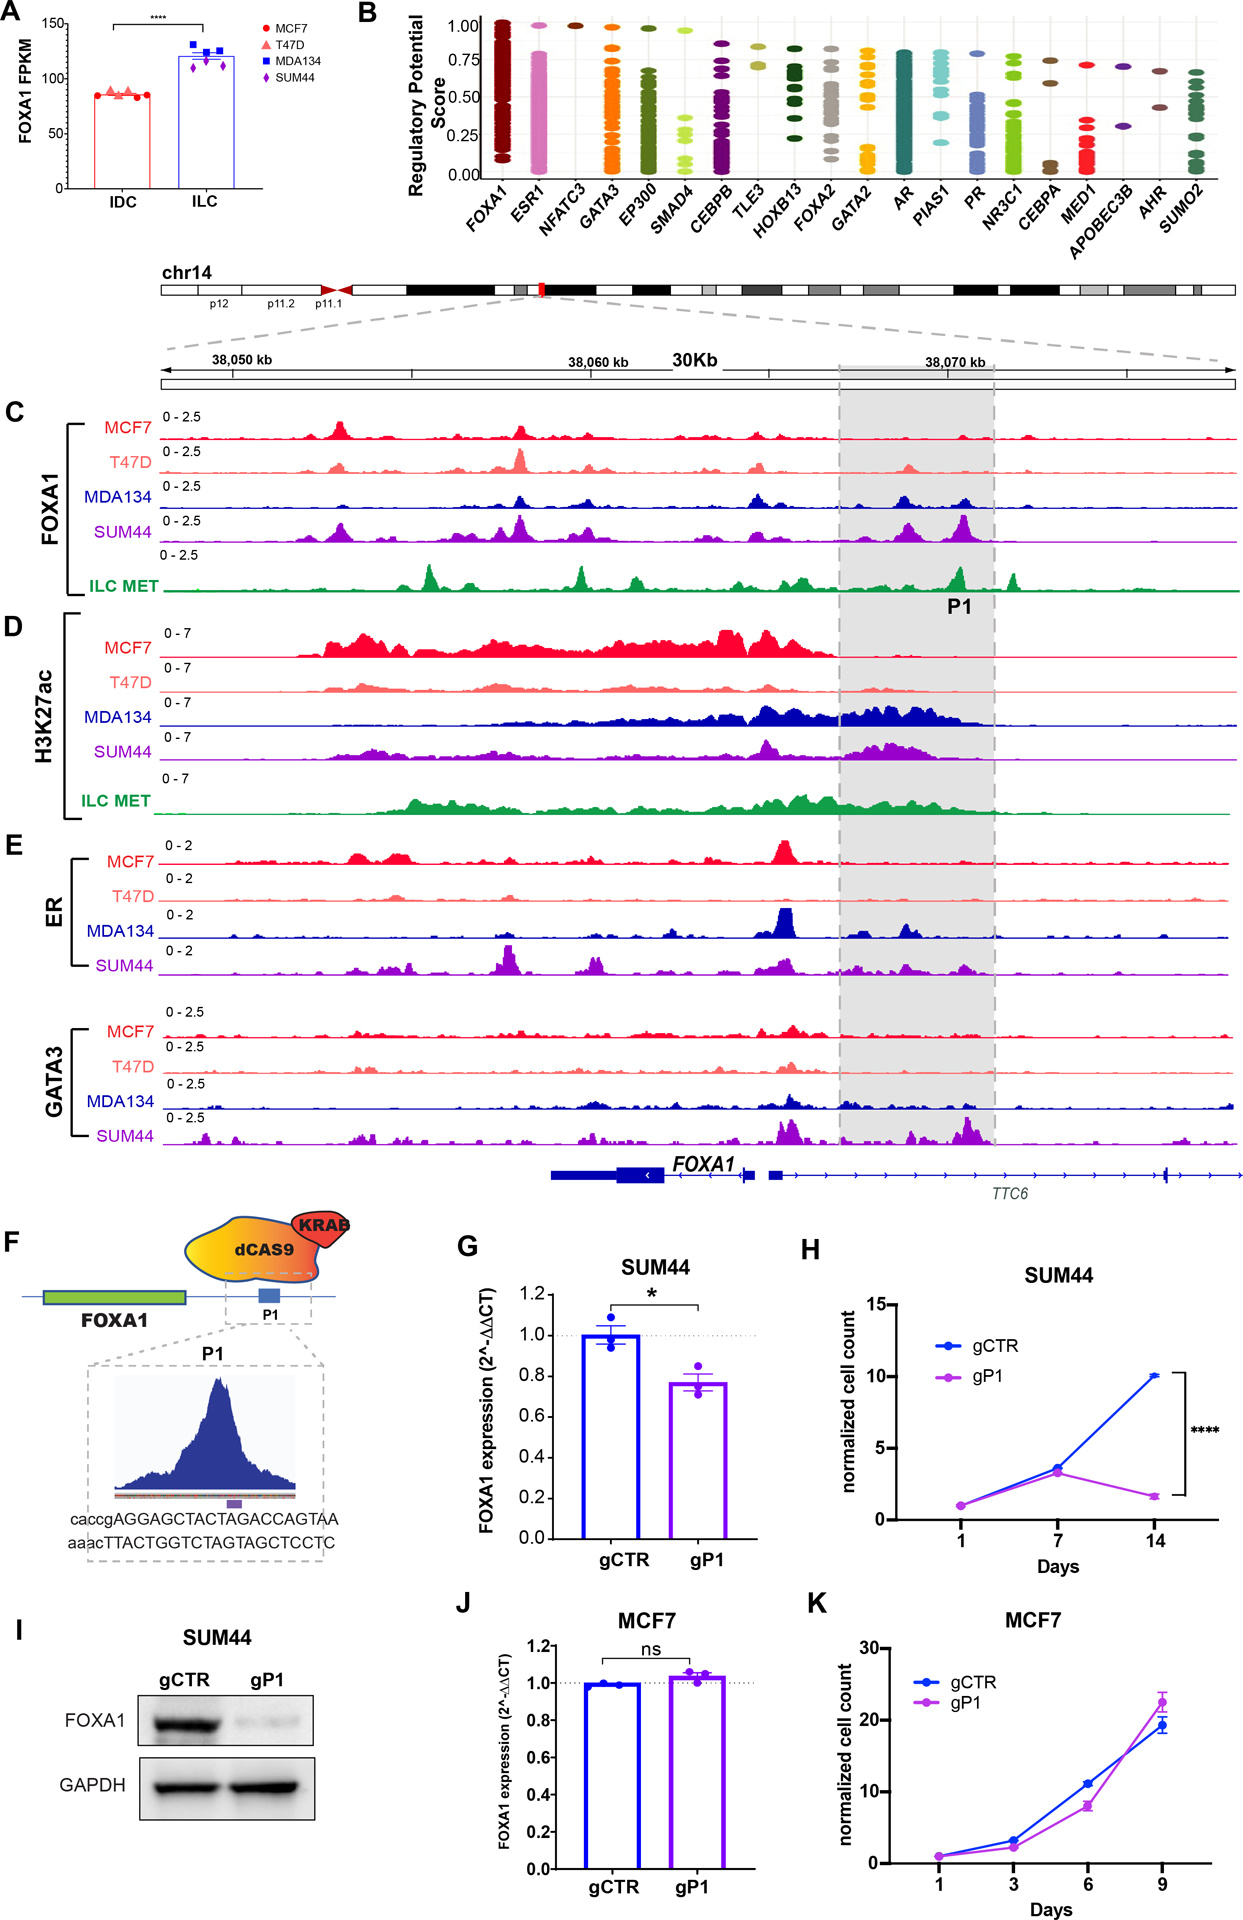
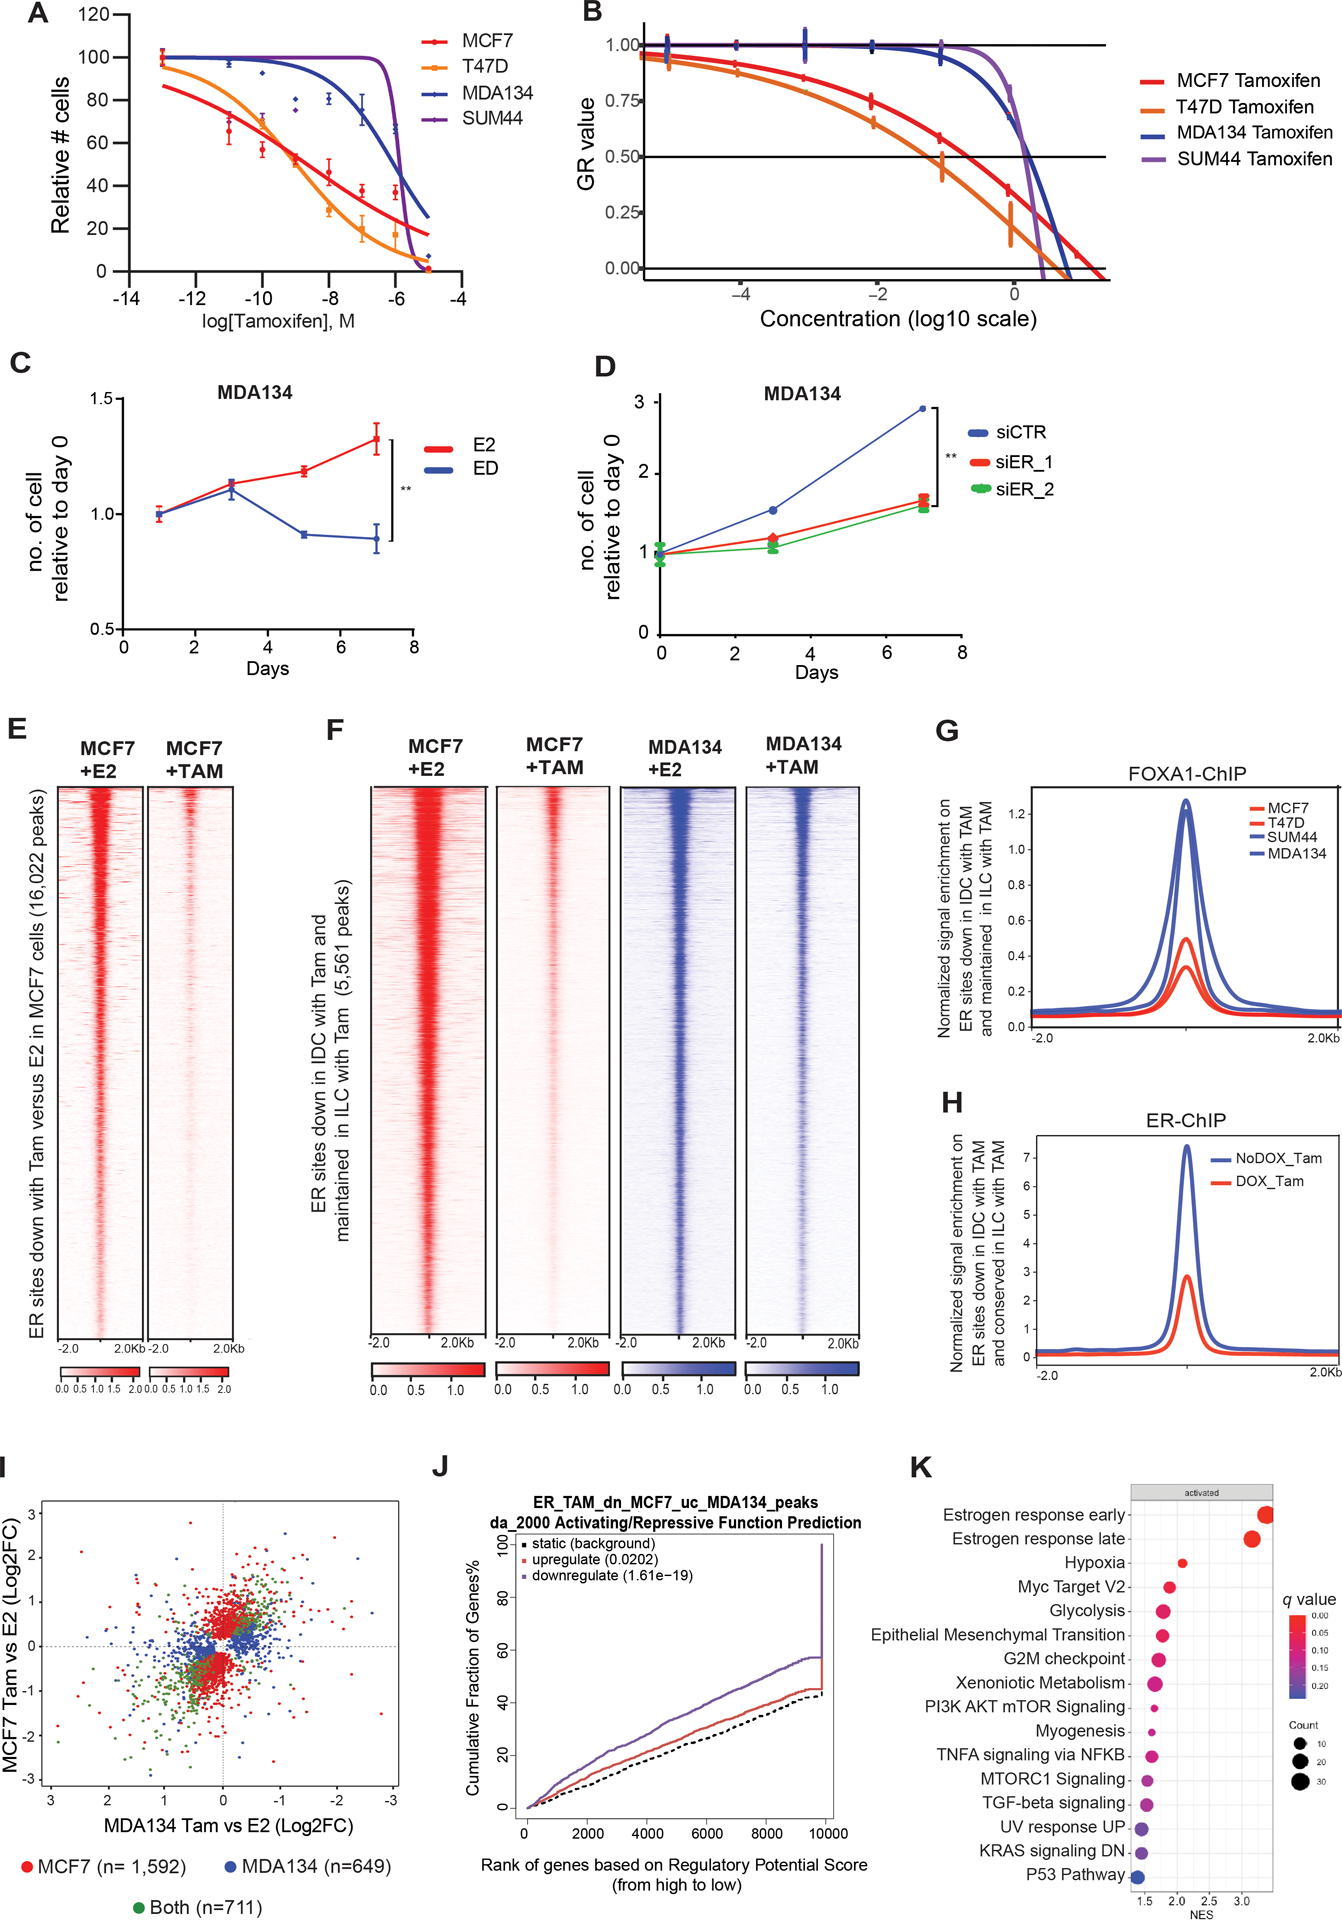
Most invasive lobular breast cancers (ILC) are of the luminal A subtype and are strongly hormone receptor-positive. Yet, ILC is relatively resistant to tamoxifen and associated with inferior long-term outcomes compared with invasive ductal cancers (IDC). In this study, we sought to gain mechanistic insights into these clinical findings that are not explained by the genetic landscape of ILC and to identify strategies to improve patient outcomes. A comprehensive analysis of the epigenome of ILC in preclinical models and clinical samples showed that, compared with IDC, ILC harbored a distinct chromatin state linked to gained recruitment of FOXA1, a lineage-defining pioneer transcription factor. This resulted in an ILC-unique FOXA1-estrogen receptor (ER) axis that promoted the transcription of genes associated with tumor progression and poor outcomes. The ILC-unique FOXA1-ER axis led to retained ER chromatin binding after tamoxifen treatment, which facilitated tamoxifen resistance while remaining strongly dependent on ER signaling. Mechanistically, gained FOXA1 binding was associated with the autoinduction of FOXA1 in ILC through an ILC-unique FOXA1 binding site. Targeted silencing of this regulatory site resulted in the disruption of the feed-forward loop and growth inhibition in ILC. In summary, ILC is characterized by a unique chromatin state and FOXA1-ER axis that is associated with tumor progression, offering a novel mechanism of tamoxifen resistance. These results underscore the importance of conducting clinical trials dedicated to patients with ILC in order to optimize treatments in this breast cancer subtype.

Significance: A unique FOXA1-ER axis in invasive lobular breast cancer promotes disease progression and tamoxifen resistance, highlighting a potential therapeutic avenue for clinical investigations dedicated to this disease. See related commentary by Blawski and Toska, p. 3668.


Figures

Figure 1.
Figure 1.. ILC has a unique chromatin cell state
(A) Sample to sample correlation of chromatin accessibility based on transposase-accessible chromatin followed by sequencing (ATAC-seq) by the Euclidean distance between rows/columns and Ward’s method of invasive lobular cancer (ILC) cells (MDAMB134 (MDA134) and SUM44) and invasive ductal cells (IDC) cells (MCF7 and T47D) cells after 10nM β-estradiol (E2) stimulation (cells were grown in hormone deprived (HD) conditions for 3 days followed by 45-minute treatment with 10nM E2). Shown in the plot are results of replicates. (B) Tornado plots of chromatin accessible sites gained in ILC cells (11,777 peaks) in blue and gained in the IDC cells (5,444 peaks) in red (Log 2FC >1 or <−1, Q<0.01). Chromatin accessible sites are shown in a horizontal window of ±2 kb from the peak center. (C-D) Ranking of motifs enriched in the ILC (C) and IDC (D) gained accessible sites based on p-value. (E) Sample to sample correlation heatmap of open chromatin sites in TCGA ER+ BC tumors applying only the chromatin accessible sites gained in the ILC cell line models (11,777 peaks). Samples are clustered by the Euclidean distance between rows/columns and Ward’s method. Samples cluster to three groups including an ILC enriched group (Fisher’s exact test). (F) Tornado plots of chromatin accessible sites lost when FOXA1 is downregulated by a doxycycline (DOX)-inducible shRNA after 3 days of DOX in presence of HD and 45min 10nM E2. (G-H) Venn diagrams of chromatin accessible sites upregulated in MDA134 in comparison to MCF7 (in red) (G) or upregulated in lobular cells in comparison to ductal cells (in red) (H) and the chromatin accessible sites lost by downregulation of FOXA1 by shRNA (in green).
Figure 2.
Figure 2.. FOXA1 Reprogramming in ILC is linked to the ILC unique chromatin state
(A) Sample to sample correlation (Euclidean distance between rows/columns and Ward’s method) of FOXA1 binding sites correlation plots between all four cell lines in replicates (MCF7, T47D, MDA134 (MDAMB134) and SUM44) and the primary ILC cells isolated from a malignant peritoneal effusion from a patient with ER positive (ER+) metastatic ILC (ILC met). (B) Tornado plots of FOXA1 binding sites (12,427 sites) gained in ILC (MDA134 and SUM44) compared to IDC cells (MCF7 and T47D) and the union of the non-differentiated sites (Log 2FC >1 or <−1, Q<0.01). Table of the top motifs enriched in the FOXA1 binding sites gained in ILC versus IDC cells (Top) and FOXA1 binding sites non-differentiated between (Bottom) comparing the ILC and IDC sites are reported. (C) Quantitative normalized signal of FOXA1 binding based on FOXA1 ChIP-seq in the ILC gained chromatin gained accessible sites based on the ATAC-seq analysis. (D) Quantitative normalized signal of FOXA1 binding based on FOXA1 ChIP-seq in the chromatin accessible sites lost in MDA134 after FOXA1 silencing based on the ATAC-seq analysis. (E) Comparison of log2FC between ILC (MDA134 and SUM44) and IDC (MCF7 and T47D), FOXA1 binding sites (FOXA1 ChIP-seq, x-axis) versus the log2FC comparing chromatin accessibility (ATAC-seq, y-axis) between ILC (MDA134 and SUM44) and IDC (MCF7 and T47D). (F) Intensity of binding in the intersecting sites of ILC gained FOXA1 binding and ATAC-seq in MDA134 versus MCF7 cells. Spearman correlation and p-value are reported.
Figure 3.
Figure 3.. The ER cistrome in ILC cell lines models
(A) ER ChIP-seq sample to sample correlation plot. IDC (MCF7 and T47D), ILC (MDA134 and SUM44) and primary ILC metastatic cells isolated from malignant peritoneal effusion from a patient with ER+ metastatic ILC (ILC MET) samples are clustered by the Euclidean distance between rows/columns and Ward’s method. (B) Tornado plots of ER binding sites gained in ILC cells compared to IDC cells (6,885 peaks) and the union of the non-differentiated sites (59,286) (Log 2FC >1 or <−1, Q<0.01). ER binding sites is shown in a horizontal window of ±2Kb from the peak center. Table of the top motifs enriched in the ER binding sites gained in ILC versus IDC cells (Top) and ER binding sites non-differentiated between (Bottom) comparing the ILC and IDC sites are reported. (C) Quantitative normalized signal of FOXA1 binding sites (FOXA1 ChIP-seq) on sites of ILC gained ER binding based on ER ChIP-seq in ILC cells (SUM44 and MDA134) and IDC cells (MCF7 and T47D). (D) Venn diagram of FOXA1 ILC gained peaks (12,427) in blue, and the ER ILC gained peaks (6,885) in orange, showing 3,060 peaks overlapping (sharing at least 1 bp) between the two factors. (E) Ranking of the motifs enriched in H3K27ac binding sites gained in ILC cells (SUM44 and MDA134) versus IDC cells (MCF7 and T47D) based on p-values of enrichment analysis. (F) Overlap between FOXA1 ILC gained peaks (12,427) compared to IDC in blue, and the H3K27ac ILC gained peaks (4,569) compared to IDC in purple. (G) RNA-seq sample to sample correlation based on Euclidean distance between rows/columns and Ward’s method of IDC and ILC cells after hormone deprived (HD) and 12 hours of β-estradiol treatment. (H) Comparison of differentially expressed genes between hormone deprived (HD) and 12 hours of β-estradiol (E2) treatment in ILC (SUM44 and MDA134) and IDC (MCF7 and T47D) cells. Genes with differential expression of Q<0.01 are assigned to each category by the color scheme.
Figure 4.
Figure 4.. FOXA1 drives the ILC unique transcriptome
(A) Volcano plot depicting differential (DEseq2) expression comparing RNA-seq of ILC cells (MDA134 and SUM44) versus IDC cells (MCF7 and T47D) after β-estradiol stimulation (E2). Shown in yellow are the genes with significant differential expression ([log2FC] >1, Q<0.01. DESeq2). Red dots represent the genes with significant differential expression ([log2FC] >1, Q<0.01. DESeq2) and are regulated by FOXA1 ILC gained binding sites based on Binding and Expression Target (BETA) minus analysis. (B) Hallmark pathways enriched in the genes regulated by the ILC gained FOXA1 sites based on BETA basic. The normalized enrichment score (NES) is represented in the X-axis, the number of genes in the dataset is the count number represented by the circle size, q-value <0.25. (C) Enrichment plot from Gene Set Enrichment Analysis (GSEA) showing enrichment of the FOXA1_ILC_120 gene set derived from the ILC gained binding sites in ILC versus IDC estrogen receptor positive breast cancers in the METABRIC cohort. (D) Distant free survival in patients with Luminal A molecular subtype ILC from the METABRIC cohort comparing patients with high versus low expression of the FOXA1_ILC_120 gene set. (E) Distant free survival in patients with Luminal B molecular subtype type ILC from the METABRIC cohort comparing patients with high versus low expression of the FOXA1_ILC_120 gene set. (F) Distant free survival in patients with Luminal A molecular subtype IDC from the METABRIC cohort comparing patients with high versus low expression of the FOXA1_ILC_120 gene set. (G) Distant free survival in patients with Luminal B molecular subtype IDC from the METABRIC cohort comparing patients with high versus low expression of the FOXA1_ILC_120 gene set.
Figure 5.
Figure 5.. FOXA1 auto-induction in ILC through a unique super-enhancer and FOXA1 binding site
(A) RNA expression (FPKM values) of FOXA1 in IDC (MCF7 and T47D) and ILC (MDA134 and SUM44) cells. ****, t-test p-value <0.00001 (B) Regulatory potential of the transcription factors that regulate FOXA1 based on the CistromeDB toolkit (dbtoolkit.cistrome.org). (C-D) ChIP-seq tracks showing FOXA1 (C) and H3K27acetylation (D) in the IDC (MCF7 and T47D (red and orange tracks) and ILC (MDA134 and SUM44) (blue and purple tracks) cell lines and primary cells from ILC metastasic peritoneal effusion (ILC met, green tracks). (E) ER and GATA3 ChIP-seq tracks for the IDC (MCF7 and T47D) (red and orange tracks) and ILC (MDA134 and SUM44) (blue and purple tracks) cell lines. (F) Cartoon of CRISPRi action at the P1 site. Enlargement showing the gRNA used to target the FOXA1 binding region. (G) mRNA levels of FOXA1 in SUM44 lobular cells by reverse transcription quantitative PCR (RT qPCR) in presence of the gCTR and gP1 at day 7 after transduction. The mRNA expression was normalized to the GAPDH housekeeping gene, and expression levels are presented as 2^–ΔΔCT compared with control. (H) Cell proliferation assay after 14 days in SUM44 cells of control cells and after suppression of the FOXA1 P1 (gP1) using CRISPRi. Error bars represent ±SEM, n=3. (I) Western blot of whole cell lysates for FOXA1 in SUM44 cells in presence of the control guide (gCTR) and the guide RNA targeting P1 (gP1) at day 9 after transduction. (J) FOXA1 mRNA levels of MCF7 in presence of the gCTR and the gP1. (K) Cell proliferation assay in MCF7 cells in presence of the gCTR and the gP1. *p < 0.05; ****p < 0.0001; ns: not significant.
Figure 6.
Figure 6.. The mechanism of Tamoxifen Resistance in ILC
(A-B) Dose response curves of 4-hydroxytamoxifen (tamoxifen) treatment in ductal and lobular cell lines. (A) Curves normalized to vehicle control. IC50 values is in the range of 1uM for both ILC models (MDA134 and SUM44), compared to an IC50 of 1nM and 2.2nM for T47D and MCF7, respectively. (B) GR50s values are 240nM for MCF7 60nM for T47D, 1920nM for MDA134 and 1680μM for SUM44. (C) Cell proliferation curves of MDA134 cells followed for seven days without (ED) or with estradiol (E2, 10nM). Error bars represent ±SEM, n= 3. **, p-value <0.01. (D) Cell proliferation studies of MDA134 cells in full medium conditions including cells transfected with an siControl (siCTR) and cells with silencing of ER (siER_1 and siER_2). Error bars represent ±SEM, n = 3. ****, p-value <0.0001. (E) Tornado plots of ER binding sites lost in MCF7 treated with 4-hydroxytamoxifen (TAM) compared to β-estradiol (E2) treatment. (F) Tornado plots of ER binding sites lost in MCF7 treated with TAM compared to E2 treatment and unchanged in the MDA134 cells in E2 and TAM treated conditions (Log 2FC >1 or <−1, q-value<0.01). (G) Quantitative normalized signal of FOXA1 ChIP-seq binding at ER binding sites lost in MCF7 cells with TAM treatment but unchanged in MDA134 cells. (H) Quantitative normalized signal of ER ChIP-seq binding on ER sites lost in MCF7 cells but retained in MDA134 cells, in MDA134 cells treated with TAM (with and without DOX induction of FOXA1 silencing (shFOXA1). (I) Comparison of differentially expressed genes between β-estradiol (E2) and 4-hydroxytamoxifen (Tam) in MCF7 and MDA134. Genes with FDR <0.05 are assigned to each category by the color scheme. There were 711 shared differentially expressed genes, 1,592 genes differentially expressed in MCF7 cells only, and 649 genes differentially expressed exclusively in MDA134. (J) Binding and Expression Target Analysis (BETA) basic plot of the activating and repressive function of the ER binding sites lost in MCF7 but conserved in MDA134 after tamoxifen treatment. The red line represents the genes upregulated and the purple line the genes downregulated with 4hydroxytamoxifen versus β-estradiol treatment in MCF7 cells. The black dashed line indicates the non-differentially expressed genes as background. The p-value is based on the Kolmogorov-Smirnov test. (K) Hallmark pathways enriched in the genes determined to be downregulated by 4-hydroxytamoxifen compared to E2 treatment and regulated by the ER binding sites lost in MCF7 cells after tamoxifen treatment but unchanged in MDA134. The normalized enrichment score (NES) is represented in the X-axis, the number of genes in the dataset is the count number represented by the circle size, q-value <0.25.

Comment in

References

    1. Berx G, Cleton-Jansen AM, Nollet F, de Leeuw WJ, van de Vijver M, Cornelisse C, et al. E-cadherin is a tumour/invasion suppressor gene mutated in human lobular breast cancers. EMBO J 1995;14(24):6107–15. - PMC - PubMed
    1. Derksen PW, Liu X, Saridin F, van der Gulden H, Zevenhoven J, Evers B, et al. Somatic inactivation of E-cadherin and p53 in mice leads to metastatic lobular mammary carcinoma through induction of anoikis resistance and angiogenesis. Cancer Cell 2006;10(5):437–49 doi 10.1016/j.ccr.2006.09.013. - DOI - PubMed
    1. McCart Reed AE, Kutasovic JR, Lakhani SR, Simpson PT. Invasive lobular carcinoma of the breast: morphology, biomarkers and ‘omics. Breast Cancer Res 2015;17:12 doi 10.1186/s13058-015-0519-x. - DOI - PMC - PubMed
    1. Arpino G, Bardou VJ, Clark GM, Elledge RM. Infiltrating lobular carcinoma of the breast: tumor characteristics and clinical outcome. Breast Cancer Res 2004;6(3):R149–56 doi 10.1186/bcr767. - DOI - PMC - PubMed
    1. Pestalozzi BC, Zahrieh D, Mallon E, Gusterson BA, Price KN, Gelber RD, et al. Distinct clinical and prognostic features of infiltrating lobular carcinoma of the breast: combined results of 15 International Breast Cancer Study Group clinical trials. J Clin Oncol 2008;26(18):3006–14 doi 10.1200/JCO.2007.14.9336. - DOI - PubMed

Publication types