. 2023 Jan;91(1):47-61.
doi: 10.1002/prot.26409. Epub 2022 Aug 19.

Predicting molecular properties of α-synuclein using force fields for intrinsically disordered proteins

Affiliations

Predicting molecular properties of α-synuclein using force fields for intrinsically disordered proteins

Kasper B Pedersen et al. Proteins. 2023 Jan.

Abstract

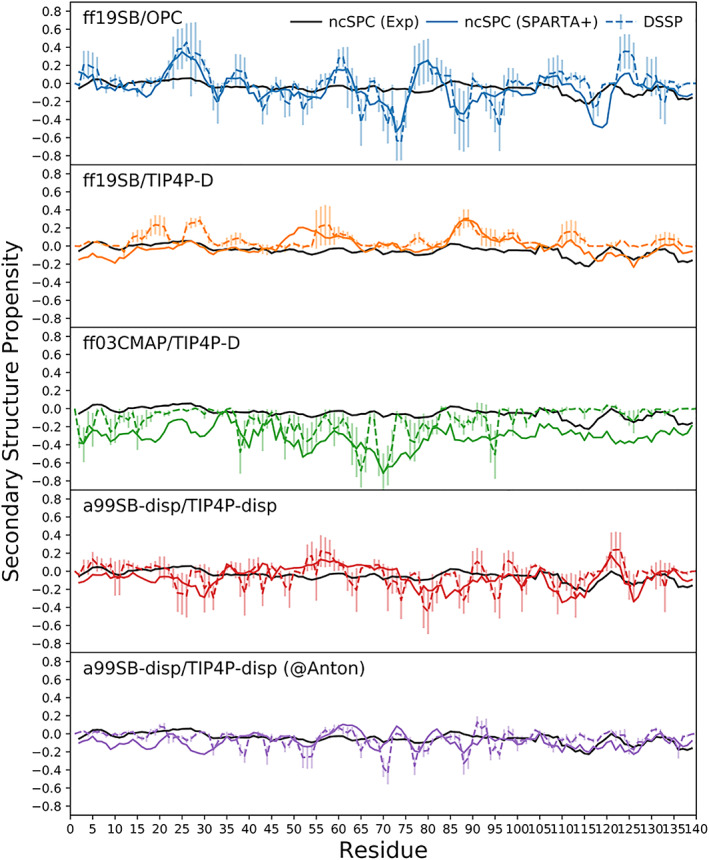
Independent force field validation is an essential practice to keep track of developments and for performing meaningful Molecular Dynamics simulations. In this work, atomistic force fields for intrinsically disordered proteins (IDP) are tested by simulating the archetypical IDP α-synuclein in solution for 2.5 μs. Four combinations of protein and water force fields were tested: ff19SB/OPC, ff19SB/TIP4P-D, ff03CMAP/TIP4P-D, and a99SB-disp/TIP4P-disp, with four independent repeat simulations for each combination. We compare our simulations to the results of a 73 μs simulation using the a99SB-disp/TIP4P-disp combination, provided by D. E. Shaw Research. From the trajectories, we predict a range of experimental observations of α-synuclein and compare them to literature data. This includes protein radius of gyration and hydration, intramolecular distances, NMR chemical shifts, and 3 J-couplings. Both ff19SB/TIP4P-D and a99SB-disp/TIP4P-disp produce extended conformational ensembles of α-synuclein that agree well with experimental radius of gyration and intramolecular distances while a99SB-disp/TIP4P-disp reproduces a balanced α-synuclein secondary structure content. It was found that ff19SB/OPC and ff03CMAP/TIP4P-D produce overly compact conformational ensembles and show discrepancies in the secondary structure content compared to the experimental data.

Keywords: OPC; TIP4P-D; a99SB-disp; ff03CMAP; ff19SB; intrinsically disordered proteins; α-synuclein.


Figures

FIGURE 1
FIGURE 1
(A) The 140‐residue sequence of α‐synuclein can be divided into three regions: The N‐terminal (residues ~1–60) which is slightly positively charged (blue residues) by six imperfect KTKEGV repeats that can facilitate α‐helix formation; the non‐amyloid component (NAC) region (residues ~61–95) which is hydrophobic and constitute the core of aggregates; and the C‐terminal (residues ~96–140) which is highly negatively charged (red residues) and predominantly disordered. Histidine 50 (yellow) has a pKa of 6.78 ± 0.04 and can thus be either positively charged or neutral. Depending on the immediate environment, α‐synuclein adopts diverse secondary structures. (B) In solution, it is disordered. (C) When in contact with micelles, and presumably synaptic vesicles, residues 1–93 fold into a kinked α‐helix (PDB: 2KKW 10 ), and (D) aggregation leads to various fibril states including a Ω‐shaped β‐sheet structure (PDB: 2N0A 14 )
FIGURE 2
FIGURE 2
Radius of gyration for each replica and force field combination (left) with each of the four repeats in a different greyscale. Normalized histograms of radius of gyration (right) during the last 1.5 μs and the full 73 μs. The shaded area indicates the first 1 μs which is discarded when calculating observables. The upper estimate of the WLC model radius of gyration Rg2WLC1/2=33.1Å is shown as a black dotted line on the histogram
FIGURE 3
FIGURE 3
Intramolecular distances between residues as a function of the sequence separation distance between the residues. Black data points are experimental distances between sidechains (ET/FET, black x) or fluorescent labels (FRET (A), black arrow down, FRET (B),, black arrow up) while colored data points are average Cα–Cα distances from the simulations. The dotted line indicates the WLC end‐to‐end distance R2WLC1/2 of a peptide segment with the corresponding sequence separation. Full error bars show the standard deviation while capped error bars show SEM
FIGURE 4
FIGURE 4
Residual secondary structure propensities were calculated using ncSPC inputting experimental chemical shifts (black line) and from simulation using average predicted chemical shifts from SPARTA+ (colored line). 1 corresponds to a fully formed helix while −1 indicates β content., Zero indicates either disorder or an equal amount of helical and β content. Striped colored lines show the DSSP equivalent score described in the method section
FIGURE 5
FIGURE 5
(A) Normalized histograms of backbone φ‐angles collected during the last 1.5 μs in each force field combination and all frames in the case of the 73 μs a99SB‐disp/TIP4P‐disp trajectory (left scale). Frames from each of the four repeats were pooled. The Karplus equation parameterizations by Hu and Bax are superimposed to visualize φ contributions to the prediction of the respective 3J‐couplings (right scale). (B) Backbone ψ‐angles were collected during the last 1.5 μs in each force field combination
FIGURE 6
FIGURE 6
3J‐coupling HNC' prediction of each force field combination. The experimental HNC' couplings of N‐acetylated α‐synuclein are shown with a black dotted line. 3J‐coupling predictions from ff19SB, shown in blue (OPC water) and orange (TIP4P‐D water), are upshifted compared to experimental values. The full figure of 3J‐coupling predictions can be found in Figure S5
FIGURE 7
FIGURE 7
Root‐mean‐squared error (RMSE) between experimental data and corresponding MD predictions (averaged across repeat simulations) of the four tested force field combinations

References

    1. van der Lee R, Buljan M, Lang B, et al. Classification of intrinsically disordered regions and proteins. Chem Rev. 2014;114(13):6589‐6631. - PMC - PubMed
    1. Ward JJ, Sodhi JS, McGuffin LJ, Buxton BF, Jones DT. Prediction and functional analysis of native disorder in proteins from the three kingdoms of life. J Mol Biol. 2004;337(3):635‐645. - PubMed
    1. Oates ME, Romero P, Ishida T, et al. D2P2: database of disordered protein predictions. Nucleic Acids Res. 2012;41(D1):D508‐D516. - PMC - PubMed
    1. Dyson HJ, Wright PE. Intrinsically unstructured proteins and their functions. Nat Rev Mol Cell Biol. 2005;6(3):197‐208. - PubMed
    1. Wright PE, Dyson HJ. Intrinsically disordered proteins in cellular signalling and regulation. Nat Rev Mol Cell Biol. 2015;16(1):18‐29. - PMC - PubMed

Publication types

MeSH terms

Substances

LinkOut - more resources