. 2022 Aug 11;79(9):480.
doi: 10.1007/s00018-022-04495-9.

Systems spatiotemporal dynamics of traumatic brain injury at single-cell resolution reveals humanin as a therapeutic target

Affiliations

Systems spatiotemporal dynamics of traumatic brain injury at single-cell resolution reveals humanin as a therapeutic target

Douglas Arneson et al. Cell Mol Life Sci. .

Abstract

Background: The etiology of mild traumatic brain injury (mTBI) remains elusive due to the tissue and cellular heterogeneity of the affected brain regions that underlie cognitive impairments and subsequent neurological disorders. This complexity is further exacerbated by disrupted circuits within and between cell populations across brain regions and the periphery, which occur at different timescales and in spatial domains.

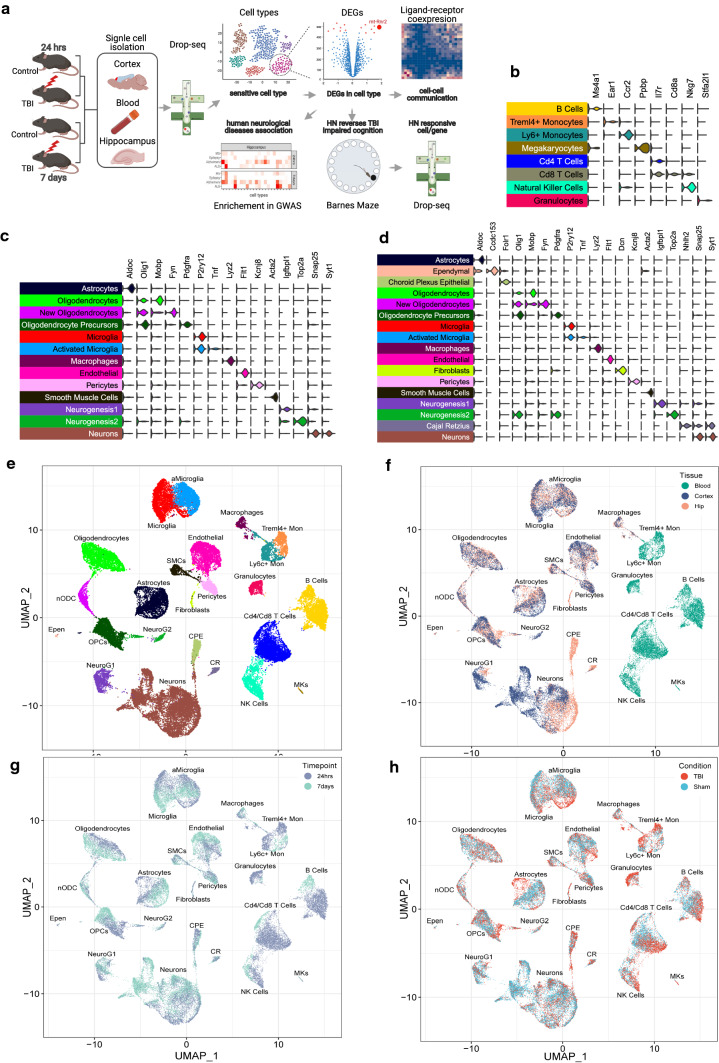
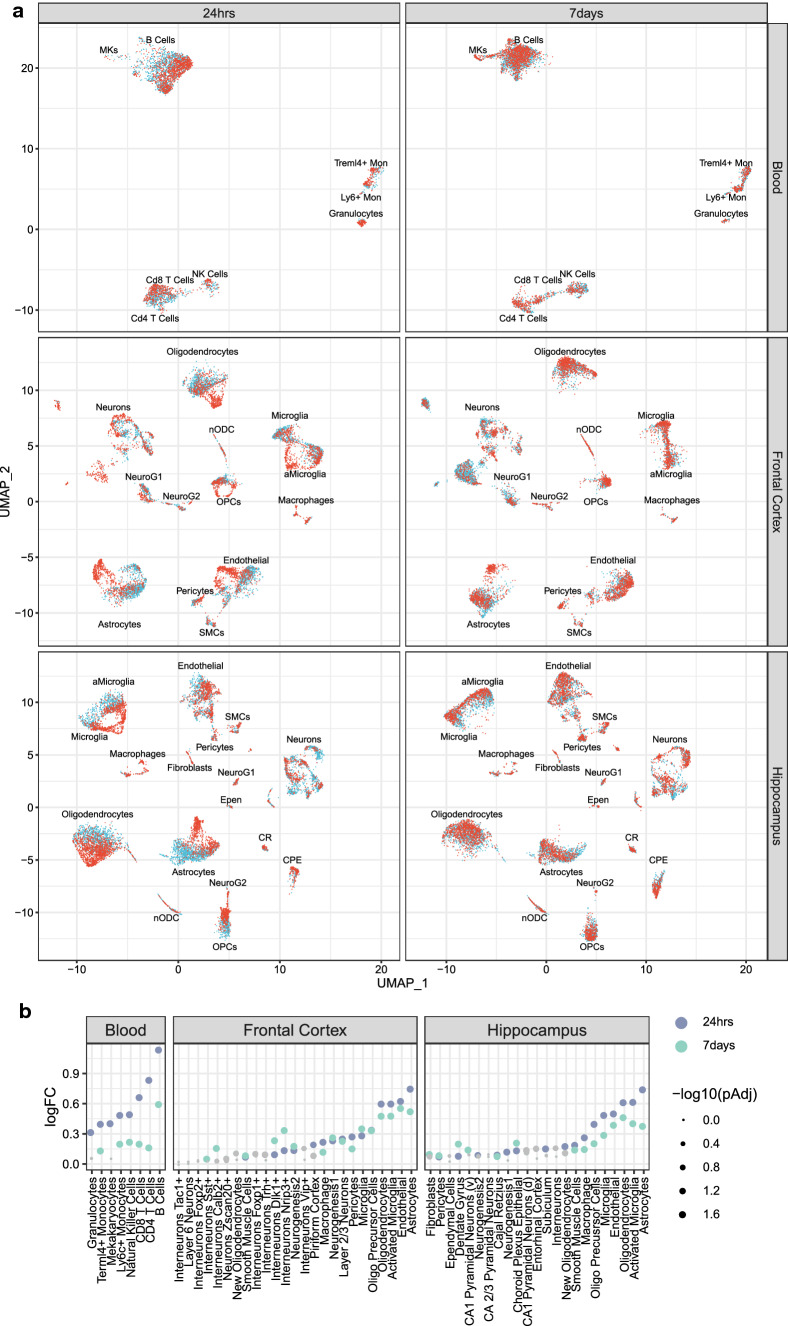
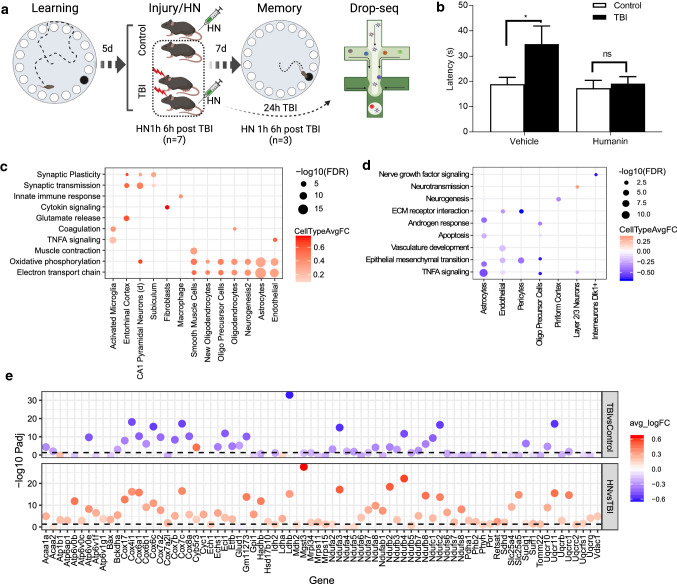
Methods: We profiled three tissues (hippocampus, frontal cortex, and blood leukocytes) at the acute (24-h) and subacute (7-day) phases of mTBI at single-cell resolution.

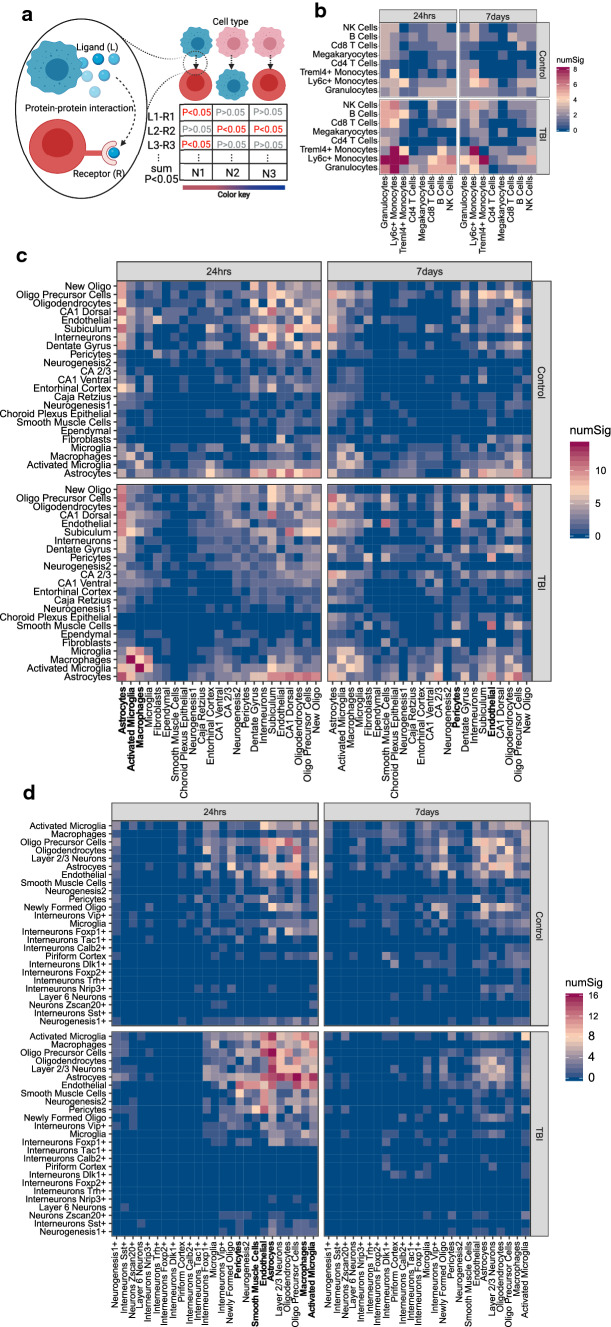
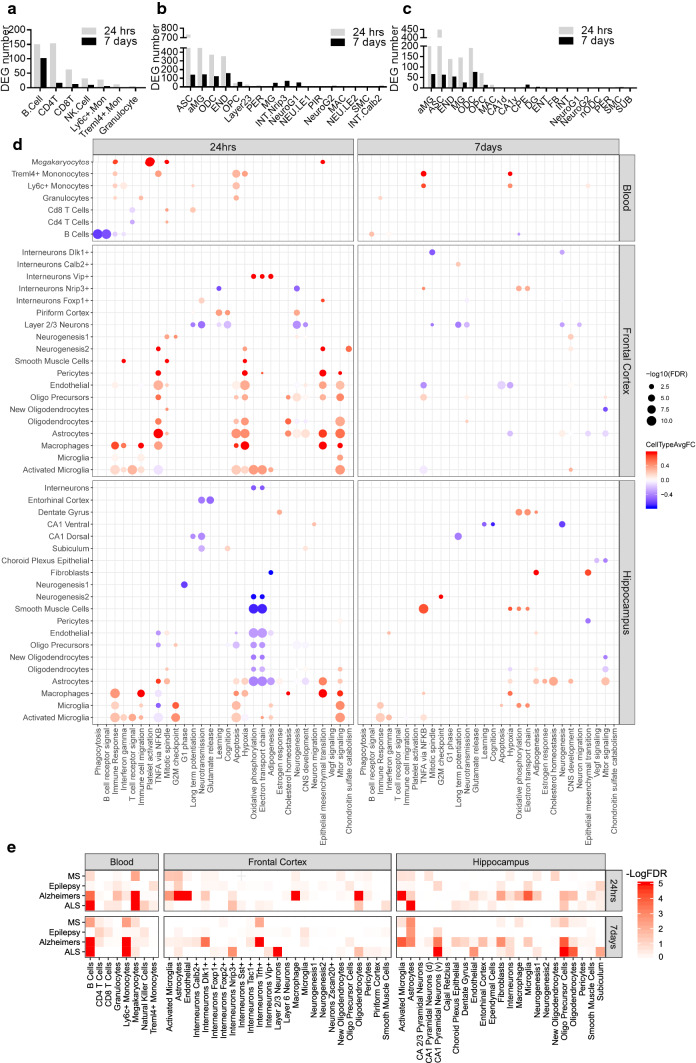
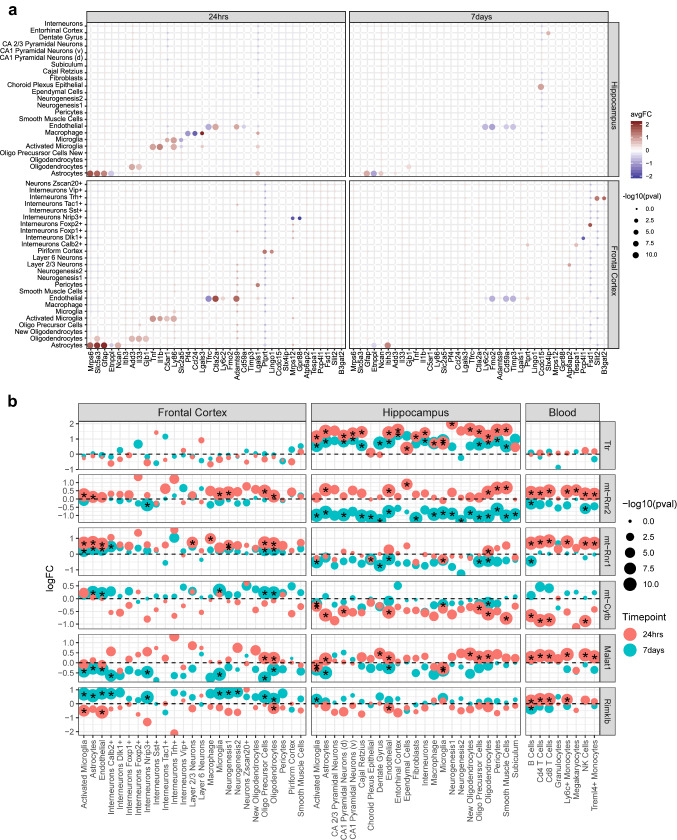
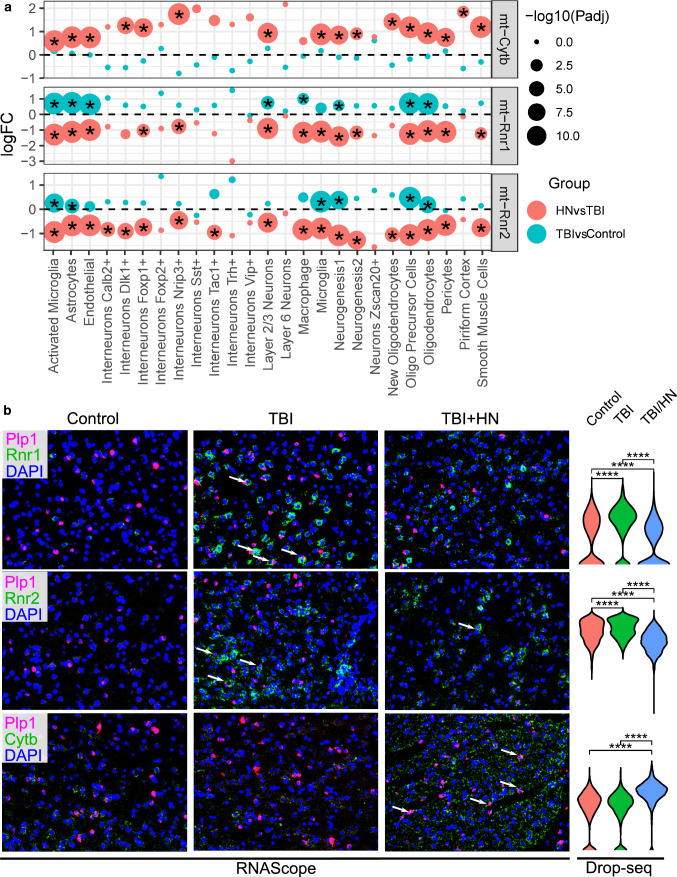
Results: We demonstrated that the coordinated gene expression patterns across cell types were disrupted and re-organized by TBI at different timescales with distinct regional and cellular patterns. Gene expression-based network modeling implied astrocytes as a key regulator of the cell-cell coordination following mTBI in both hippocampus and frontal cortex across timepoints, and mt-Rnr2, which encodes the mitochondrial peptide humanin, as a potential target for intervention based on its broad regional and dynamic dysregulation following mTBI. Treatment of a murine mTBI model with humanin reversed cognitive impairment caused by mTBI through the restoration of metabolic pathways within astrocytes.

Conclusions: Our results offer a systems-level understanding of the dynamic and spatial regulation of gene programs by mTBI and pinpoint key target genes, pathways, and cell circuits that are amenable to therapeutics.

Keywords: Astrocytes; Humanin; Mt-Rnr2; Single-cell RNA sequencing; TBI; Traumatic brain injury.


Conflict of interest statement

The authors declare no conflict of interest.

Figures

Fig. 1
Fig. 1
Overall study design and scRNAseq cell clusters and gene markers. a Overall study design. bd Expression of cell markers for each cell type in peripheral blood (b), frontal cortex (c), and hippocampus (d). eh UMAP embeddings of 78,895 cells according to cell types (e), tissues (f; frontal cortex, hippocampus, and peripheral blood), timepoints (g; 24-h vs 7-day), and conditions (h; TBI vs sham control). Each point represents a single cell. Cells are clustered based on transcriptome similarity using Louvain clustering and cell types are identified using canonical markers and labeled on the plot. Within each tissue and timepoint, there are n = 3 animals per group. HN: Humanin
Fig. 2
Fig. 2
Transcriptomic shifts due to mTBI across cell types in the peripheral blood, frontal cortex, and hippocampus at 24-h and 7-day post-TBI. a Difference in the transcriptomes of cells in UMAP for each tissue, timepoint, and mTBI condition, with cells from TBI animals in red and cells from sham control animals in blue. b Euclidean distance between TBI and sham control cells within each cell type for each tissue and timepoint. The log fold change (logFC) between the empirical distance and null distribution for each cell type which quantifies the global transcriptome shift is indicated on the y-axis. Each point is colored by timepoint and the size of each point relates to the adjusted p-value. Gray points do not achieve statistical significance whereas colored dots reach adjusted p-value < 0.05
Fig. 3
Fig. 3
Alterations in ligand–receptor-mediated cell–cell communication in mTBI in individual tissues and timepoints. a Schematic diagram of CellPhoneDB which was applied to our single-cell data to infer significant ligand–receptor interactions between pairs of cells within the same tissue. Each plot is split into four panels which denote the timepoint (24-h or 7-day post-TBI) and the condition (sham control or TBI). The rows and columns indicate the interacting cell types determined by the number of ligand–receptor pairs between cell types. The color of each tile denotes the number of significant interactions between the two cell types under the assumption that cell types which are communicating more will have a larger number of ligand–receptor interactions. This method was applied to single-cell data from: b peripheral blood, c hippocampus, and d frontal cortex. The cell types mentioned in the main text were highlighted with red rectangles
Fig. 4
Fig. 4
Differentially expressed genes (DEGs) and pathways induced by mTBI across tissues and timepoints and relevance of DEGs to human neurological disorders. ac The comparison of DEG number in each cell type induced by TBI between two timepoints for peripheral blood (a), frontal cortex (b), and hippocampus (c). d Top enriched pathways induced by mTBI for each tissue and timepoint combination. Each dot is colored by the average log fold change between TBI vs sham control cells within that cell type for significant DEGs which overlap the indicated pathway. The size of each dot is proportional to the −log10(FDR). Cell types and pathways have been clustered with hierarchical clustering. e Enrichment of human disease GWAS genes in cell-type DEG gene sets across three tissues and two timepoints as assessed by MSEA in Mergeomics. Color corresponds to −log10(FDR) of the enrichment
Fig. 5
Fig. 5
Top cell-type-specific and multi-cell-type DEGs. a The top DEGs which were significantly differentially expressed in a single cell type within a particular tissue and timepoint. Each DEG is depicted in a separate column and cell types are indicated by rows. The left panel is from 24-h post-TBI and the right panel is from 7-day post-TBI. The color of each dot indicates the log (fold change) of the bene between TBI and sham control cells (red indicates higher in TBI; cyan indicates lower in TBI) within a particular cell type. The size of each dot corresponds to the −log10(adjusted p-value). b The top DEGs significantly differentially expressed in the most cell types across tissues and timepoints. Each row depicts a DEG. The genes which are significantly differentially expressed (adjusted p-value < 0.05) in specific cell types are indicated by a star. The color of each dot indicates the timepoint (24-h in red and 7-day in blue) at which the DEG was found and the size of the dot corresponds to the −log10(p-value). The y-axis is the log(fold change) of the gene between TBI and sham control cells within a particular cell type. Cell types are indicated on the x-axis
Fig. 6
Fig. 6
Experimental validation of humanin as a treatment target. a Schematic diagram of study design. b Bar plot of latency to navigate the maze for sham control and TBI mice treated with vehicle and humanin. Learning was conducted for 4 days prior to injury/surgery and memory was tested 7 days after injury/surgery. Statistics was computed using two-way ANOVA with Bonferroni correction for multiple comparison test. *p < 0.05, ns represents not significant, n = 6 per group. c, d Top enriched pathways of genes reversed by humanin treatment in hippocampus (c) and frontal cortex (d). Each point is colored by the average log(fold change) between cells from humanin-treated TBI animals and TBI cells within that cell type for significant DEGs which overlap the indicated pathway. The size of each dot corresponds to the −log10(FDR). Cell types and pathways have been clustered with hierarchical clustering. e Differentially expressed genes in the oxidative phosphorylation pathway in hippocampal astrocytes at 24-h post-TBI. Genes within the pathway are on the x-axis and −log10(adjusted p-value) of the differentially expressed gene on the y-axis. The color of each dot indicates the fold change between the groups; positive fold change is in red and negative fold change is in blue. The top panel shows differential expression for TBI versus sham control cells and the bottom panel shows differential expression for humanin-treated TBI cells versus TBI cells
Fig. 7
Fig. 7
RNAscope validation of select DEGs affected by humanin identified from scRNAseq. a Gene expression of mt-Cytb, mt-Rnr1 and mt-Rnr2 across treatments in different cell populations of cortex with or without humanin (HN). The differentially expressed genes (adjusted p-value < 0.05) are indicated by a star. The color of each dot indicates the group which the DEG corresponds to and the size of the dot corresponds to the −log10(adjusted p-value). The y-axis is the log (fold change) of the gene between TBI and sham control or between TBI/Vehicle and TBI/HN cells within a particular cell type (indicated on the x-axis). b Validation of gene expression changes of mt-Cytb, mt-Rnr1 and mt-Rnr2 in response to TBI with or without HN in oligodendrocytes of cortex using RNAscope. Plp1 was used as oligodendrocytes marker and was stained in pink. The target DEGs mt-Cytb, mt-Rnr1 and mt-Rnr2 were stained in green. The arrows indicate the overlap between marker gene and target DEGs. The expression of each target DEG determined by scRNAseq is displayed as violin plots and Wilcoxon rank-sum test was used to determine statistical significance between sham control, TBI and TBI/HN groups and adjusted p-value was calculated. ****p < 1 × 10−4, ns: p > 0.05

References

    1. Levin HS, Goldstein FC, High WMJ, Eisenberg HM. Disproportionately severe memory deficit in relation to normal intellectual functioning after closed head injury. J Neurol Neurosurg Psychiatry. 1988;51:1294–1301. doi: 10.1136/jnnp.51.10.1294. - DOI - PMC - PubMed
    1. Levin HS, Diaz-Arrastia RR. Diagnosis, prognosis, and clinical management of mild traumatic brain injury. Lancet Neurol. 2015;14:506–517. doi: 10.1016/S1474-4422(15)00002-2. - DOI - PubMed
    1. Rabinowitz AR, Levin HS. Cognitive sequelae of traumatic brain injury. Psychiatr Clin North Am. 2014;37:1–11. doi: 10.1016/j.psc.2013.11.004. - DOI - PMC - PubMed
    1. Yamaki T, Imahori Y, Ohmori Y, Yoshino E, Hohri T, Ebisu T, Ueda S. Cerebral hemodynamics and metabolism of severe diffuse brain injury measured by PET. J Nucl Med. 1996;37:1166–1170. - PubMed
    1. Bergsneider M, Hovda DA, Lee SM, Kelly DF, McArthur DL, Vespa PM, Lee JH, Huang SC, Martin NA, Phelps ME, Becker DP. Dissociation of cerebral glucose metabolism and level of consciousness during the period of metabolic depression following human traumatic brain injury. J Neurotrauma. 2000;17:389–401. doi: 10.1089/neu.2000.17.389. - DOI - PubMed

Substances