Review
. 2023 Jan 1;103(1):433-513.
doi: 10.1152/physrev.00063.2021. Epub 2022 Aug 11.

Developmental and epileptic encephalopathies: from genetic heterogeneity to phenotypic continuum

Affiliations
Review

Developmental and epileptic encephalopathies: from genetic heterogeneity to phenotypic continuum

Renzo Guerrini et al. Physiol Rev. .

Abstract

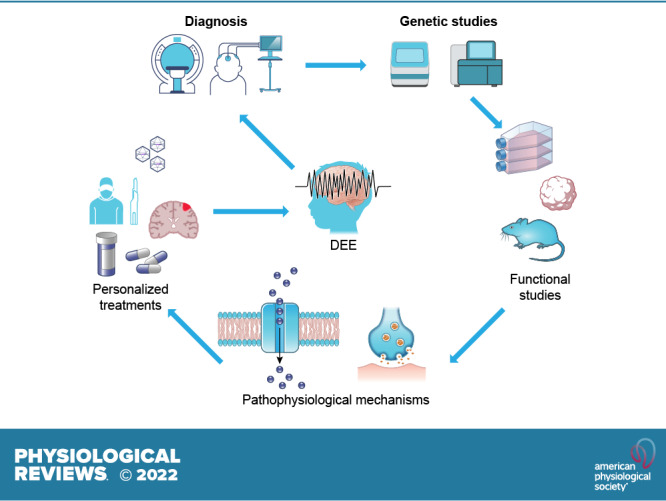
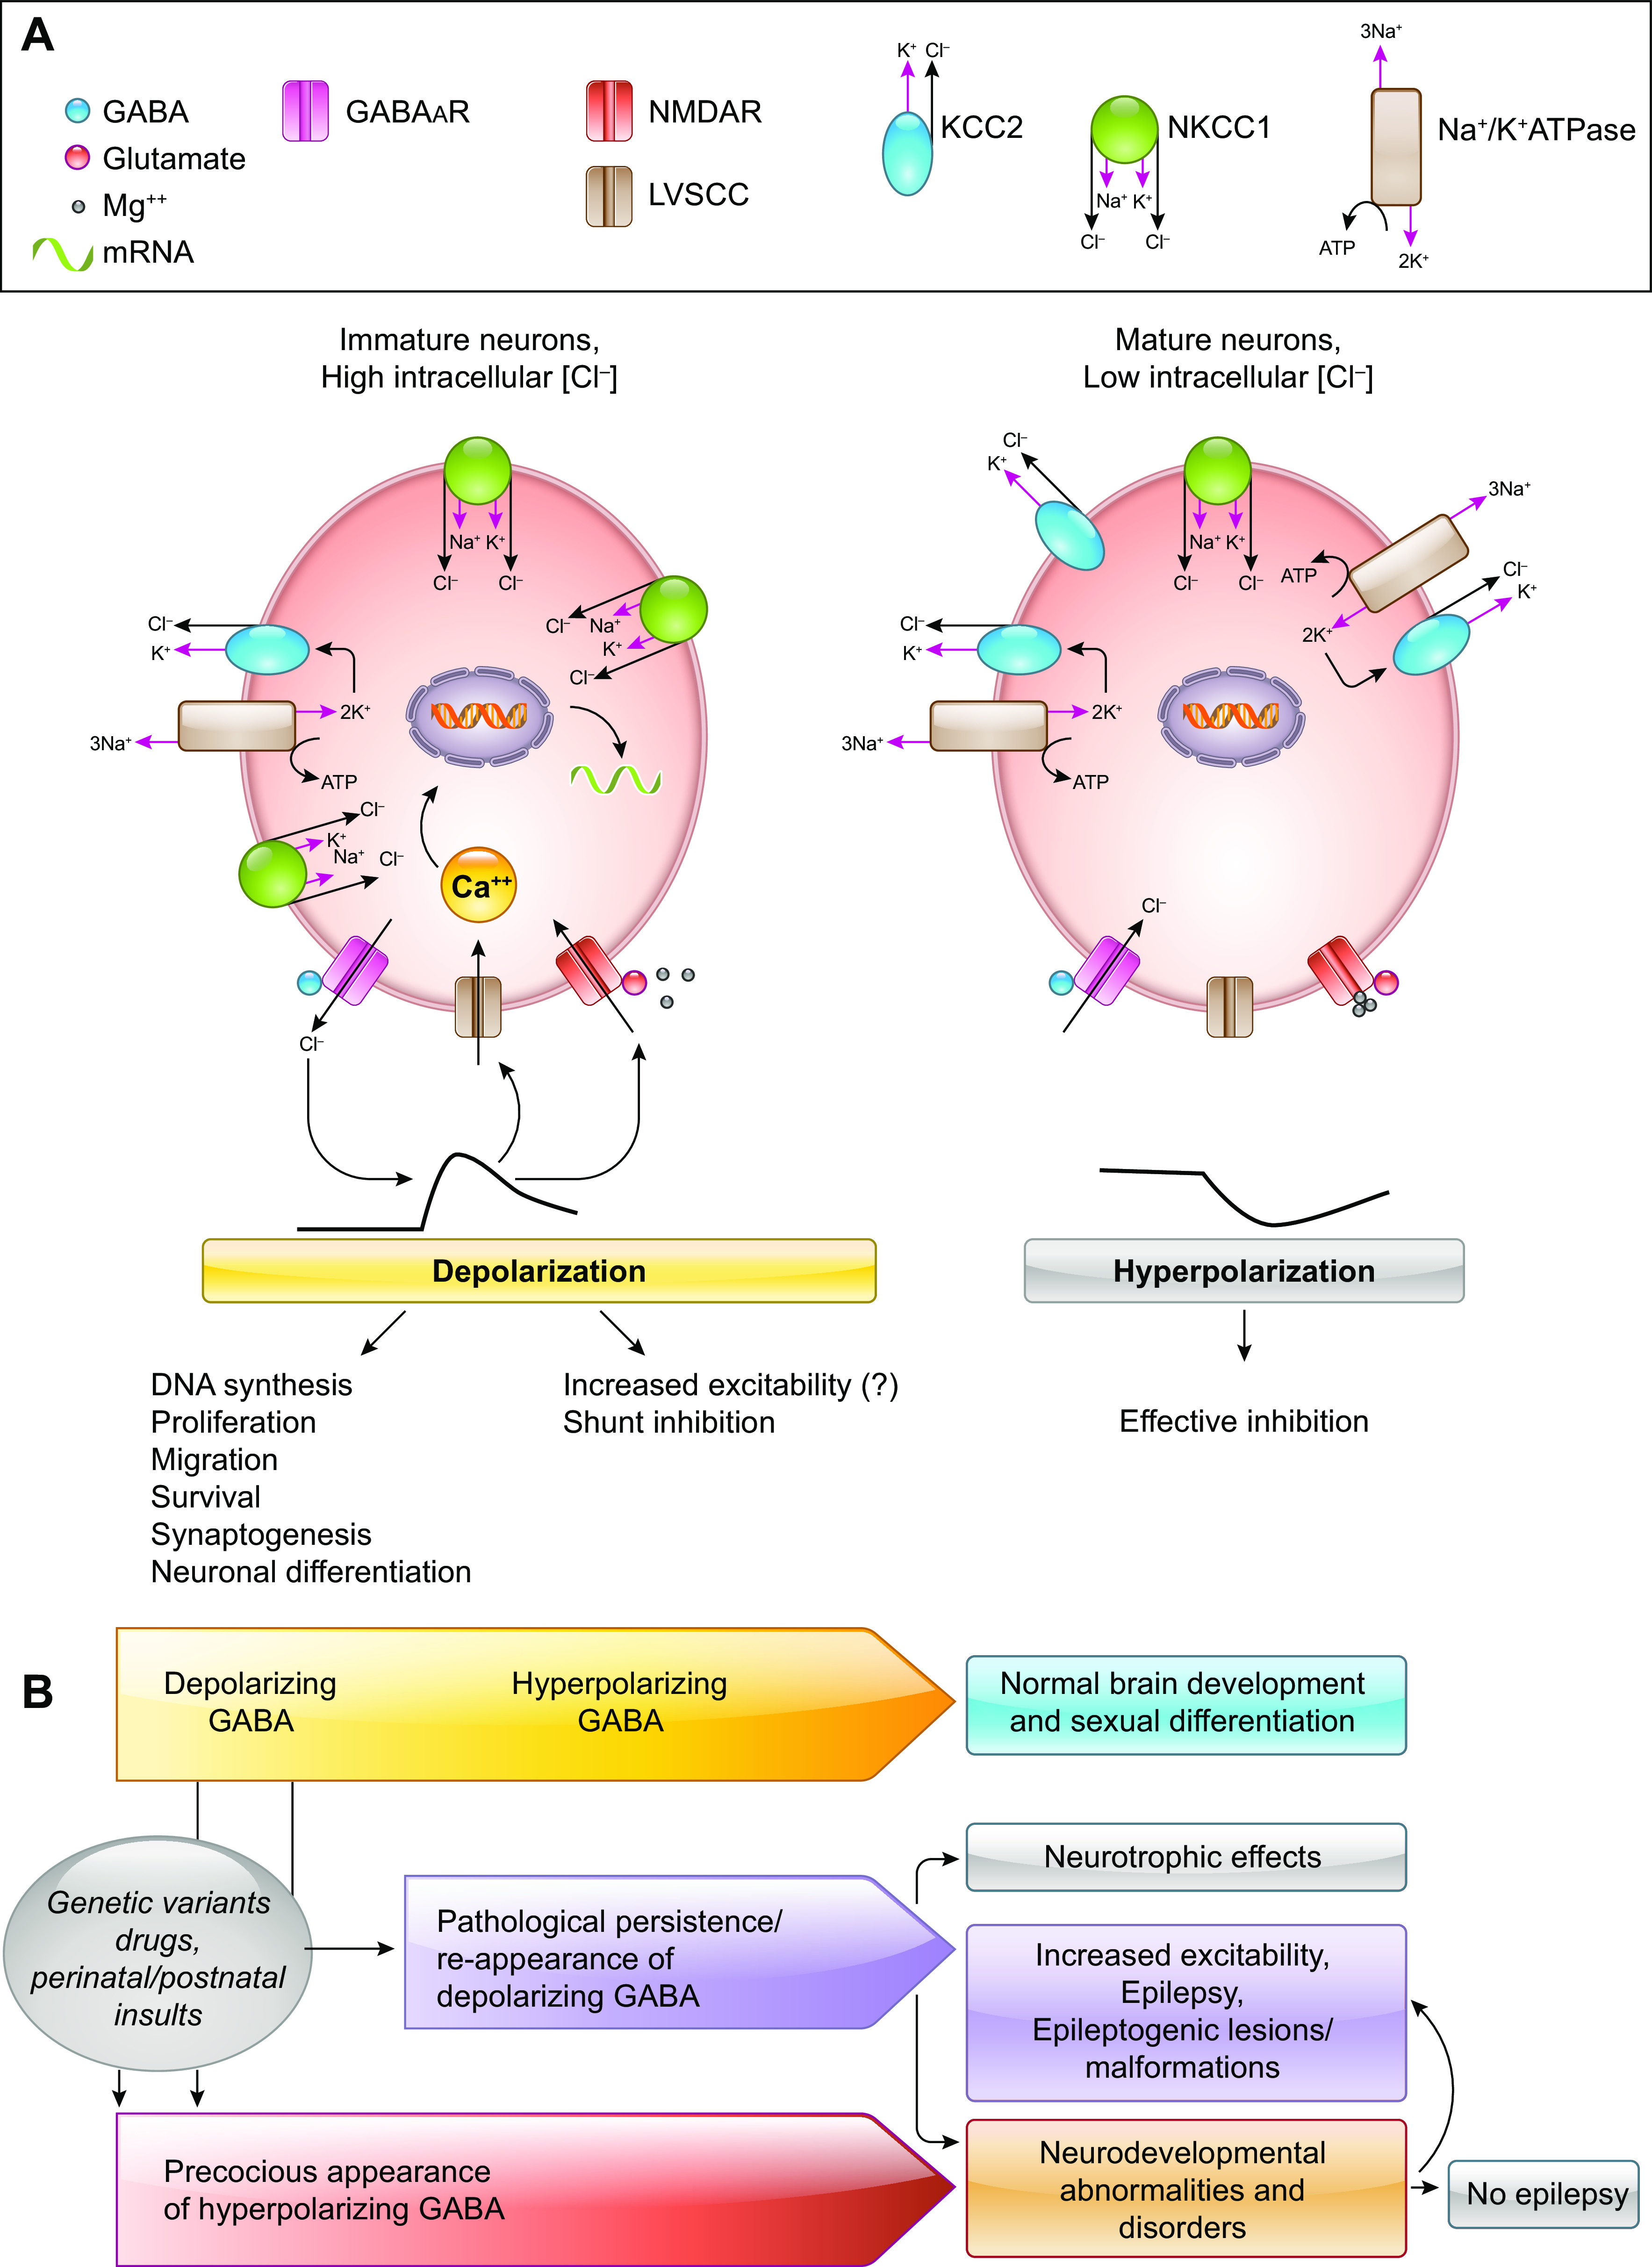
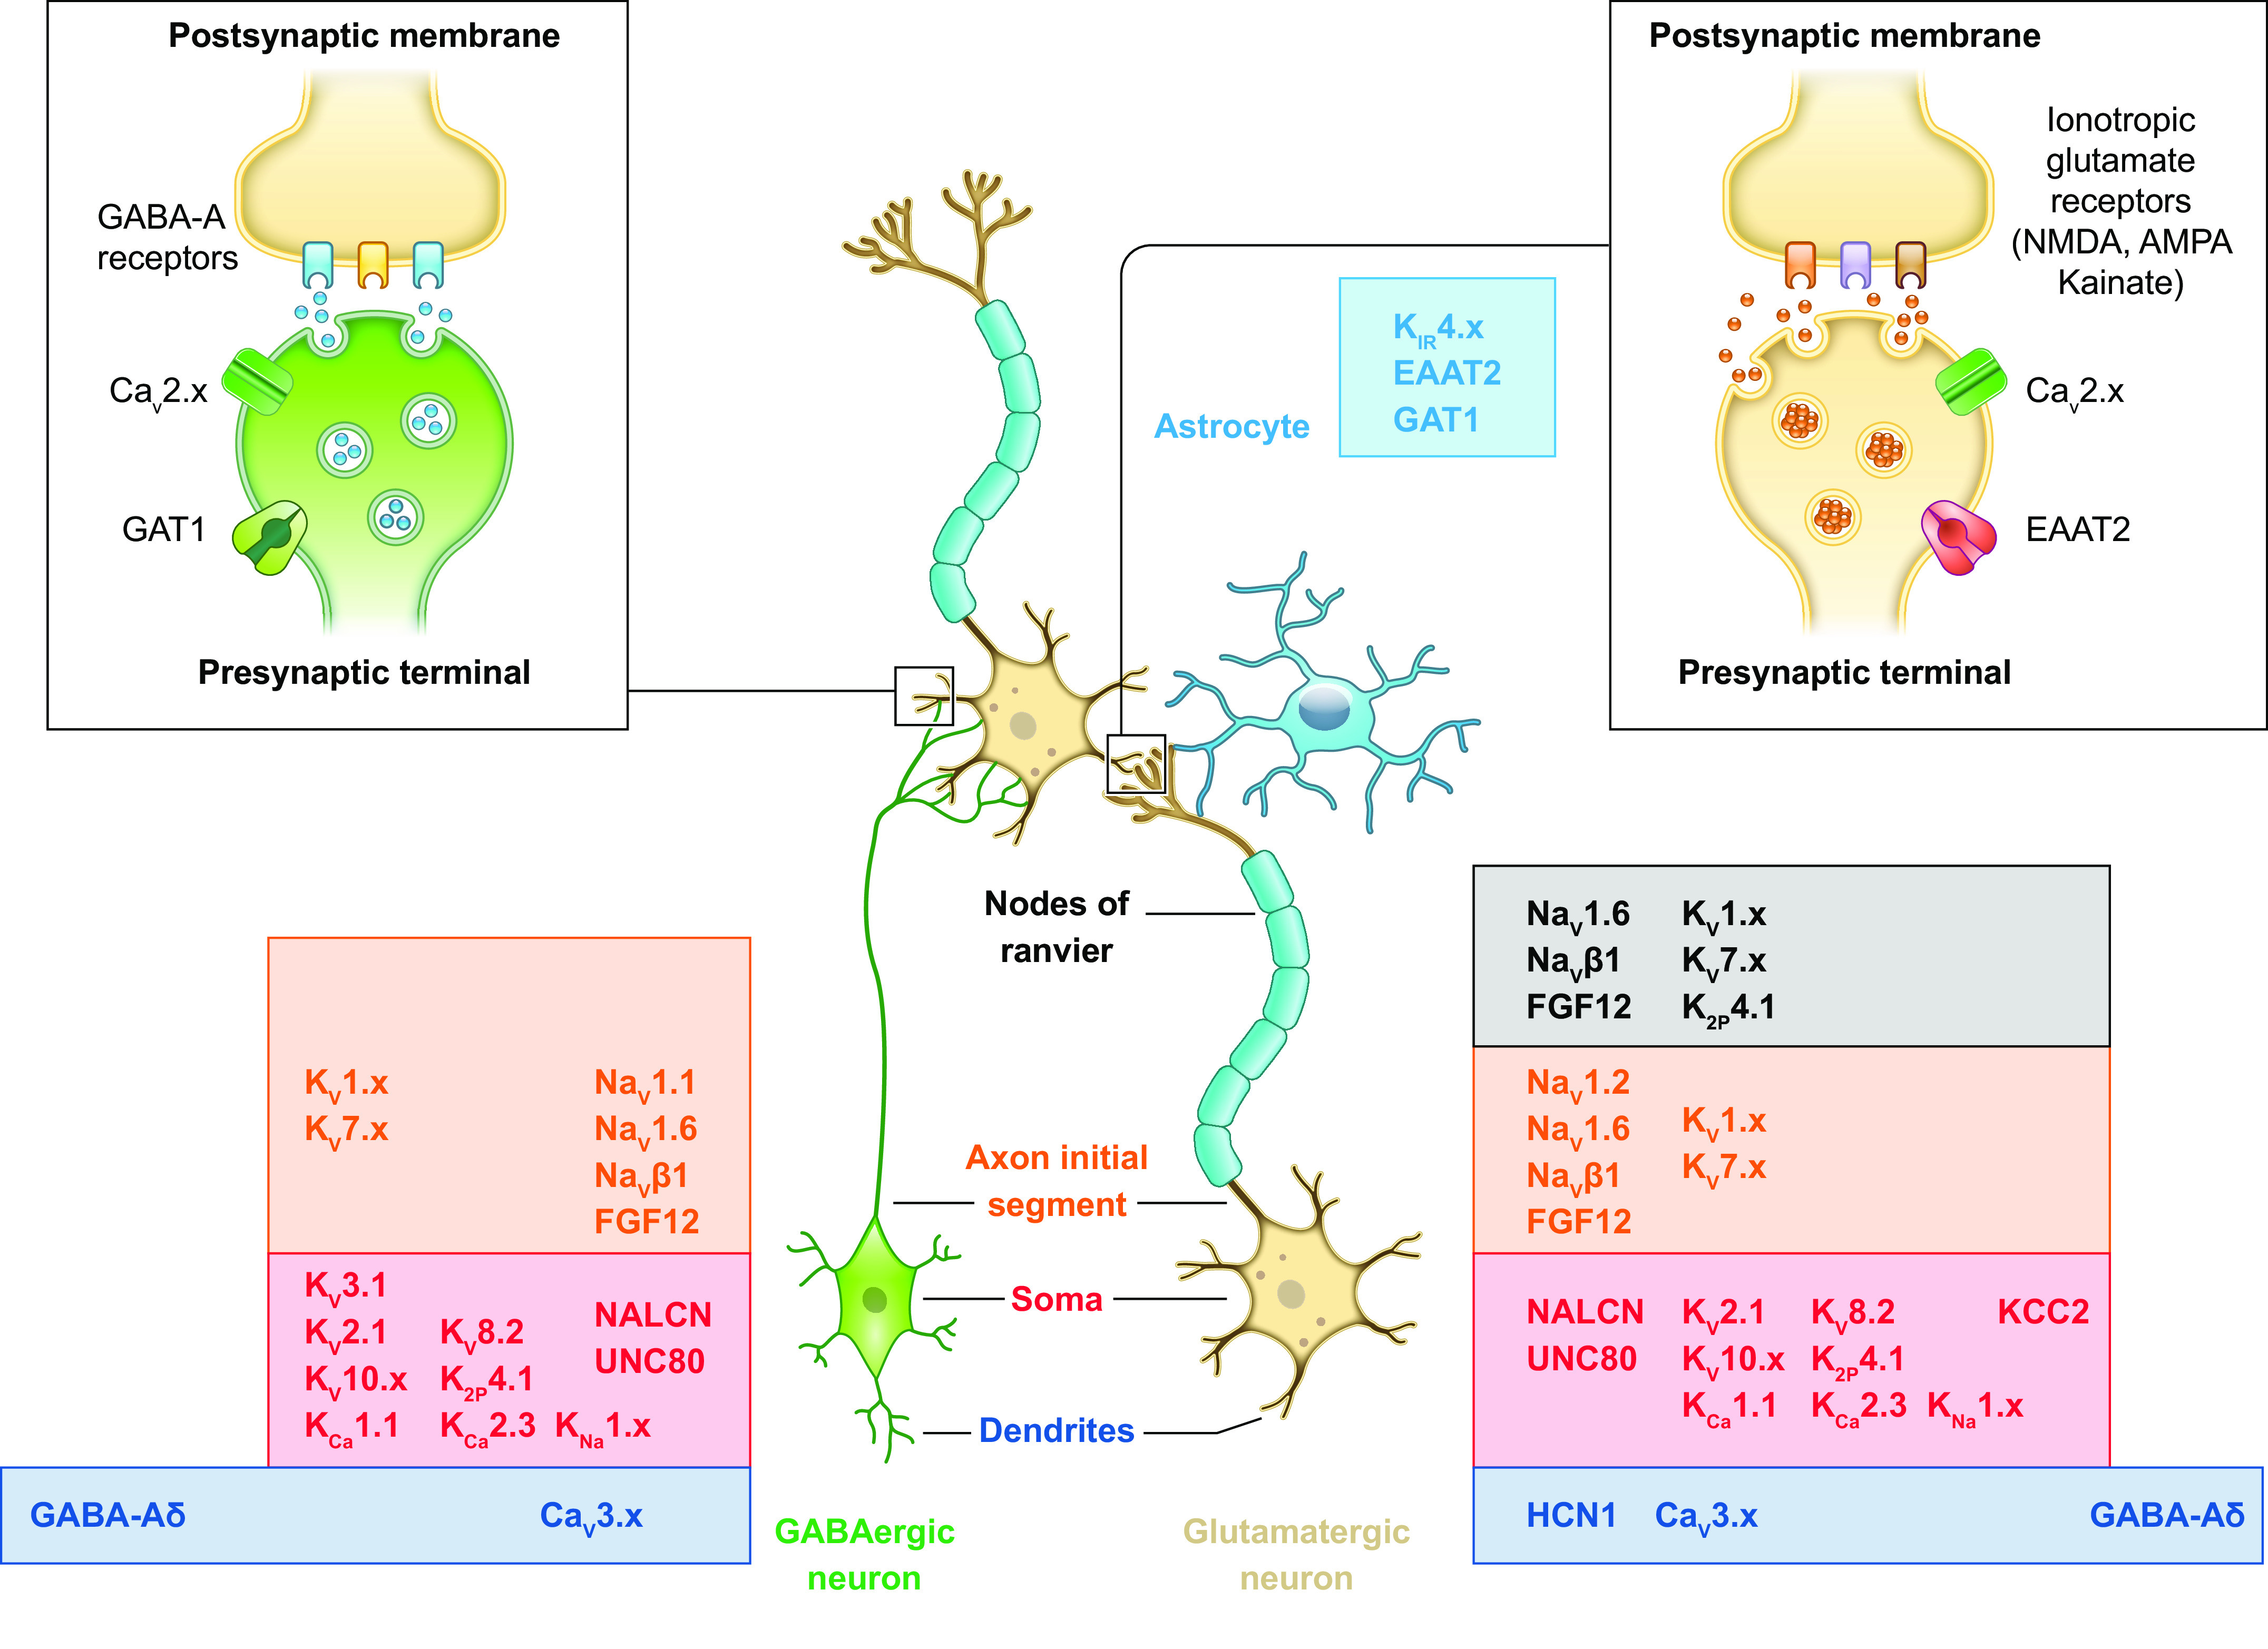
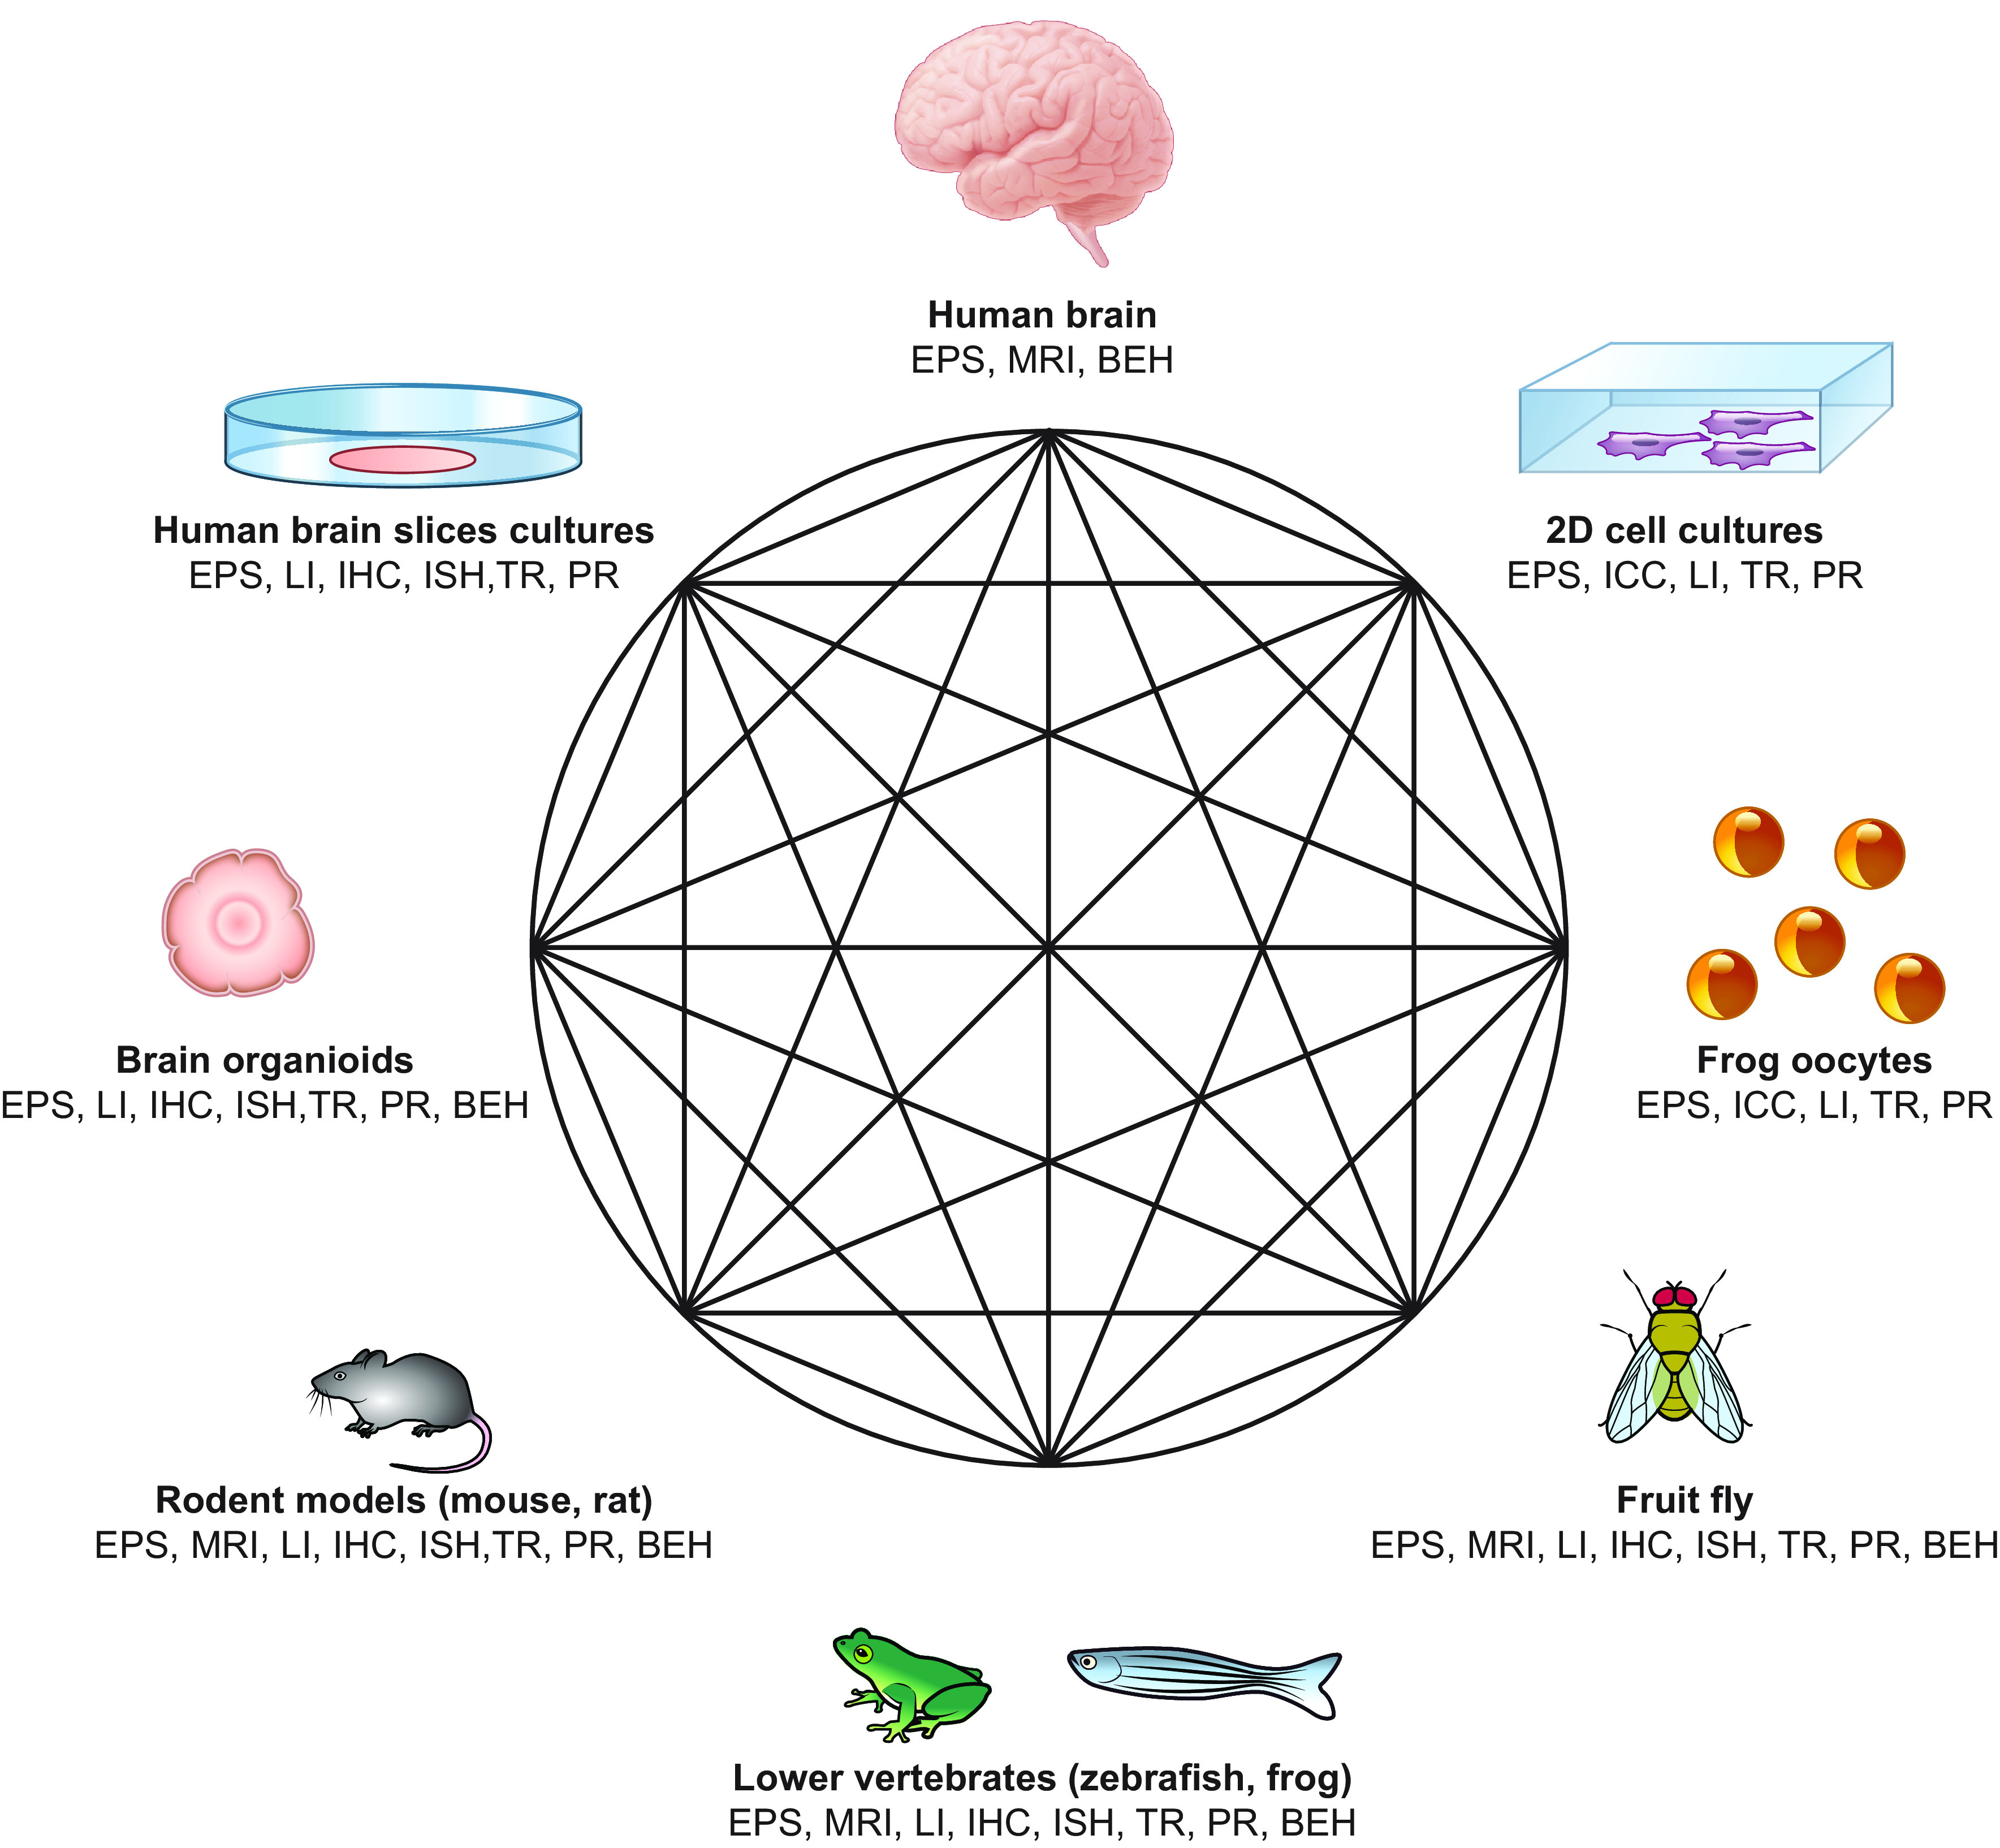
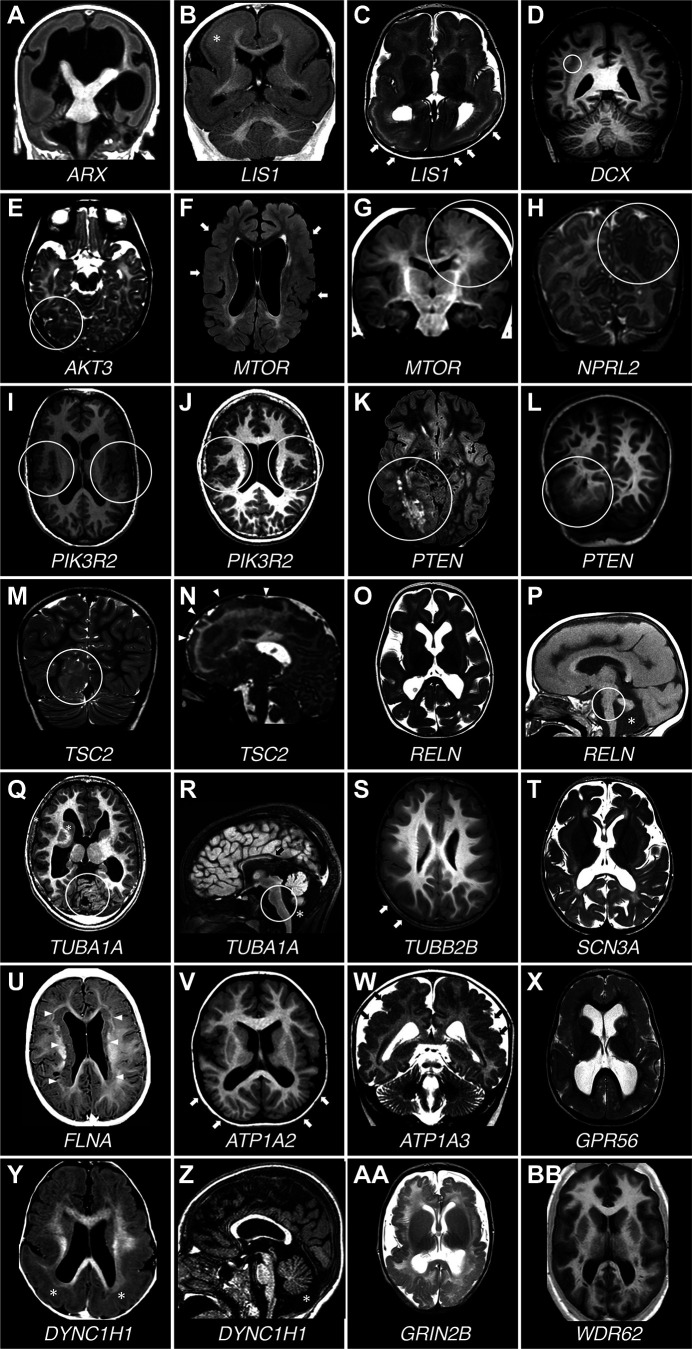
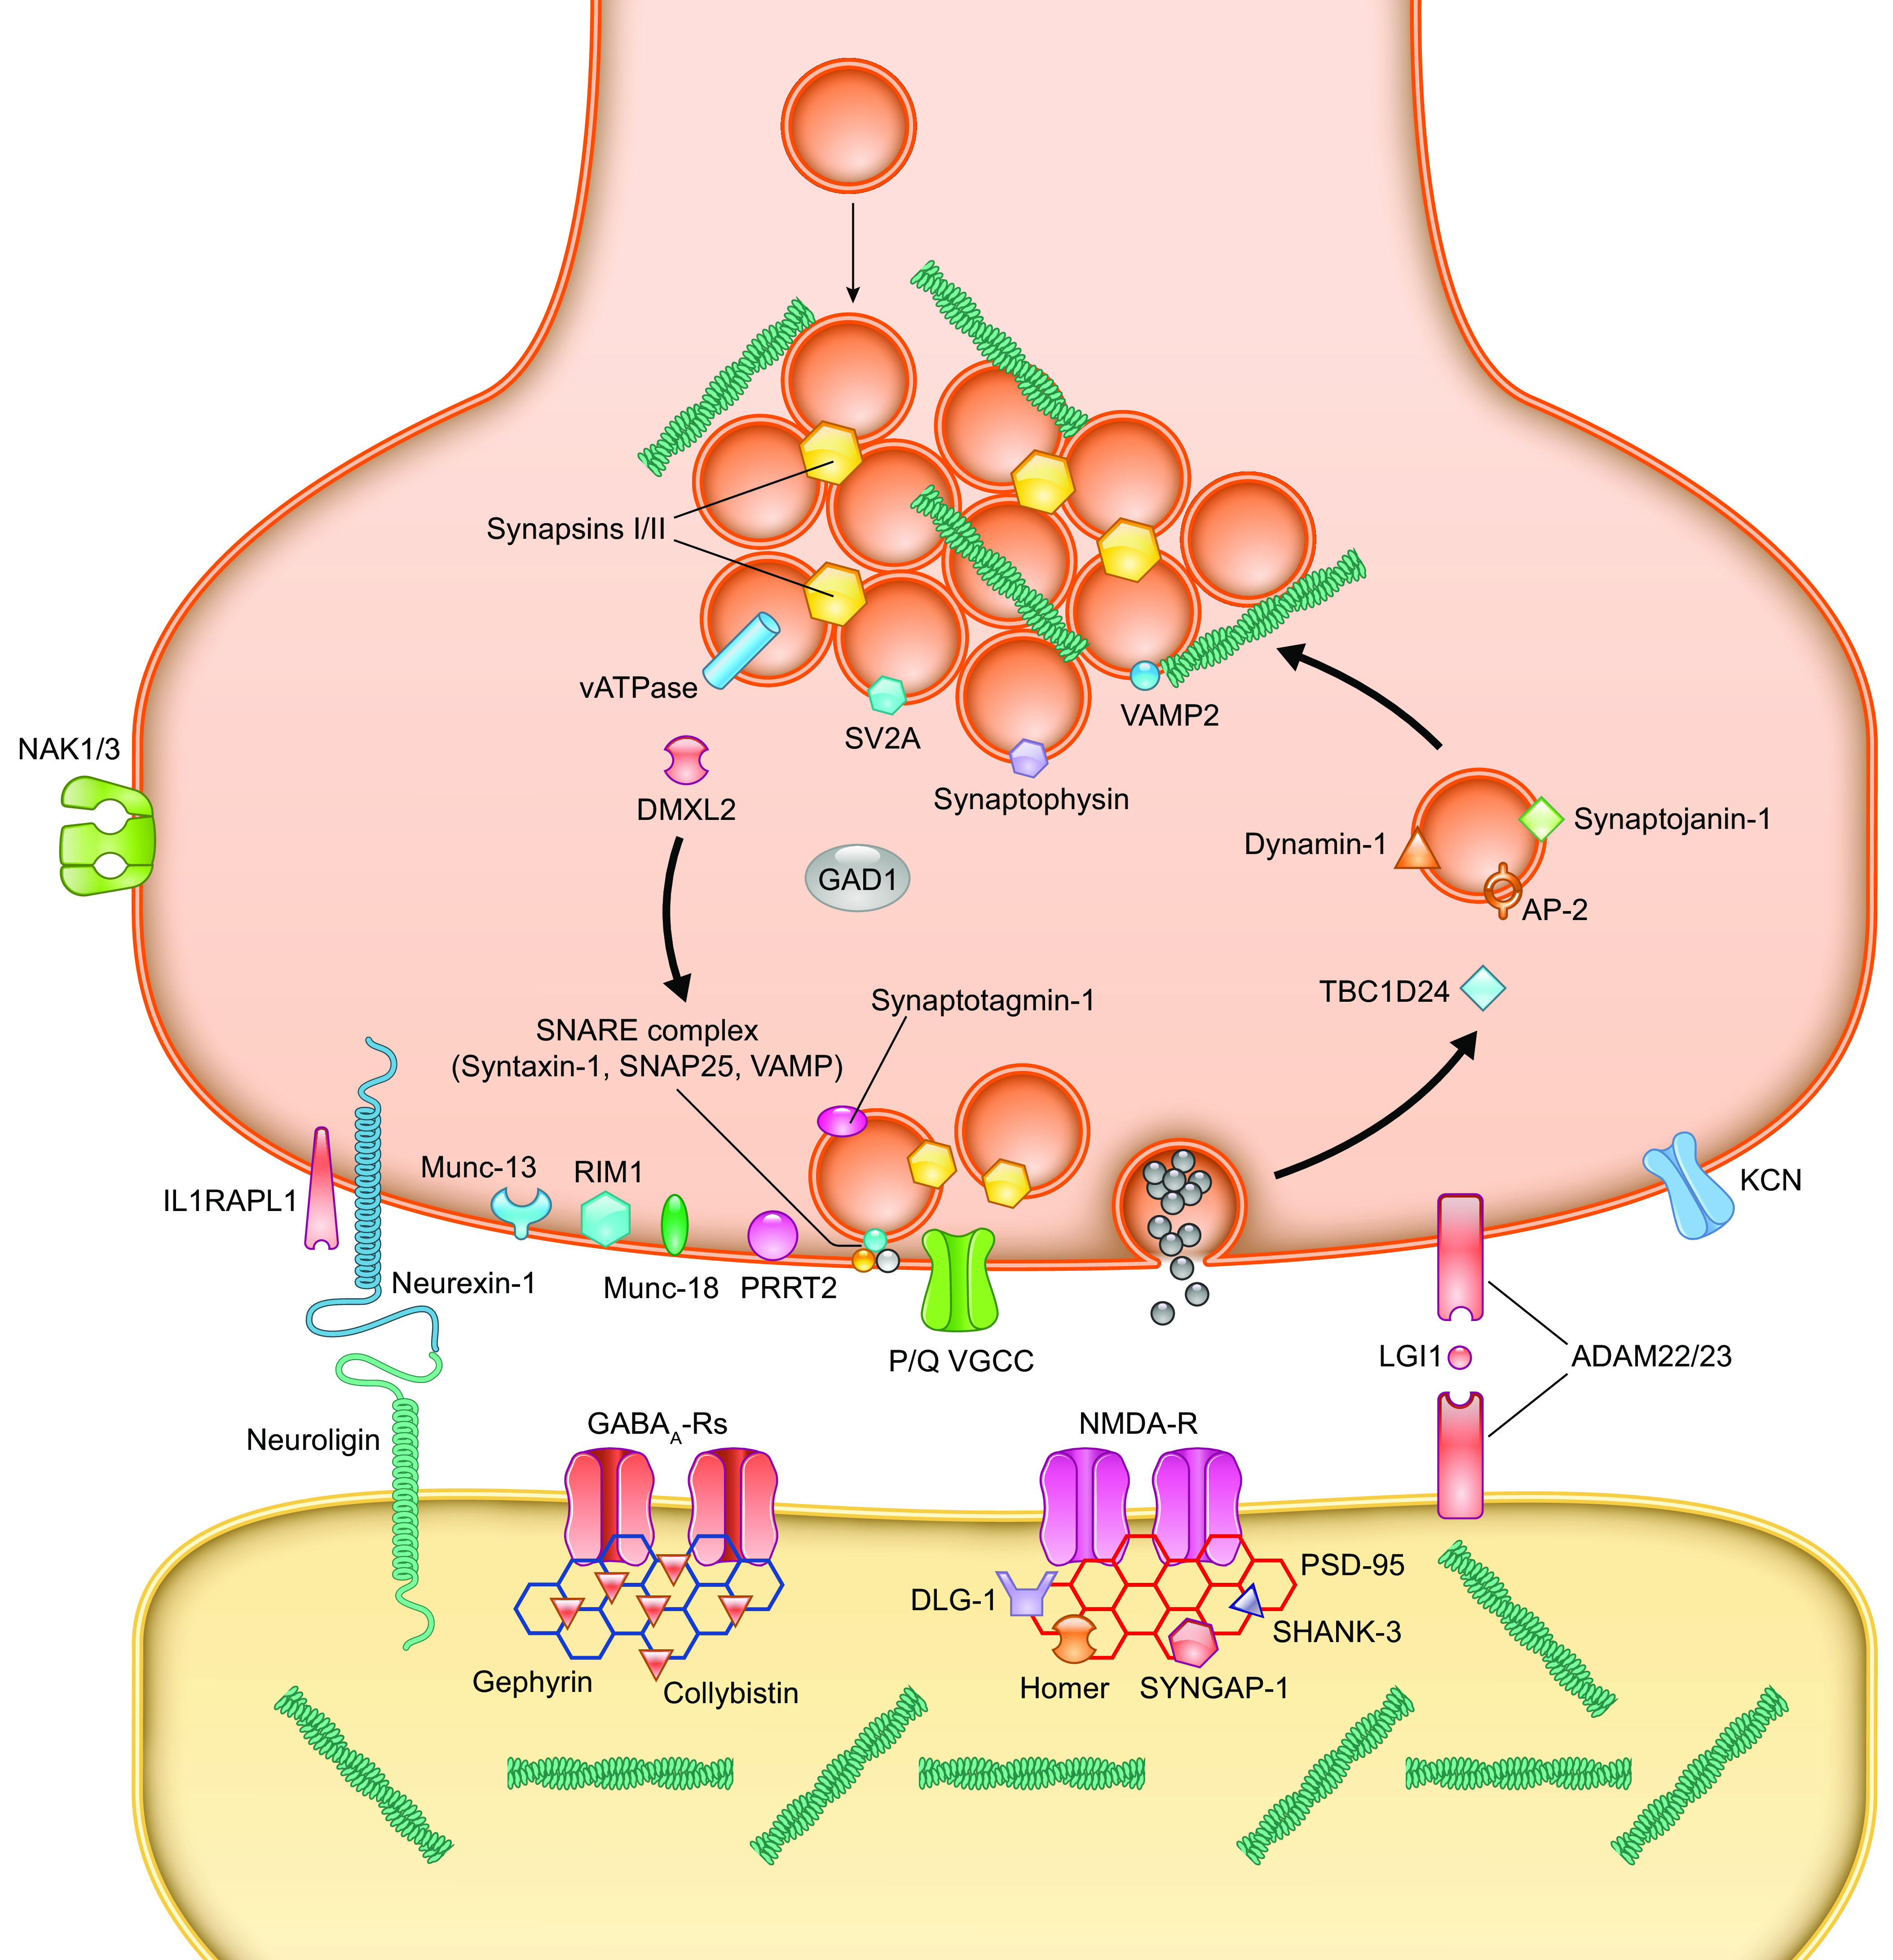
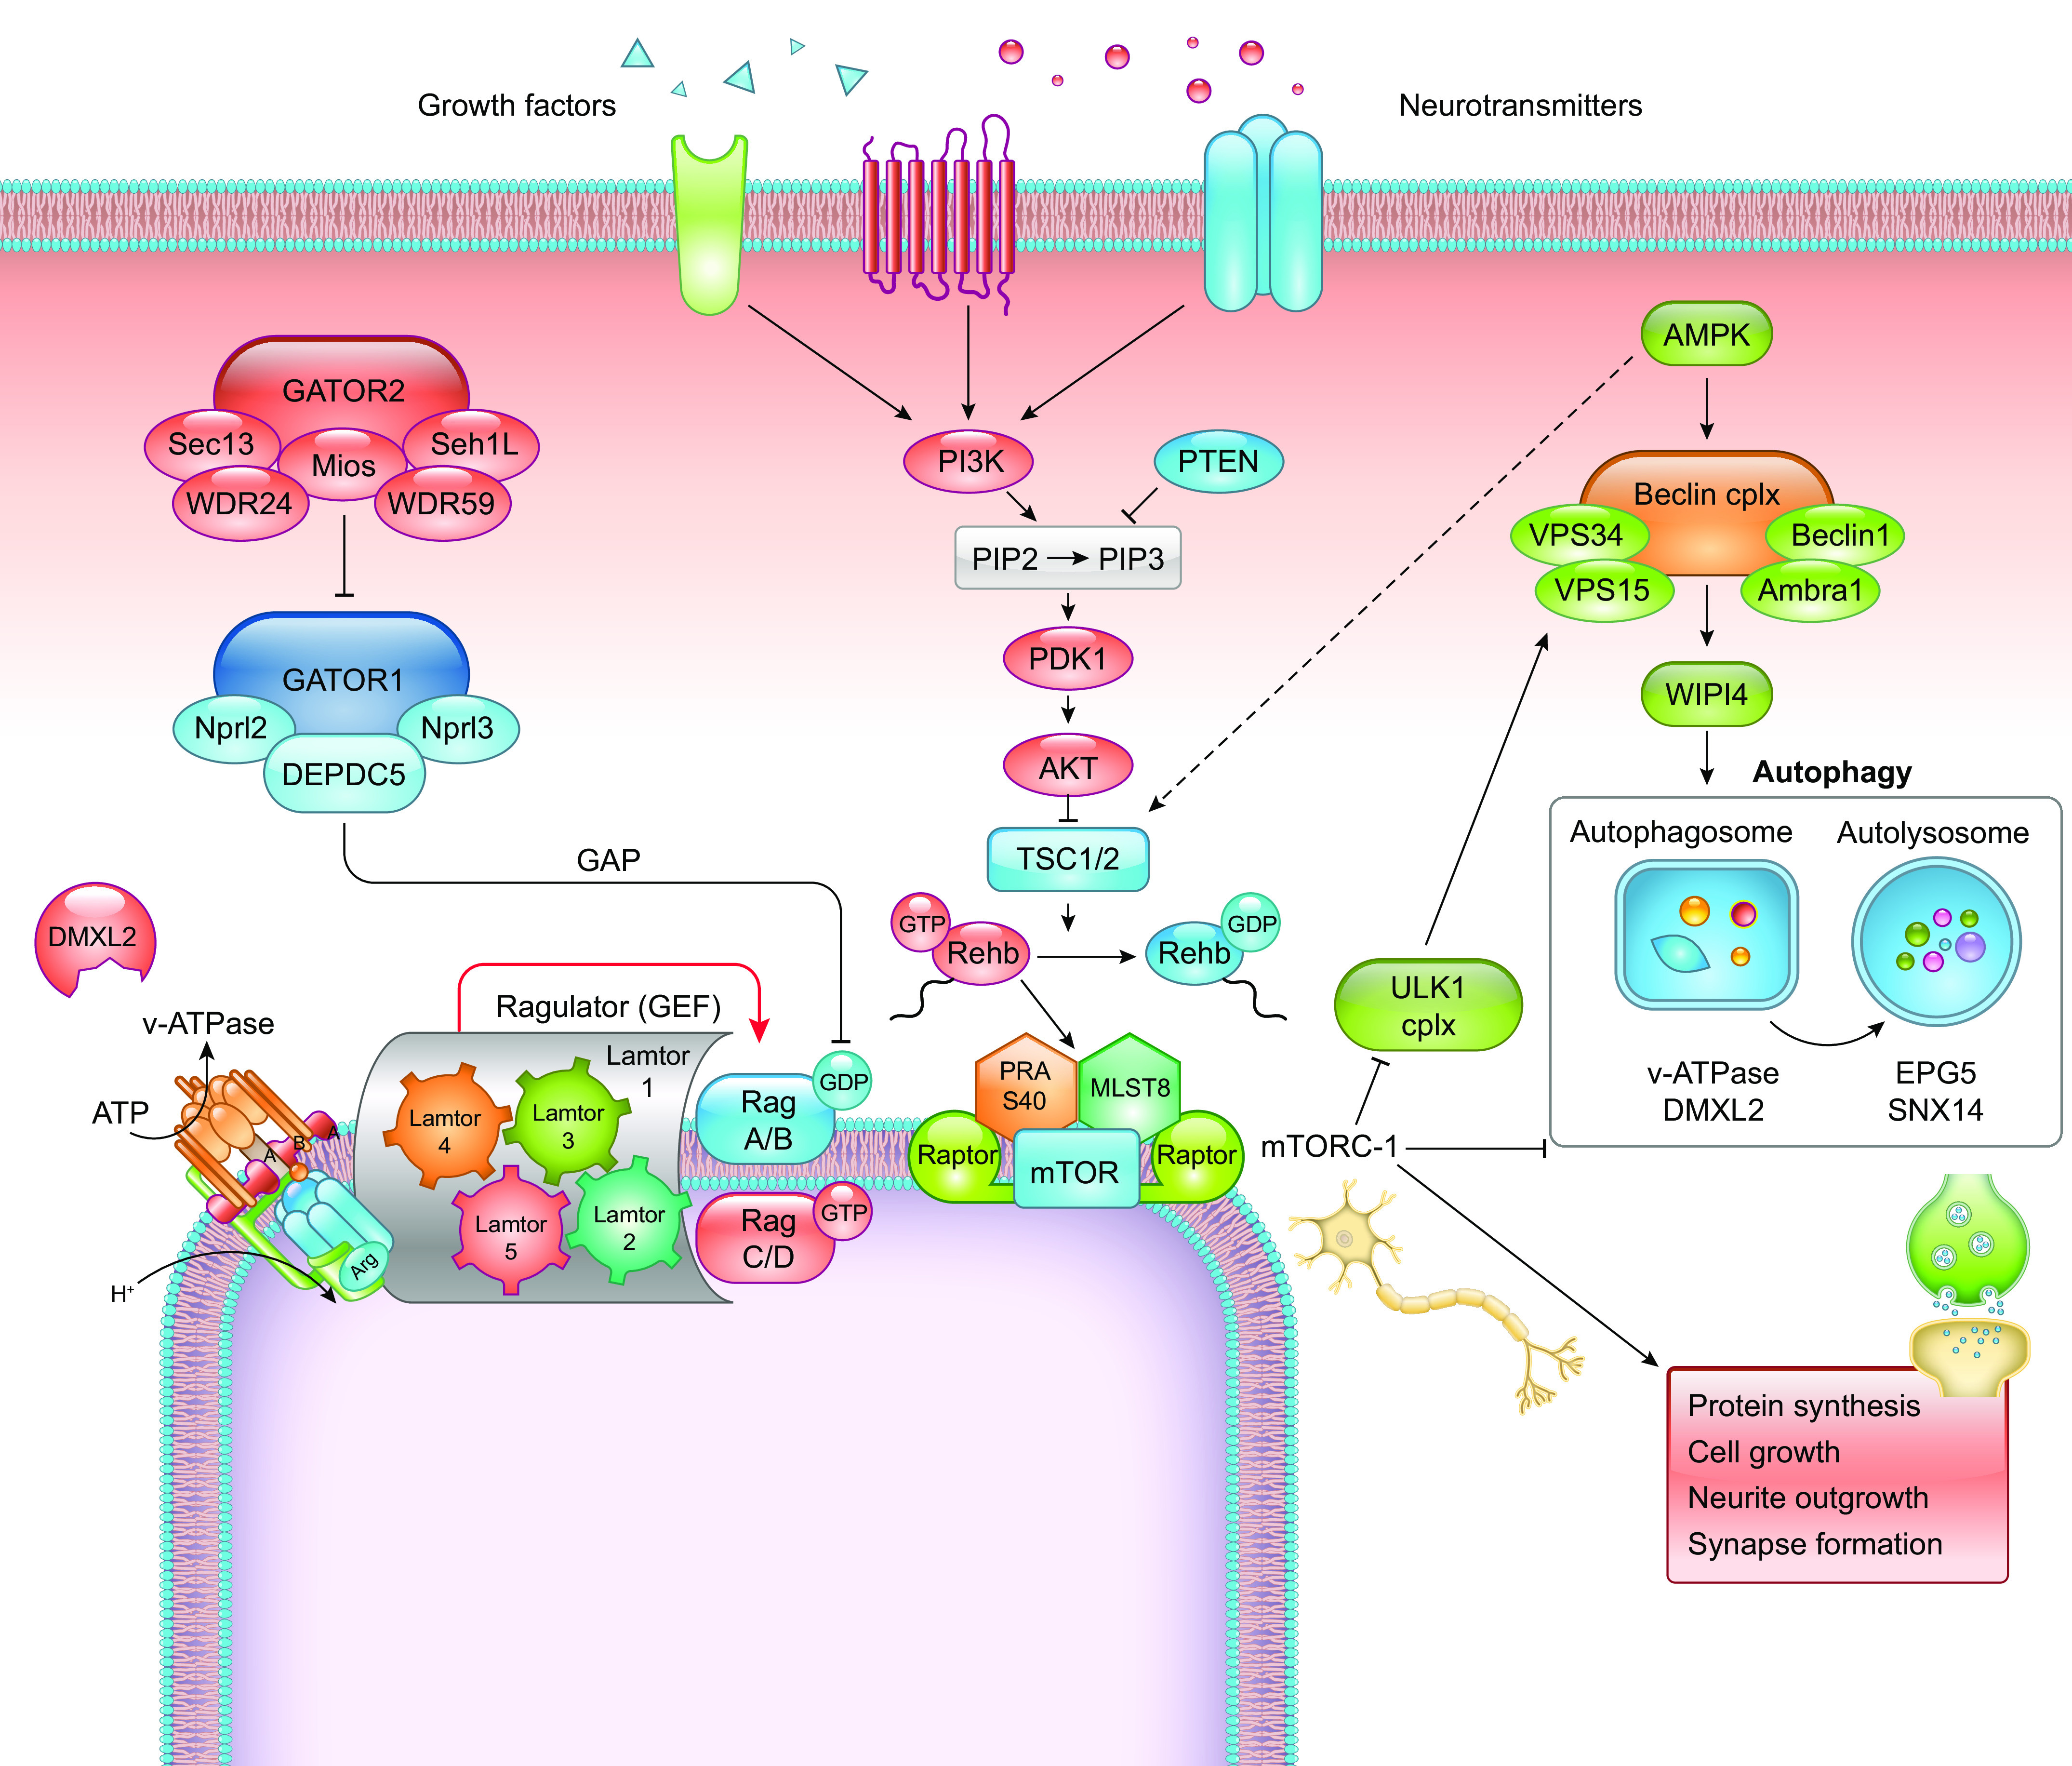
Developmental and epileptic encephalopathies (DEEs) are a heterogeneous group of disorders characterized by early-onset, often severe epileptic seizures and EEG abnormalities on a background of developmental impairment that tends to worsen as a consequence of epilepsy. DEEs may result from both nongenetic and genetic etiologies. Genetic DEEs have been associated with mutations in many genes involved in different functions including cell migration, proliferation, and organization, neuronal excitability, and synapse transmission and plasticity. Functional studies performed in different animal models and clinical trials on patients have contributed to elucidate pathophysiological mechanisms underlying many DEEs and have explored the efficacy of different treatments. Here, we provide an extensive review of the phenotypic spectrum included in the DEEs and of the genetic determinants and pathophysiological mechanisms underlying these conditions. We also provide a brief overview of the most effective treatment now available and of the emerging therapeutic approaches.

Keywords: channelopathies; developmental and epileptic encephalopathies; epileptogenesis; personalized treatment approaches; synaptopathies.


Conflict of interest statement

A.S. Galanopoulou is the Editor-in-Chief of Epilepsia Open and receives royalties from Elsevier, Medlink, and Morgan and Claypool for publications. None of the other authors has any conflicts of interest, financial or otherwise, to disclose.

Figures

None
Graphical abstract
FIGURE 1.
FIGURE 1.
Schematic representation of an example of “poison exon”-mediated protein degradation. A shows a hypothetical gene encoding a transmembrane protein with 4 transmembrane segments. The gene comprises 9 coding exons (1–9) and a potential poison exon (P). In the canonical splicing, the poison exon is not included in the mRNA, which is translated into the wild-type protein. After translation, the protein is correctly integrated into the plasma membrane, where it exerts its normal function. In B, the presence of an intronic mutation, which can introduce a novel splicing acceptor site, activates an exonic splicing enhancer (ESE; i.e., a sequence that promotes the inclusion of an exon in an mRNA) or disrupts an exonic splicing silencer (ESS; i.e., a sequence that inhibits the inclusion of an exon in an mRNA), promoting the inclusion of the poison exon in the mRNA. The poison exon alters protein amino acid sequence and introduces a premature stop codon (PTC). The PTC is recognized by cellular surveillance systems, and the mutant protein is degraded.
FIGURE 2.
FIGURE 2.
Schematic representation of the cortical and subcortical zones and mechanisms involved in epileptic seizure generation and spreading. A: schematic model of networks involved in spike and wave generation in generalized epilepsies. Thalamic relay neurons in the thalamocortical circuit can activate cortical pyramidal neurons and vice versa. Thalamus-mediated cortical activation is largely controlled by thalamic reticular neurons. They hyperpolarize thalamic relay neurons through γ-aminobutyric acid type B (GABAB)-mediated signals and are themselves inhibited by neighboring reticular neurons through GABA type A (GABAA)-mediated signals. Cortical pyramidal neurons can, in turn, activate thalamic reticular neurons in a glutamate-mediated feedforward loop. The neuronal basis of the EEG spike and wave in this reverberating loop derives from an alternance of the summated outside-negative excitatory membrane events (each spike) and the summated outside-positive inhibitory membrane events (each slow wave). Spike and waves appear as negative (upward going) events because of a dipole effect as the soma and apical dendrites maintain opposite polarity. B: in the epileptic brain, focal epileptic seizures are generated in the epileptogenic zone (EZ), whereas clinical seizures are generated in the seizure onset zone (SOZ). If the EZ is larger than the SOZ, as in the case depicted, its complete removal is required to guarantee seizures disappearing, as multiple SOZs with different thresholds may coexist in the same EZ. Complete EZ disconnection or removal is also required to ensure that seizures do not spread to other areas connected to it via cortico-cortical and subcortical (i.e. thalamocortical) connections (purple arrows), which can cause secondary generalization. Additional specific cortical areas that can be identified in the epileptic brain are the epileptogenic lesion (EL), which may correspond to either a macroscopic epileptogenic lesion (e.g. focal cortical dysplasia, as shown) or hyperexcitable adjacent cortex, the irritative zone (IZ), representing the area of the normal cortex generating interictal spikes, and the functional deficit zone (FDZ), representing the area of the cortex that does not function normally in the interictal period.
FIGURE 3.
FIGURE 3.
Trajectories of developmental processes in normal brain development. A: the temporal trajectories of selected developmental processes that are important for normal brain development in rodents (top) and humans (bottom) are shown. Birth (B), weaning (W), puberty (P), and adulthood are indicated separately in each panel for rodent or human development. The different timescales used across species (23 days in rodents, 9 mo in human) highlight the significant differences in the speed of maturation across species. The time of brain growth spurt in humans (full-term birth) and rodents [around postnatal day (PN)10] has been used to indicate the ages across species that correspond to a full-term newborn human baby (90). Brain growth spurt in these studies included gross brain growth, DNA, cholesterol, and water content. Puberty onset occurs around PN32–36 in female rats and PN35–45 in male rats, whereas in humans it starts around 10–11 yr in girls and 11–12 yr in boys (91). Distinct processes, such as neurogenesis and migration, synaptogenesis, and synaptic pruning, myelination follow different time courses (–100). However, the staging of the equivalence of developmental stages across species is only approximate, and each developmental process needs to be considered individually. B: significant changes occur during development in the expression or function or various signaling processes. A schematic depiction of the age-related changes in GABA type A receptor (GABAAR) and glutamatergic signaling in rats is presented here; however cell type-, region-, and sex-specific differences also exist (92, 101,102). Early in development, there is less effective GABAAR-mediated inhibition, because of the presence of depolarizing GABAAR signaling (see also FIGURE 4), more tonic and less phasic GABAAR inhibition. In contrast, glutamatergic receptors, such as NMDA receptor (NMDAR) or kainate receptors, also show age-related expression patterns.
FIGURE 4.
FIGURE 4.
Depolarizing and hyperpolarizing GABA type A receptor (GABAAR) signaling in normal development and disease. A: GABAAR signaling is depolarizing early in life because of the higher intracellular Cl concentrations ([Cl]i) that force Cl efflux upon GABAAR activation. Although the GABAAR depolarizations render GABA inhibition less efficient, as it relies upon shunt inhibition, they are critical for normal brain development. GABAAR depolarizations may activate L-type voltage-sensitive calcium (LVSCC) channels and may release the Mg2+ block of NMDA receptors (NMDARs), triggering intracellular Ca2+ rises that are important for neuronal survival, migration, differentiation and integration (–116). The [Cl]i in immature neurons is a result of increased expression and/or activity of Cl importers, like NKCC1 (a Na+-K+-Cl cotransporter) over Cl exporters, like KCC2 (a K+-Cl cotransporter). The Na+-K+-ATPase provides the energy to maintain the cation-chloride cotransporter function. During development, there is a gradual switch in the relative dominance of these cation-chloride cotransporters at specific time points that follows cell type-, region-, and sex-specific patterns (, –119). As a result, mature neurons demonstrate hyperpolarizing GABAAR responses that allow for effective inhibition to occur. B: normal brain development depends upon the age-, cell type-, region-, and sex-appropriate presence of depolarizing and hyperpolarizing GABAAR signaling. Genetic variants, drugs, and perinatal or postnatal insults that trigger precocious presence of hyperpolarizing GABAAR signaling may result in neurodevelopmental deficits or abnormalities that could increase the risk for epilepsy (–116). Conversely, pathological persistence or reappearance of depolarizing GABA has been described in epileptogenic pathologies and may predispose to increased excitability (120).
FIGURE 5.
FIGURE 5.
Simplified diagram of a cortical microcircuit with interconnected glutamatergic and GABAergic neurons, an astrocyte, and cellular/subcellular distribution of ion channels and transporters. A cortical neuronal microcircuit is illustrated as a presynaptic GABAergic neuron (green) and a presynaptic myelinated glutamatergic neuron (ocher) that form synaptic connections on the dendrites of a myelinated glutamatergic neuron (ocher). Glial cells are displayed as an astrocyte (light blue) in proximity of the glutamatergic synapses and as the myelin sheets around the axons of the glutamatergic neurons formed by oligodendrocytes (violet; the soma is not displayed), allowing saltatory conduction at the nodes of Ranvier. The insets at top show in more detail a GABAergic (left) and a glutamatergic (right) synapse. The ion channels and transporters targeted by DEE mutations are indicated with their protein name (see text for details) and their known cellular/subcellular distribution, according to the neuronal subcompartments (dendrites, soma, axon initial segment, nodes of Ranvier of the myelinated axon, presynaptic terminal, and postsynaptic membrane).
FIGURE 6.
FIGURE 6.
Schematic representation of the different in vitro and in vivo models that can be used to study functional effects of mutations affecting developmental and epileptic encephalopathies (DEEs) causative genes. Regardless of the starting point, researchers can move from one model to another based on the type of functional assay they want to apply and the physiological process they want to study. BEH, behavioral studies; EPS, electrophysiological studies; ICC, immunocytochemistry; IHC, immunohistochemistry; ISH, in situ hybridization; LI, live imaging; MRI, magnetic resonance imaging; PR, proteomics; TR, transcriptomics; 2D, 2-dimensional.
FIGURE 7.
FIGURE 7.
Brain MRI of patients with different malformations of cortical development. A: T1-weighted (T1W) coronal section. Lissencephaly in a boy with ARX mutation. The ventricles are severely dilated, the corpus callosum is absent, and the basal ganglia are severely hypoplastic. B and C: coronal T1W and axial T2-weighted (T2W) sections of a brain with posterior > anterior pachygyria and increased cortical thickness. Boy with LIS1 mutation. White asterisk in B indicates the point of more severe cortical thickening. White arrows in C point to areas of more severely smooth and thick cortex. D: T1W coronal section. Diffuse subcortical band heterotopia in a girl with DCX mutation. White circle surrounds the subcortical laminar heterotopia, which forms an almost continuous band beneath the cortex, separated from it by white matter. E: axial T2W section. Right occipital cortical dysplasia (surrounded by a white circle) in a girl with a very low-level mosaic mutation in AKT3 (0.67% in brain, not detectable in blood). F and G: axial fluid-attenuated inversion recovery (FLAIR) and coronal T1W sections in 2 patients carrying mosaic mutations in the MTOR gene with different % of mosaicism (F: p.Thr1977Ile, 20% of mosaicism in blood; G: p.Ser2215Phe, 5.5% of mosaicism in the surgically removed dysplastic brain tissue). In F, the patient has megalencephaly with large ventricles and multiple areas of abnormal cortex alternating infoldings with smooth surface. This pattern is suggestive of polymicrogyria (white arrows). In G, white circle highlights an area of cortical dysplasia with increased volume of the brain parenchyma, blurring of the gray-white matter junction, and irregular cortical folding. H: T2W coronal section. Left parieto-temporal focal cortical dysplasia in a girl with NPRL2 mutation. Circle surrounds the parietal portion of the cortical abnormality. I and J: T1W axial sections in 2 patients carrying the p.Gly373Arg PIK3R2 gene mutation with different % of mosaicism (I: 13% of mosaicism in blood, 43% in saliva; J: 10% of mosaicism in blood, 29% in saliva). Both patients have bilateral perisylvian polymicrogyria (white circles). K and L: axial FLAIR and coronal T1W sections showing right posterior quadrantic dysplasia (white circle) in a boy with a constitutional PTEN mutation. M and N: T2W coronal and sagittal sections in 2 patients with constitutional TSC2 mutations (M: p.Thr1623Ile; N: p.Pro1202His) showing right posterior quadrantic dysplasia caused by a large cortical tuber (M, white circle) and an extensive dysplastic area involving most of the right frontal lobe (N, white arrowheads). O and P: T2W axial and T1W sagittal sections. Lissencephaly with normally thick cortex and cerebellar hypoplasia (P, asterisk) in a girl with RELN mutation. White circle surrounds a hypoplastic brain stem. Q and R: axial and sagittal T1W sections. Thickened cortex with simplified gyral pattern and cerebellar hypoplasia in a boy with TUBA1A mutation. Circles surround the hypoplastic cerebellum and brain stem. Asterisk indicates the area below a hypoplastic cerebellar vermis, and black arrow points to a hypoplastic corpus callosum lacking its most posterior part. S: T1W axial section. Diffusely simplified gyral pattern with prominent thickening and infolding of the sylvian fissures in a boy with TUBB2B mutation. Arrows point to an area of smooth cortex. T: T2W axial section. Severe dysgyria with simplified gyral pattern in a girl with SCN3A mutation. U: T1W axial section. Classical bilateral periventricular nodular heterotopia in a girl with FLNA mutation. Bilateral nodules of subependymal heterotopia (white arrowheads) are contiguous, extensively lining the ventricular walls. V: T1W axial section. Diffuse polymicrogyria, more prominent posteriorly (white arrows) in a boy with ATP1A2 mutation. W: T2W coronal section. Polymicrogyria with abnormal cortical infoldings and packed microgyria (black arrows), combined with abnormal sulcation in a boy with ATP1A3 mutation. X: T2W axial section. Bilateral frontoparietal cortical thickening and diffusely abnormal cortical pattern in a boy with biallelic GPR56 mutations. Y and Z: T1W axial and sagittal sections. Pachygyria and perisylvian polymicrogyria in a girl with DYNC1H1 mutation. Asterisks in Y are located where there is maximum cortical thickening, in the posterior cortex. Asterisk in Z is located beneath a hypoplastic cerebellar vermis. AA: T2W axial section. Diffuse polymicrogyria in a boy with a GRIN2B mutation. BB: T1W axial section. Diffuse abnormality of the cortical pattern with smooth cortex and areas of abnormal infolding, suggestive of polymicrogyria in a boy with biallelic WDR62 mutations.
FIGURE 8.
FIGURE 8.
Main actors of synaptic transmission and mapping of the synaptic gene products causing synaptic encephalopathies with epilepsy. Schematic representation of a symbolic synapse containing excitatory and inhibitory synaptic components. The main targets of synaptopathies are as follows: 1) At the presynaptic level, gene products involved in the postdocking synaptic vesicle (SV) priming/fusion processes (SNAREs and SNARE-associated proteins: Munc-13, IM1, Munc-18, PRRT2, SNARE proteins, synaptotagmin-1/2, voltage-gated Ca2+ channels), SV trafficking (trafficking proteins: Synapsins I/II, vATPase, synaptophysin, SV2A, VAMP2, synaptojanin-1, AP-2, dynamin-1, TBC1D24), and neurotransmitter (NT) synthesis and loading into SVs (transport proteins: GAD1, vATPase). 2) At the postsynaptic level, postsynaptic receptors and their scaffold/transduction systems (GABAA and NMDA receptors, gephyrin, collybistin, PSD-95, Homer, Shank-3, SynGAP-1, DLG-1). 3) At the synaptic cleft level, transsynaptic and extracellular matrix proteins and their receptors (neurexin-1, neuroligin, IL1RAPL1, ADAM 22/23, LGI1), as well as secreted proteins (SRPX2, reelin). Other presynaptic voltage-gated channels that affect the dynamics of nerve terminal activation and NT release are also shown. Green: the actin-based cytoskeleton that regulates trafficking and maintenance of SV pool in the nerve terminal and concentrates postsynaptic receptors on the postsynaptic side.
FIGURE 9.
FIGURE 9.
Schematic representation of the mechanistic/mammalian target of rapamycin (mTOR) and autophagy intracellular cascades and their interrelationships. The complex regulatory cascade triggering the activation of the mTORC1 complex is initiated by extracellular signals (growth factors, neurotransmitter, hormones). To be activated, mTORC1 needs to bind to the organelle membrane, a process that depends on the active form of the small G protein Rheb and by the presence of a docking complex on the membrane formed by the guanine nucleotide exchange factor (GEF) Ragulator and an appropriate combination of GTP- and GDP-bound Rag G proteins. The membrane location of the latter complex depends on the presence of the vacuolar H+-adenosine triphosphatase (vATPase) on the membrane, which is favored by DMXL2. Since the small G proteins are the molecular switches for mTOR activation, they are also the targets of the 2 main upstream inhibitory complexes that act as GTPase activating proteins (GAPs), namely the TSC and Gator1 complexes that inactivate Rheb and Rags, respectively. These inhibitory TSC and Gator1 complexes are in turn subjected to inhibition by the phosphatidylinositol 3-kinase (PI3K)/AKT pathway, activated by extracellular signals and Gator 2, respectively, that therefore catalyze release of mTORC1 from inhibition. Activation of mTORC1 favors anabolism, protein synthesis, cell growth, and, in neurons, outgrowth of neuronal processes and formation of synaptic connections. On the other hand, activation of mTORC1 silences the autophagy chain by inhibiting the ULK1 complex, which is required to recruit the Beclin complex to the phagophore for its activation by AMPK. This results in the following steps of autophagy flux, including LC3 conversion and binding, formation of the autophagosome and subsequent fusion with lysosomes to form autolysosomes. In these processes, the proton gradient established by vATPase is essential, as well as the activity of accessory proteins such as DMXL2, EPG5, and SNX14.

References

    1. Stafstrom CE, Carmant L. Seizures and epilepsy: an overview for neuroscientists. Cold Spring Harb Perspect Med 5: a022426, 2015. doi: 10.1101/cshperspect.a022426. - DOI - PMC - PubMed
    1. Scheffer IE, Berkovic S, Capovilla G, Connolly MB, French J, Guilhoto L, Hirsch E, Jain S, Mathern GW, Moshé SL, Nordli DR, Perucca E, Tomson T, Wiebe S, Zhang YH, Zuberi SM. ILAE classification of the epilepsies: position paper of the ILAE Commission for Classification and Terminology. Epilepsia 58: 512–521, 2017. doi: 10.1111/epi.13709. - DOI - PMC - PubMed
    1. Cutri-French C, Armstrong D, Saby J, Gorman C, Lane J, Fu C, Peters SU, Percy A, Neul JL, Marsh ED. Comparison of core features in four developmental encephalopathies in the Rett Natural History Study. Ann Neurol 88: 396–406, 2020. doi: 10.1002/ana.25797. - DOI - PMC - PubMed
    1. McTague A, Howell KB, Cross JH, Kurian MA, Scheffer IE. The genetic landscape of the epileptic encephalopathies of infancy and childhood. Lancet Neurol 15: 304–316, 2016. doi: 10.1016/S1474-4422(15)00250-1. - DOI - PubMed
    1. Riney K, Bogacz A, Somerville E, Hirsch E, Nabbout R, Scheffer IE, et al. ILAE Classification and definition of epilepsy syndromes with onset at a variable age: position statement by the ILAE Task Force on Nosology and Definitions (Online). 2021. http://files/1501/Riney_VariableAges_7Apr21.pdf. - PubMed

Publication types