. 2022 Aug 11;20(8):e3001681.
doi: 10.1371/journal.pbio.3001681. eCollection 2022 Aug.

Host genotype controls ecological change in the leaf fungal microbiome

Affiliations

Host genotype controls ecological change in the leaf fungal microbiome

Acer VanWallendael et al. PLoS Biol. .

Abstract

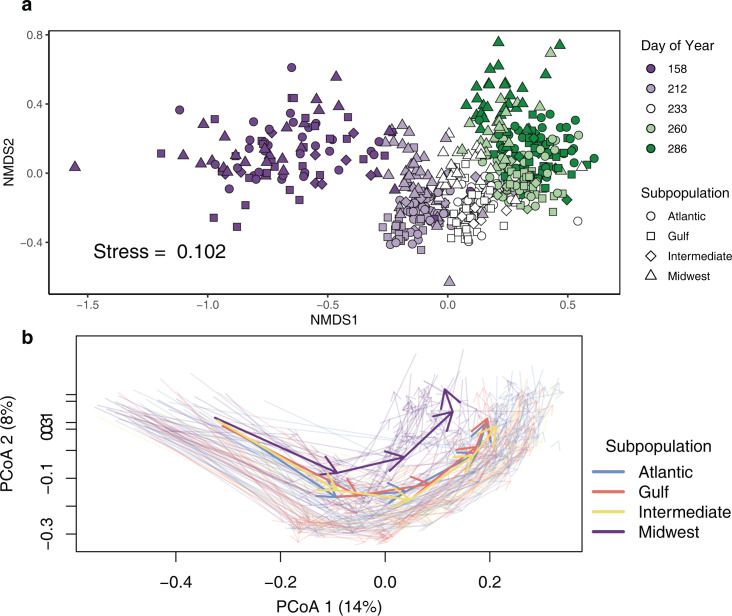
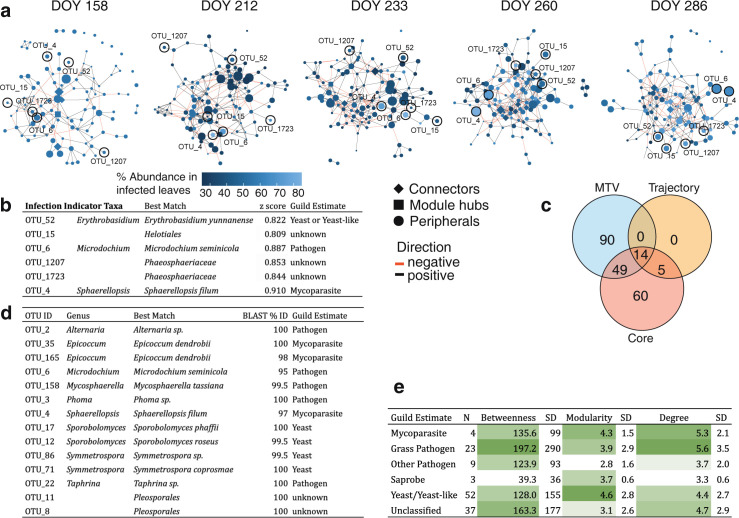
Leaf fungal microbiomes can be fundamental drivers of host plant success, as they contain pathogens that devastate crop plants and taxa that enhance nutrient uptake, discourage herbivory, and antagonize pathogens. We measured leaf fungal diversity with amplicon sequencing across an entire growing season in a diversity panel of switchgrass (Panicum virgatum). We also sampled a replicated subset of genotypes across 3 additional sites to compare the importance of time, space, ecology, and genetics. We found a strong successional pattern in the microbiome shaped both by host genetics and environmental factors. Further, we used genome-wide association (GWA) mapping and RNA sequencing to show that 3 cysteine-rich receptor-like kinases (crRLKs) were linked to a genetic locus associated with microbiome structure. We confirmed GWAS results in an independent set of genotypes for both the internal transcribed spacer (ITS) and large subunit (LSU) ribosomal DNA markers. Fungal pathogens were central to microbial covariance networks, and genotypes susceptible to pathogens differed in their expression of the 3 crRLKs, suggesting that host immune genes are a principal means of controlling the entire leaf microbiome.


Conflict of interest statement

The authors have declared that no competing interests exist.

Figures

Fig 1
Fig 1. Structural and successional change in the leaf phyllosphere community shown by 2 methods.
Each point represents an individual plant sampled from the experimental plot at KBS, Michigan. (A) NMDS. Dates are shown as DOY. Points are colored by DOY, and switchgrass subpopulations as shapes. (B) Trajectory plots of principal coordinates of community distances. Transparent arrows represent individual switchgrass genotypes sampled over the 5 dates shown in (A), and colors show genetic subpopulations. Solid colored arrows show mean subpopulation trajectories. Data underlying this figure can be found in S1 Data. DOY, day of year; KBS, Kellogg Biological Station; NMDS, nonmetric multidimensional scaling.
Fig 2
Fig 2. Site-specific changes in microbial communities shown by NMDS.
Genotypes were sampled at 4 sites. From north to south: KBS, Michigan; Columbia, Missouri; Austin, Texas; and Kingsville, Texas. Northern sites are shown by symbols, and southern by open shapes. Color indicates phenological stage sampled, “Early” samples were taken just after emergence, “Mid” samples were taken during seed development, and “Late” samples were taken after senescence began. Data underlying this figure can be found in S2 Data. NMDS, nonmetric multidimensional scaling.
Fig 3
Fig 3. Genetic and fungal community pairwise distance matrices at KBS, Michigan.
(A) Pairwise genetic distance (π) for all samples. Samples are ordered by hierarchical clustering. (B, C) Pairwise community distance (Bray–Curtis) for all samples, shown in the same order as genetic distances, for 2 sampling times, DOY 158 and DOY 260. Other sampling times shown in Supp. (D) Values of Mantel’s r shown indicate correlation between distance matrices for genetics and fungal communities at each time point, with subsetted subpopulations shown as faint lines. p < 0.01 for all tests in the combined populations. Data underlying this figure can be found in S3 Data. DOY, day of year; KBS, Kellogg Biological Station.
Fig 4
Fig 4. Genetic associations with microbiome structure.
(A) GWAs of microbiome structure (NMDS2 at DOY 260). The lower solid line shows the 5% FDR threshold, and the upper dashed line shows the Bonferroni-adjusted alpha threshold for SNPs associated with the microbiome. (B) Outlier region on Chromosome 2N with nearby genes shown in red. (C) Expression-level differences for genes shown in (B). Leaf tissue for these samples was collected as part of a different study, performed at 3 of the same sites we used. FPKM are scaled differently in each gene facet. Data underlying this figure can be found in S4 Data. DOY, day of year; FDR, false discovery rate; FPKM, fragments per kilobase of transcript per million mapped reads; GWA, genome-wide association; NMDS, nonmetric multidimensional scaling; SNP, single nucleotide polymorphism.
Fig 5
Fig 5. Network analysis of core OTUs.
(A) Covariance networks of core OTUs over time. Nodes are colored by each OTU’s relative abundance in infected leaves with visible symptoms. The shape of the node denotes network position, defined by Zi-Pi ratio. Edges are colored by the covariance sign. (B) Infection indicator taxa, including best taxonomic match and z-score for indicator analysis. (C) Number of OTUs identified as important by several methods: MTV-LMM analyses that indicate time-dependent OTUs, OTUs that impact the successional trajectory, and core OTUs with high occupancy-abundance. (D) Taxonomic information for the 14 OTUs identified in all 3 analyses in (C). Best match denotes the lowest taxonomic level confidently identified for each OTU using BLAST. Guilds were estimated based on published studies, references are in S1 Table. (E) Network statistics for fungal guilds, calculated as mean values across all time points, with (SD. Data underlying this figure can be found in S5 Data. DOY, day of year; MTV-LMM, microbial temporal variability mixed linear model; OTU, operational taxonomic unit; SD, standard deviation.

Comment in

References

    1. Spor A, Koren O, Ley R. Unravelling the effects of the environment and host genotype on the gut microbiome. Nat Rev Microbiol. 2011;9:279–90. doi: 10.1038/nrmicro2540 - DOI - PubMed
    1. Wagner MR, Lundberg DS, Del Rio TG, Tringe SG, Dangl JL, Mitchell-Olds T. Host genotype and age shape the leaf and root microbiomes of a wild perennial plant. Nat Commun. 2016;7:12151. doi: 10.1038/ncomms12151 - DOI - PMC - PubMed
    1. Costello EK, Stagaman K, Dethlefsen L, Bohannan BJM, Relman DA. The application of ecological theory toward an understanding of the human microbiome. Science. 2012;336:1255–62. doi: 10.1126/science.1224203 - DOI - PMC - PubMed
    1. Toju H, Vannette RL, Gauthier M-PL, Dhami MK, Fukami T. Priority effects can persist across floral generations in nectar microbial metacommunities. Oikos. 2018;127:345–52.
    1. Barton LL, McLean RJC. Environmental Microbiology and Microbial Ecology. John Wiley & Sons; 2019.

Publication types