. 2022 Aug 11;18(8):e1010317.
doi: 10.1371/journal.pcbi.1010317. eCollection 2022 Aug.

Spatiotemporal spread of Plasmodium falciparum mutations for resistance to sulfadoxine-pyrimethamine across Africa, 1990-2020

Affiliations

Spatiotemporal spread of Plasmodium falciparum mutations for resistance to sulfadoxine-pyrimethamine across Africa, 1990-2020

Jennifer A Flegg et al. PLoS Comput Biol. .

Abstract

Background: Sulfadoxine-pyrimethamine (SP) is recommended in Africa in several antimalarial preventive regimens including Intermittent Preventive Treatment in pregnant women (IPTp), Intermittent Preventive Treatment in infants (IPTi) and Seasonal Malaria Chemoprevention (SMC). The effectiveness of SP-based preventive treatments are threatened in areas where Plasmodium falciparum resistance to SP is high. The prevalence of mutations in the dihydropteroate synthase gene (pfdhps) can be used to monitor SP effectiveness. IPTi-SP is recommended only in areas where the prevalence of the pfdhps540E mutation is below 50%. It has also been suggested that IPTp-SP does not have a protective effect in areas where the pfdhps581G mutation, exceeds 10%. However, pfdhps mutation prevalence data in Africa are extremely heterogenous and scattered, with data completely missing from many areas.

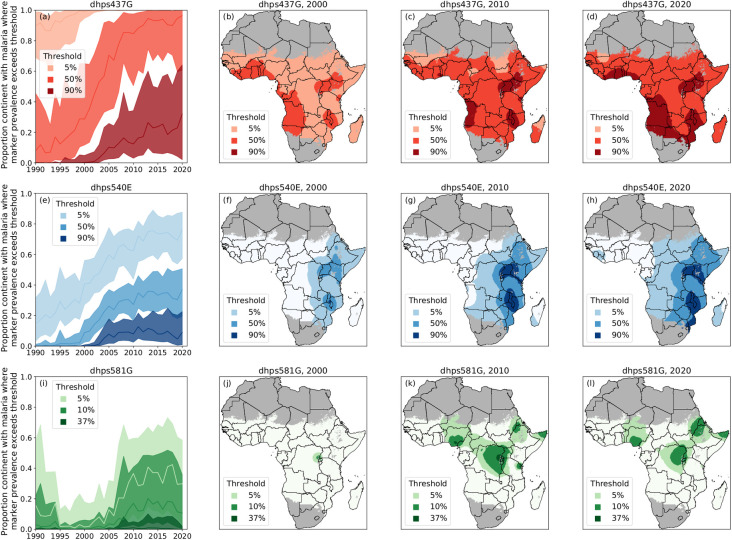
Methods and findings: The WWARN SP Molecular Surveyor database was designed to summarize dihydrofolate reductase (pfdhfr) and pfdhps gene mutation prevalence data. In this paper, pfdhps mutation prevalence data was used to generate continuous spatiotemporal surface maps of the estimated prevalence of the SP resistance markers pfdhps437G, pfdhps540E, and pfdhps581G in Africa from 1990 to 2020 using a geostatistical model, with a Bayesian inference framework to estimate uncertainty. The maps of estimated prevalence show an expansion of the pfdhps437G mutations across the entire continent over the last three decades. The pfdhps540E mutation emerged from limited foci in East Africa to currently exceeding 50% estimated prevalence in most of East and South East Africa. pfdhps540E distribution is expanding at low or moderate prevalence in central Africa and a predicted focus in West Africa. Although the pfdhps581G mutation spread from one focus in East Africa in 2000, to exceeding 10% estimated prevalence in several foci in 2010, the predicted distribution of the marker did not expand in 2020, however our analysis indicated high uncertainty in areas where pfdhps581G is present. Uncertainty was higher in spatial regions where the prevalence of a marker is intermediate or where prevalence is changing over time.

Conclusions: The WWARN SP Molecular Surveyor database and a set of continuous spatiotemporal surface maps were built to provide users with standardized, current information on resistance marker distribution and prevalence estimates. According to the maps, the high prevalence of pfdhps540E mutation was to date restricted to East and South East Africa, which is reassuring for continued use of IPTi and SMC in West Africa, but continuous monitoring is needed as the pfdhps540E distribution is expanding. Several foci where pfdhps581G prevalence exceeded 10% were identified. More data on the pfdhps581G distribution in these areas needs to be collected to guide IPTp-SP recommendations. Prevalence and uncertainty maps can be utilized together to strategically identify sites where increased surveillance can be most informative. This study combines a molecular marker database and predictive modelling to highlight areas of concern, which can be used to support decisions in public health, highlight knowledge gaps in certain regions, and guide future research.


Conflict of interest statement

The authors have declared that no competing interests exist.

Figures

Fig 1
Fig 1. Spatial locations and pfdhps mutation prevalence from collected data.
Summary of the spatial locations of the collected data and the prevalence for pfdhps437G (a), pfdhps540E (c) and pfdhps581G (e) across the African continent and the number of study sites per year during the time period 1980–2020 for pfdhps437G (b), pfdhps540E (d) and pfdhps581G (f). In (a), (c) and (e), the size of the dots is proportional to the study sample size and the colour is representative of the observed marker prevalence. National shapefiles were obtained from the Malaria Atlas Project (MAP; https://malariaatlas.org/) under their open access policy (https://malariaatlas.org/open-access-policy/) and no changes were made.
Fig 2
Fig 2. Posterior predictive median prevalence of pfdhps437G.
Posterior predictive median prevalence of pfdhps437G in 1990 (a), 2005 (c) and 2020 (e). Associated standard deviations (uncertainty) for pfdhps437G posterior predictions in 1990 (b), 2005 (d) and 2020 (f). A low standard deviation (lighter colour) indicates low uncertainty and high confidence in the model. National shapefiles were obtained from the Malaria Atlas Project (MAP; https://malariaatlas.org/) under their open access policy (https://malariaatlas.org/open-access-policy/) and no changes were made.
Fig 3
Fig 3. Posterior predictive median prevalence of pfdhps540E.
Posterior predictive median prevalence of pfdhps540E in 1990 (a), 2005 (c) and 2020 (e). Associated standard deviations (uncertainty) for pfdhps540E posterior predictions in 1990 (b), 2005 (d) and 2020 (f). A low standard deviation (lighter colour) indicates low uncertainty and high confidence in the model. National shapefiles were obtained from the Malaria Atlas Project (MAP; https://malariaatlas.org/) under their open access policy (https://malariaatlas.org/open-access-policy/) and no changes were made.
Fig 4
Fig 4. Posterior predictive median prevalence of pfdhps581G.
Posterior predictive median prevalence of pfdhps581G in 1990 (a), 2005 (c) and 2020 (e). Associated standard deviations (uncertainty) for pfdhps581G posterior predictions in 1990 (b), 2005 (d) and 2020 (f). A low standard deviation (lighter colour) indicates low uncertainty and high confidence in the model. National shapefiles were obtained from the Malaria Atlas Project (MAP; https://malariaatlas.org/) under their open access policy (https://malariaatlas.org/open-access-policy/) and no changes were made.
Fig 5
Fig 5. Predicted proportion of Africa that exceeds specific prevalence thresholds.
The proportion of the continent within the Pf spatial limits of Africa with pfdhps437G (a), pfdhps540E (e) and pfdhps581G (i) prevalence exceeding relevant thresholds over the time period of 1990 to 2020. The median estimates are shown in the solid-colored lines and the associated uncertainty (50% credible intervals) in the shaded regions. The predicted area with prevalence exceeding relevant thresholds shown in three shades, based on median predictions, for pfdhps437G (red), pfdhps540E (blue) and pfdhps581G (green) in 2000 ((b), (f), (j)), in 2010 ((c), (g), (k)), and 2020 ((d), (h), (l)). The predictive proportions displayed for pfdhps437G (red) and pfdhps540E (blue) are 90%, 50% and 5%. For pfdhps581G (green), present in lower prevalence, the proportions displayed are 37%, 10% and 5%. National shapefiles were obtained from the Malaria Atlas Project (MAP; https://malariaatlas.org/) under their open access policy (https://malariaatlas.org/open-access-policy/) and no changes were made.
Fig 6
Fig 6. Locations where pfdhps581G prevalence has exceeded 10%.
Observed prevalence of pfdhps581G is displayed for all years in sites where pfdhps581G prevalence was >10% at least one year, from 2005 to 2018.
Fig 7
Fig 7. Locations where pfdhps581G prevalence has exceeded 10% and data from three years are available.
Observed prevalence of pfdhps581G is displayed for all years in sites where pfdhps581G prevalence was >10% at least one year and data from at least three years were available, between 2010 to 2018. A statistically significant change in pfdhps581G prevalence in comparison to the first assessed year using Fisher’s exact test is displayed as * (P ≤ 0.05), ** (P ≤ 0.01) or *** (P ≤ 0.001).

References

    1. Ashley EA, Dhorda M, Fairhurst RM, Amaratunga C, Lim P, Suon S, et al.. Spread of artemisinin resistance in Plasmodium falciparum malaria. N Engl J Med. 2014;371: 411–423. doi: 10.1056/NEJMoa1314981 - DOI - PMC - PubMed
    1. Das S, Manna S, Saha B, Hati AK, Roy S. Novel pfkelch13 Gene Polymorphism Associates With Artemisinin Resistance in Eastern India. Clin Infect Dis. 2019;69: 1144–1152. doi: 10.1093/cid/ciy1038 - DOI - PubMed
    1. Das S, Saha B, Hati AK, Roy S. Evidence of Artemisinin-Resistant Plasmodium falciparum Malaria in Eastern India. N Engl J Med. 2018;379: 1962–1964. doi: 10.1056/NEJMc1713777 - DOI - PubMed
    1. Uwimana A, Legrand E, Stokes BH, Ndikumana J-LM, Warsame M, Umulisa N, et al.. Emergence and clonal expansion of in vitro artemisinin-resistant Plasmodium falciparum kelch13 R561H mutant parasites in Rwanda. Nat Med. 2020;26: 1602–1608. doi: 10.1038/s41591-020-1005-2 - DOI - PMC - PubMed
    1. Asua V, Conrad MD, Aydemir O, Duvalsaint M, Legac J, Duarte E, et al.. Changing Prevalence of Potential Mediators of Aminoquinoline, Antifolate, and Artemisinin Resistance Across Uganda. J Infect Dis. 2021;223: 985–994. doi: 10.1093/infdis/jiaa687 - DOI - PMC - PubMed

Publication types