. 2022 Aug 11;18(8):e1010303.
doi: 10.1371/journal.pgen.1010303. eCollection 2022 Aug.

Determining the stability of genome-wide factors in BMI between ages 40 to 69 years

Affiliations

Determining the stability of genome-wide factors in BMI between ages 40 to 69 years

Nathan A Gillespie et al. PLoS Genet. .

Abstract

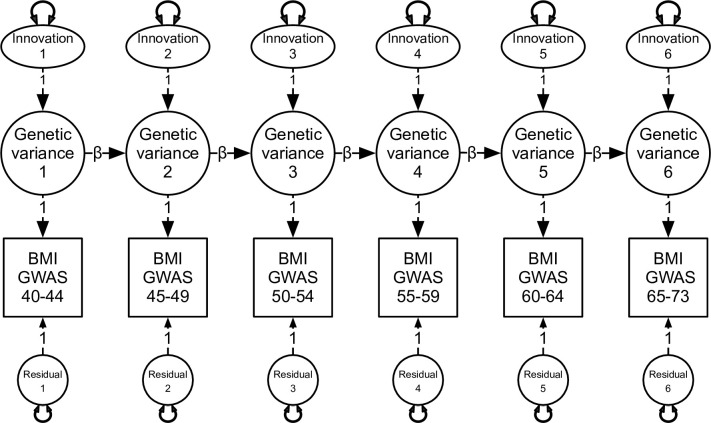
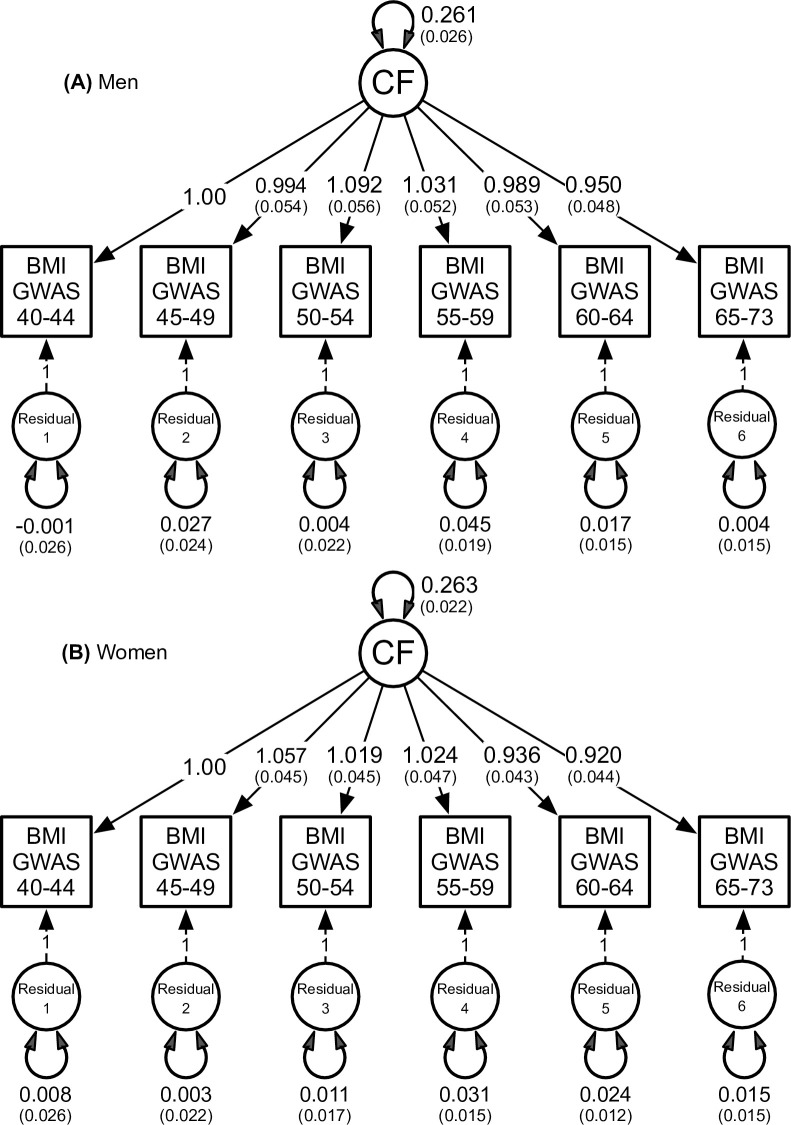
Genome-wide association studies (GWAS) have successfully identified common variants associated with BMI. However, the stability of aggregate genetic variation influencing BMI from midlife and beyond is unknown. By analysing 165,717 men and 193,073 women from the UKBiobank, we performed BMI GWAS on six independent five-year age intervals between 40 and 72 years. We then applied genomic structural equation modeling to test competing hypotheses regarding the stability of genetic effects for BMI. LDSR genetic correlations between BMI assessed between ages 40 to 73 were all very high and ranged 0.89 to 1.00. Genomic structural equation modeling revealed that molecular genetic variance in BMI at each age interval could not be explained by the accumulation of any age-specific genetic influences or autoregressive processes. Instead, a common set of stable genetic influences appears to underpin genome-wide variation in BMI from middle to early old age in men and women alike.


Conflict of interest statement

The authors have declared that no competing interests exist.

Figures

Fig 1
Fig 1. Autoregression model depicting genome-wide variation in BMI at each age interval.
This development model predicts that genetic variation at each time interval can be decomposed into time-specific variation or ‘innovations’ & the causal contribution of genome-wide genetic variation from previous age intervals. Innovations refer to novel or age-specific genetic influences that are uncorrelated with previous genetic influences. This model also includes residual genetic variation not otherwise explained by the autoregression process. Double-headed arrows denote variation associated with innovations & residuals at each age interval. Beta (β) denotes the causal contribution of genetic variance from one age interval to the next.
Fig 2
Fig 2. Best fitting factor analytic model with a single common factor (CF) based on the combined male and female data.
The CF explains covariation between the six GWAS summary statistics each based on five-year intervals between ages 40–73 years. To identify this model, the first factor loading from the CF to BMI GWAS at 40–45 years was constrained to one. The double-headed arrow on the CF denotes the standardized variance, or SNP-based heritability, for BMI. Double-headed arrows on the residuals denote genetic variation at each age interval not otherwise explained by the CF.
Fig 3
Fig 3
Best fitting factor analytic model with a single common factor (CF) for men (A) & women (B). To identify this model, the first factor loading from the CD to BMI GWAS at 40–45 years was constrained to one. The double-headed arrow on the CF denotes the standardized variance, or SNP-based heritability, for BMI. Double-headed arrows on the residuals denote genetic variation at each age interval not otherwise explained by the CF.

References

    1. MacArthur J, Bowler E, Cerezo M, Gil L, Hall P, Hastings E, et al.. The new NHGRI-EBI Catalog of published genome-wide association studies (GWAS Catalog). Nucleic Acids Res. 2017;45(D1):D896–D901. doi: 10.1093/nar/gkw1133 - DOI - PMC - PubMed
    1. Speliotes EK, Willer CJ, Berndt SI, Monda KL, Thorleifsson G, Jackson AU, et al.. Association analyses of 249,796 individuals reveal 18 new loci associated with body mass index. Nat Genet. 2010;42(11):937–48. doi: 10.1038/ng.686 - DOI - PMC - PubMed
    1. Lee SH, Wray NR, Goddard ME, Visscher PM. Estimating missing heritability for disease from genome-wide association studies. Am J Hum Genet. 2011;88(3):294–305. doi: 10.1016/j.ajhg.2011.02.002 - DOI - PMC - PubMed
    1. Kaur Y, Wang DX, Liu HY, Meyre D. s. Obesity reviews: an official journal of the International Association for the Study of Obesity. 2019;20(3):385–406. - PubMed
    1. Yang J, Bakshi A, Zhu Z, Hemani G, Vinkhuyzen AA, Lee SH, et al.. Genetic variance estimation with imputed variants finds negligible missing heritability for human height and body mass index. Nat Genet. 2015;47(10):1114–20. doi: 10.1038/ng.3390 - DOI - PMC - PubMed

Publication types