. 2023 Jan 15;207(2):193-205.
doi: 10.1164/rccm.202201-0144OC.

Forgiveness Is the Attribute of the Strong: Nonadherence and Regimen Shortening in Drug-sensitive Tuberculosis

Affiliations

Forgiveness Is the Attribute of the Strong: Nonadherence and Regimen Shortening in Drug-sensitive Tuberculosis

Helen R Stagg et al. Am J Respir Crit Care Med. .

Abstract

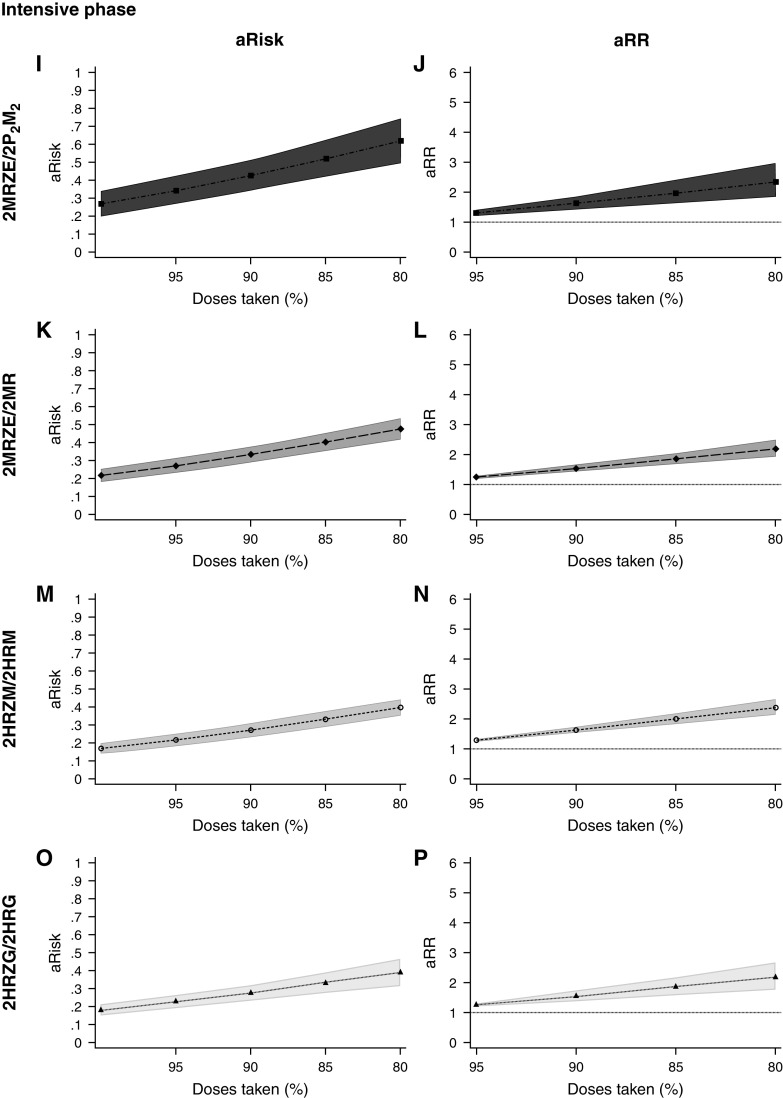
Rationale: "Forgiveness" charts the ability of a drug or regimen to withstand nonadherence without negative clinical consequences. Objectives: We aimed to determine the influence of regimen length, regimen drugs, and dosing, and when during treatment nonadherence occurs on the forgiveness of antituberculosis regimens. Methods: Using data from three randomized controlled trials comparing experimental 4-month regimens for drug-sensitive tuberculosis with the standard 6-month regimen, we used generalized linear models to examine how the risk of a negative composite outcome changed as dose-taking decreased. The percentage of doses taken and the absolute number of doses missed were calculated during the intensive and continuation phases of treatment, and overall. A mediation analysis was undertaken to determine how much the association between intensive phase dose-taking and the negative composite outcome was mediated through continuation phase dose-taking. Measurements and Main Results: Forgiveness of the 4- and 6-month regimens did not differ for any treatment period. Importantly, 4-month regimens were no less forgiving of small numbers of absolute missed doses than the 6-month regimen (e.g., for 3-7 missed doses vs. no missed doses [baseline], 6-month regimen adjusted risk ratio 1.65 [95% confidence interval, 0.80-3.41] and 4-month regimens 1.80 [1.33-2.45]). No 4-month regimen was conclusively more forgiving than another. We found evidence of mediation by continuation phase dose-taking on the intensive phase dose-taking and negative composite outcome relationship. Conclusions: With the current appetite for, and progress toward, shorter drug-sensitive tuberculosis regimens worldwide, we offer reassurance that shorter regimens are not necessarily less forgiving of nonadherence. Given the importance of continuation phase adherence, patient support during this period should not be neglected.

Keywords: adherence; forgiveness; nonadherence; treatment; tuberculosis.


Figures

Figure 1.
Figure 1.
Hypothesized mediation model. The total effect c of the exposure E (intensive phase percentage dose-taking) on the outcome O (negative composite outcome) is composed of direct and indirect effects. The direct effect c’ measures the extent to which the risk of the negative composite outcome changes when intensive phase percentage dose-taking alters by one unit but the mediator variable M (continuation phase percentage dose-taking) is fixed. The indirect effect, a combination of a and b, measures the extent to which the risk of the negative composite outcome changes when intensive phase percentage dose-taking is fixed, and continuation phase percentage dose-taking changes by the amount it would have changed had intensive phase percentage dose-taking altered by one unit.
Figure 2.
Figure 2.
Forgiveness of the 4- versus 6-month regimens. Adjusted marginal risks (A, D, and G), risk ratios (B, E, and H), and risk differences (C, F, and I) for the negative composite outcome by the percentage of doses taken (modeled as fractional polynomials of the functional form x3) across the entire treatment period (overall, [AC]), intensive phase (DF), and continuation phase (GI) presented stratified by regimens grouped by length. One model per period of treatment, 4- and 6-month regimens in the same model. The baseline for the multiplicative and additive models is 100% of doses taken. For the multiplicative models, Wald P values for interaction between regimens grouped by length and percentage of doses taken, all P < 0.0001; horizontal dotted line charts a risk ratio of 1. For the additive models, Wald P values for interaction between regimens grouped by length and percentage of doses taken were 0.06 (overall), 0.06 (intensive phase), and 0.07 (continuation phase); horizontal dotted line charts a risk difference of 0. All models adjusted for sex, age (fitted using a fractional polynomial), ethnicity, HIV and CD4 status, smear status at baseline (most severe), cavitation at baseline, and a three-degree fixed-effect for trial. All models contain data for 3,180 participants. Data presented for 80–100% of doses taken because of data sparsity at lower degrees, but the full range of values was included in the statistical models. Panels (A and B) from model 3; (C) from model 4; (D and E) from model 7; (F) model 8; (G and H) from model 11; and (I) model 12. aRD = adjusted risk difference; aRisk = adjusted risk; aRR = adjusted risk ratio; CI = confidence interval.
Figure 3.
Figure 3.
Forgiveness of different 4-month regimens. Adjusted risks (A, C, E, G, I, K, M, O, Q, S, U, and W) and risk ratios (B, D, F, H, J, L, N, P, R, T, V, and X) for the negative composite outcome by the percentage of doses taken (modeled as fractional polynomials of the functional form x3) across the entire treatment period (AH), intensive phase (IP), and continuation phase (QX), stratified by 4-month regimen. The baseline for multiplicative and additive models is 100% dose-taking. One model per period of treatment, all 4-month regimens in the same model. For the multiplicative models, Wald P values for interaction between regimens grouped by length and percentage of doses taken were 0.10 (overall), 0.76 (intensive phase), and 0.004 (continuation phase); horizontal dotted line charts a risk ratio of 1. For the additive models, Wald P values for interaction between regimens grouped by length and percentage of doses taken were 0.84 (overall), 0.50 (intensive phase), and 0.004 (continuation phase); horizontal dotted line charts a risk difference of 0. Models adjusted for sex, age (fitted using a fractional polynomial), ethnicity, HIV and CD4 status, smear status at baseline (most severe), and cavitation at baseline. No adjustment for study because of collinearity with the regimen. Models contain data for 1,837 participants. Data presented for 80–100% of doses taken because of data sparsity at lower degrees, but the full range of values was included in the statistical models. Overall treatment from model 34; intensive phase from model 37; continuation phase from model 40. 2 = twice weekly dosing; aRisk = adjusted risk; aRR = adjusted risk ratio; CI = confidence interval; E = ethambutol; G = gatifloxacin; H = isoniazid; M = moxifloxacin; P = rifapentine; R = rifampicin; Z = pyrazinamide.
Figure 3.
Figure 3.
Forgiveness of different 4-month regimens. Adjusted risks (A, C, E, G, I, K, M, O, Q, S, U, and W) and risk ratios (B, D, F, H, J, L, N, P, R, T, V, and X) for the negative composite outcome by the percentage of doses taken (modeled as fractional polynomials of the functional form x3) across the entire treatment period (AH), intensive phase (IP), and continuation phase (QX), stratified by 4-month regimen. The baseline for multiplicative and additive models is 100% dose-taking. One model per period of treatment, all 4-month regimens in the same model. For the multiplicative models, Wald P values for interaction between regimens grouped by length and percentage of doses taken were 0.10 (overall), 0.76 (intensive phase), and 0.004 (continuation phase); horizontal dotted line charts a risk ratio of 1. For the additive models, Wald P values for interaction between regimens grouped by length and percentage of doses taken were 0.84 (overall), 0.50 (intensive phase), and 0.004 (continuation phase); horizontal dotted line charts a risk difference of 0. Models adjusted for sex, age (fitted using a fractional polynomial), ethnicity, HIV and CD4 status, smear status at baseline (most severe), and cavitation at baseline. No adjustment for study because of collinearity with the regimen. Models contain data for 1,837 participants. Data presented for 80–100% of doses taken because of data sparsity at lower degrees, but the full range of values was included in the statistical models. Overall treatment from model 34; intensive phase from model 37; continuation phase from model 40. 2 = twice weekly dosing; aRisk = adjusted risk; aRR = adjusted risk ratio; CI = confidence interval; E = ethambutol; G = gatifloxacin; H = isoniazid; M = moxifloxacin; P = rifapentine; R = rifampicin; Z = pyrazinamide.
Figure 4.
Figure 4.
Forgiveness during each treatment phase. To compare forgiveness during the two treatment phases, intensive phase and continuation phase percentage dose-taking were categorized into 0–95% versus >95%–100% (baseline) and adjusted risk ratios calculated for (A) the 6-month regimen and (B) the 4-month regimens, as follows: 1) intensive phase dose-taking was the exposure and continuation phase dose-taking the outcome (models 51 and 52); 2) continuation phase dose-taking was the exposure and the negative composite outcome the outcome (models 53, 55, 57, 59, 61, 63, 65, and 67); and 3) intensive phase dose-taking was the exposure and negative composite outcome the outcome (models 43, 45, 47, and 49). Results from models 1) and 3) are presented without (*) and with (**) adjustment for dose-taking during the other treatment phase, assuming no interaction. For model 2), results are also presented with (^) adjustment for culture status at 2 months. Models adjusted for sex, age (fitted using a fractional polynomial), ethnicity, HIV and CD4 status, smear status at baseline (most severe), cavitation at baseline, and a three-degree fixed-effect for trial. aRR = adjusted risk ratio; CI = confidence interval.

Comment in

  • To Err Is Human, to Forgive Is Pharmacodynamic.
    Phillips PPJ, Stout JE. Phillips PPJ, et al. Am J Respir Crit Care Med. 2023 Jan 15;207(2):127-129. doi: 10.1164/rccm.202208-1629ED. Am J Respir Crit Care Med. 2023. PMID: 36165624 Free PMC article. No abstract available.

References

    1. Iseman MD. Tuberculosis therapy: past, present and future. Eur Respir J Suppl . 2002;36:87s–94s. - PubMed
    1. Lee A, Xie YL, Barry CE, Chen RY. Current and future treatments for tuberculosis. BMJ . 2020;368:m216. - PubMed
    1. Dorman SE, Nahid P, Kurbatova EV, Phillips PPJ, Bryant K, Dooley KE, et al. AIDS Clinical Trials Group; Tuberculosis Trials Consortium Four-month rifapentine regimens with or without moxifloxacin for tuberculosis. N Engl J Med . 2021;384:1705–1718. - PMC - PubMed
    1. Zumla AI, Gillespie SH, Hoelscher M, Philips PP, Cole ST, Abubakar I, et al. New antituberculosis drugs, regimens, and adjunct therapies: needs, advances, and future prospects. Lancet Infect Dis . 2014;14:327–340. - PubMed
    1. Munro SA, Lewin SA, Smith HJ, Engel ME, Fretheim A, Volmink J. Patient adherence to tuberculosis treatment: a systematic review of qualitative research. PLoS Med . 2007;4:e238. - PMC - PubMed

Publication types

MeSH terms

Substances