. 2022 Aug 18;185(17):3232-3247.e18.
doi: 10.1016/j.cell.2022.06.048. Epub 2022 Aug 10.

Epigenetic reader SP140 loss of function drives Crohn's disease due to uncontrolled macrophage topoisomerases

Affiliations

Epigenetic reader SP140 loss of function drives Crohn's disease due to uncontrolled macrophage topoisomerases

Hajera Amatullah et al. Cell. .

Abstract

How mis-regulated chromatin directly impacts human immune disorders is poorly understood. Speckled Protein 140 (SP140) is an immune-restricted PHD and bromodomain-containing epigenetic "reader," and SP140 loss-of-function mutations associate with Crohn's disease (CD), multiple sclerosis (MS), and chronic lymphocytic leukemia (CLL). However, the relevance of these mutations and mechanisms underlying SP140-driven pathogenicity remains unexplored. Using a global proteomic strategy, we identified SP140 as a repressor of topoisomerases (TOPs) that maintains heterochromatin and macrophage fate. In humans and mice, SP140 loss resulted in unleashed TOP activity, de-repression of developmentally silenced genes, and ultimately defective microbe-inducible macrophage transcriptional programs and bacterial killing that drive intestinal pathology. Pharmacological inhibition of TOP1/2 rescued these defects. Furthermore, exacerbated colitis was restored with TOP1/2 inhibitors in Sp140-/- mice, but not wild-type mice, in vivo. Collectively, we identify SP140 as a TOP repressor and reveal repurposing of TOP inhibition to reverse immune diseases driven by SP140 loss.

Keywords: Crohn’s disease; PHD; SP140; Speckled Protein; bromodomain; chromatin; epigenetic reader; inflammatory bowel disease; macrophages; topoisomerase.


Conflict of interest statement

Declaration of interests K.L.J. and H.A. are employees and shareholders of Moderna Inc., 200 Technology Square, Cambridge, MA 02138, since November 2021 and May 2022, respectively, after the time that this research was conducted. K.L.J. is a member of the scientific advisory board for Ancilia Biosciences. None of these relationships influenced the work in this study.

Figures

Figure 1.
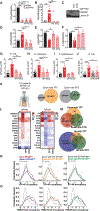
Figure 1.. SP140 interactome includes DNA unwinding and chromatin remodeling proteins, including topoisomerases
(A) Schematic of SP140 protein domains. SP140-interacting proteins identified using mass spectrometry (MS) of HEK293T nuclear lysates overexpressing FLAG-SP140 plotted as log2-fold change (over FLAG empty vector control) versus significance analysis of interactome (SAINT) values. SAINT score ε 0.99 and FC > 2 is indicated above the red line. Data are generated from n = 2. (B) Visual representation of SP140 interacting proteins (with SAINT score ε 0.99 and FC > 2) using k-means clustering on STRING database (https://string-db.org/). (C) Immunoprecipitation (IP) of FLAG-EV and FLAG-SP140 and immunoblot for endogenous topoisomerase I (TOP1), topoisomerase II alpha (TOP2A) and beta (TOP2B), DNA-dependent protein kinase (DNA-PK) facilitates chromatin transaction (FACT) complex subunit SPT16 (SUPT16H), FACT complex subunit SSRP1 (SSRP1), and SWI/SNF-related matrix-associated actin-dependent regulator of chromatin subfamily A member 5 (SMARCA5) in HEK293T nuclear lysates. Lamin B is loading control. (D) IP of endogenous SP140 and immunoblot for indicated endogenous proteins in human THP1 monocyte nuclear lysates. (E) IP of FLAG-SP140 or FLAG-SP140 mutants lacking reader modules SAND (SP140ΔSAND), plant homeobox domain (PHD, SP140ΔPHD), or bromodomain (SP140ΔBRD) and immunoblot for indicated endogenous proteins in HEK293T nuclear lysates. (F) Mass spectrometry identification of SP140 interactors in patient-derived lymphoblastoid cell lines (LBL) with wild-type SP140 (SP140wt) and SP140 Crohn’s disease (CD)-risk SP140 mutations (SP140mut). Data are fold change of endogenous SP140 IP mass spectrometry (MS) peptide hits over IgG IP control. All proteins identified are in Figure S6. (G) IP of endogenous SP140 and immunoblot for indicated proteins in LBL nuclear lysates with indicated SP140 genotypes. (C–E) are representative of 3 experiments, (F) is mean of two biological replicates of each SP140 genotype, and (G) is representative of 2 experiments.
Figure 2.
Figure 2.. SP140 is a suppressor of topoisomerases TOP1 and TOP2
(A) Left, schematic of topoisomerase 1 (TOP1) activity assay using migration and quantification of supercoiled (sc) and relaxed (rel) DNA following incubation of TOP1 with supercoiled pHOT DNA. Right, representative gel image and quantification of recombinant TOP1 activity (10 activity units, ~120 ng) in the presence of indicated concentrations of recombinant full length SP140. (B) Left, schematic of topoisomerase 2 (TOP2) activity assay using migration and quantification of catenated (ct) and decatenated (dct) DNA following incubation of TOP2A with catenated DNA. Right, representative image and quantification of recombinant TOP2A (8 activity units, ~110 ng) activity in the presence of indicated concentrations of recombinant full length SP140. Linear DNA (lin) serves as an assay control. (C) Representative gel image and quantification of TOP1 activity assay in nuclear lysates from control (black bars) or siRNA-mediated SP140 knockdown (KD, red bars) naive or LPS (100 ng/mL, 4 h)-stimulated THP1 monocytes. (D) Immunoblot of SP140 and TOP1 in control or SP140 siRNA-mediated knockdown THP1 monocytes. (E) Representative gel image and quantification of TOP1 activity assay in nuclear lysates from control (black circles) or SP140 KD (red circles) naive or LPS (100 ng/mL, 4 h)-stimulated primary human peripheral blood-derived macrophages. Connecting lines indicate individual healthy blood donors. (F) Immunoblot of SP140 and TOP1 in control or SP140 siRNA-mediated knockdown primary human macrophage nuclear lysates. (G) Representative gel image and quantification of TOP1 activity assay in nuclear lysates from HEK293T cells transfected with indicated concentrations of FLAG empty vector (EV, black bars) or FLAG-SP140 (blue bars) or treated with Topotecan (TPT, 100 μM). (H) Immunoblot of FLAG and TOP1 in HEK293T nuclear lysates transfected with indicated concentrations of FLAG empty vector (EV) and FLAG-SP140 (μg). (I) Representative gel image and quantification of TOP1 activity assay in lymphoblastoid cell lines (LBL) bearing wild-type SP140 (SP140wt) or CD-risk SP140 genetic variants (SP140mut) in the presence or absence of TPT (100 μM). (J) Immunoblot of SP140 and TOP1 in lymphoblastoid cell lines (LBL) with wild-type SP140 (SP140wt) or Crohn’s disease (CD)-risk SP140 mutations (SP140mut). Lamin B is loading control. Errors bars are SEM. *p < 0.05, **p < 0.01, ***p < 0.001; two-tailed, unpaired t test.
Figure 3.
Figure 3.. Loss-of-function SP140 or SP140 deletion increases DNA double-strand breaks on heterochromatin
(A–C) Quantification of DNA double-stranded breaks as assessed by γH2AX (phospho S139) in (A), vector control or Sp140 CRISPR-deleted Sp140 Cas9 transgenic immortalized mouse bone marrow macrophages (BMDMs) using two separate guide (g)RNAs (B), control, or SP140 siRNA-mediated knockdown THP1 cells or (C), race- and sex-matched lymphoblastoid B cell lines (LBLs) bearing wild-type SP140 (SP140wt) or SP140 disease-risk mutations (SP140mut) by flow cytometry. Mean and SEM. γH2AX% positive cells are indicated in histogram gates, adjacent graphs are (Γ)H2AX geometric mean relative to control. (D and E) (D) Cell localization of γH2AX in vector control or Sp140 CRISPR-deleted Sp140 Cas9 transgenic immortalized mouse bone marrow macrophages (BMDMs) or (E), control or SP140 siRNA-mediated knockdown THP1 cells as assessed by confocal microscopy. Scale bars, 5 μm. Line plots are the average quantification of γH2AX fluorescence intensity across the nuclear diameter (p = periphery, c = center) of 25 cells using ImageJ. (F) γH2AX chromatin immunoprecipitation quantitative PCR (ChIP qPCR) of HOXA7, HOXB9, FOXB1, or ACTB in control (black) and SP140 knockdown (red) primary human macrophages, represented as % of input and normalized to siCon of each blood donor. IgG ChIP served as a negative control. (G) Co-immunoprecipitation of FLAG SP140 and endogenous TOP1 and TOP2A in HEK293T cells treated with GSK343 (2.5 μM).
Figure 4.
Figure 4.. SP140 shields topoisomerases 1 and 2 from heterochromatin
(A) Left, schematic of chromatin fractionation protocol. Right, immunoblot of soluble nuclear (SN) fraction and chromatin fractions isolated from nuclei of FLAG EV, FLAG SP140 overexpressing HEK293T cells lysed with indicated concentrations of NaCl. (B) Heatmaps of TOP1 (purple) or TOP2 (orange) CUT&Tag peaks in transcriptional start site (TSS) proximal regions (TSS ± 5 kb) in control or SP140-knockdown primary human macrophages rank-ordered by occupancy in control. (C and D) (C) H3K27me3 density (log2 scale), as determined by multiplexed indexed chromatin immunoprecipitation (MintChIP) at TSS-proximal regions (TSS ± 3 kb) of genes that significantly increased TOP1 (purple) or (D), TOP2 (orange) occupancy in SP140 knockdown human macrophages compared with genomic control (gray). RPKM, reads per kilobase, per million mapped reads. (E) CUT&Tag genomic tracks of TOP1 (purple) and TOP2A (orange) densities at HOXA7 and FOXF1 in control and SP140 knockdown primary human macrophages. (F and G) (F) Gene ontology biological processes or (G) epigenomics roadmap signature of loci that gained TOP1 occupancy in SP140 knockdown primary human macrophages (fold-change > 2, FDR < 0.01) as assessed by CUT&Tag. (H and I) (H) Gene ontology biological processes or (I) epigenomics roadmap signature of genes that gained TOP2A occupancy in SP140 knockdown primary human macrophages (fold-change > 2, FDR < 0.01) as assessed by CUT&Tag. *p < 0.05. Data are mean of 3–4 biological replicates. Error bars are SEM. *p < 0.05; two-tailed, unpaired t test.
Figure 5.
Figure 5.. TOP inhibitors rescue defective innate immune transcriptional programs in SP140 loss-of-function Crohn’s disease patients
(A–F) (A) Levels of SP140, (B and C) HOXA9, (D) PAX5, (E) IL6, and (F) IL12B in control (black) and SP140 knockdown (red) primary human macrophages from healthy donors in the absence or presence of topoisomerase I inhibitor, Topotecan (TPT, 100 nM) or topoisomerase II inhibitor, Etoposide (ETO, 25 μM) as assessed by quantitative PCR or western blot. Data are normalized to DMSO siControl of each human blood donor. Lamin B is loading control. Data are mean of three biological replicates. Error bars are SEM. *p < 0.05, **p < 0.01; one-way ANOVA with Tukey’s multiple comparisons test. (G–I) (G) Gentamicin protection assay on control or SP140 siRNA-mediated knockdown primary human macrophages treated with TPT (100 nM) or ETO (25 μM) and spin-infected with Crohn’s disease-associated Escherichia coli (E. coli, 10 CFU/cell), (H) Citrobacter rodentium (C. rodentium, 10 CFU/cell), or (I) Salmonella enterica serovar typhimurium (S. typhimurium, 10 CFU/cell). (J) Gentamicin protection assay of control, SP140 siRNA-mediated knockdown or SP140/HOXA9 double knockdown primary human macrophages infected with E. coli (E. coli, 10 CFU/cell). Each dot is the average of a technical triplicate per individual blood donor. Error bars are SEM. *p < 0.05, **p < 0.01; one-way ANOVA with Tukey’s multiple comparisons test. (K) Fresh peripheral blood mononuclear cells (PBMCs) were obtained from CD patients carrying wild-type SP140 (SP140wt) or were homozygous for SP140 disease-associated mutations (SP140mut). Venn diagram of downregulated genes (fold change, FC > 2) in CD patient SP140wt (gray) or SP140mut PBMCs by Topotecan (TPT, 100 nM, orange) or Etoposide (ETO, 25 μM, green) as determined by RNA-seq. (L) Heatmap of expression changes (log2 FC) among top 15 differentially expressed genes in SP140mut compared with SP140wt that were rescued with TPT or ETO in LPS (100 ng/mL, 4 h)-stimulated PBMCs. (M) Venn diagram of up or downregulated genes (log2FC > 1) in CD patient SP140mut PBMCs compared with SP140wt which were reversed by log2FC > 1 with TPT or ETO. (N and O) (N) Distribution (probability density function) of levels of SP140 enrichment (human macrophage ChIP-seq12) or (O) H3K27me3 (average of ENCODE data ENCSR553XBX, ENCSR866UQO, and ENCSR390SFH) in the TSS-proximal region for all genes (gray) compared with genes that were upregulated (red) or downregulated (blue) in SP140mut PBMCs compared with SP140wt PBMCs or TPT-(orange) or ETO-downregulated (green) genes in SP140wt or SP140mut PBMCs.
Figure 6.
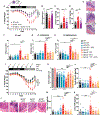
Figure 6.. Precision rescue of DSS colitis in Sp140 knockout mice with TOP inhibition
(A) Daily body weight measurements after 2.5% DSS administration in drinking water for 7 days followed by water administration to wild type (WT), Sp140−/−, or Sp140−/− mice administered WT bone marrow-derived macrophages (Mϕ, 1 3 106, i.v. 1 day prior and 4 days after DSS commencement). (B) Colon length at baseline or day 12 of DSS. (C and D) (C) Interleukin (IL)-6 or (D) TNF levels in day 12 colonic explant supernatants cultured for 24 h. (E) Representative hematoxylin and eosin (H&E) staining of distal colon sections of WT, Sp140−/−, and WT Mϕ > Sp140−/− mice at day 12. Scale bars, 100 μm. (F–H) (F) Gentamicin protection assay using wild type (WT) or SP140 CRISPR-deleted (Sp140−/−) bone-marrow-derived macrophages treated with TPT (100 nM) or ETO (25 μM) and spin-infected with Crohn’s disease-associated Escherichia coli (E. coli, 10 CFU/cell), (G) Citrobacter rodentium (C. rodentium, 10 CFU/cell), or (H) Salmonella enterica serovar typhimurium (S. typhimurium, 10 CFU/cell). Each dot is the average of a technical triplicate per individual mouse. Error bars are SEM. *p < 0.05, **p < 0.01; one-way ANOVA with Tukey’s multiple comparisons test. (I) Daily body weight measurements in WT and Sp140−/− mice after 2.5% DSS administration in drinking water for 7 days followed by water and intraperitoneal (i.p.) administration of DMSO control, TPT (1 mg/kg), ETO (1 mg/kg), or TPT+ETO (1 mg/kg + 1 mg/kg) every other day as indicated with black arrow. (J) Representative hematoxylin and eosin (H&E) staining of distal colon sections of WT and Sp140−/− with and without inhibitors in mice at day 12. Scale bars, 100 μm. (K) Colon length at baseline or day 12 of DSS. (L) Fecal lipocalin-2 (Lcn-2) content at day 9 of DSS. (M and N) (M) Interleukin(IL)-6 or (N) TNF levels in day 12 colonic explant supernatants cultured for 24 h. *p < 0.05, **p < 0.01, ***p < 0.001, ****p < 0.0001; one-way ANOVA with Tukey’s multiple comparisons test.

References

    1. Abramson J, Giraud M, Benoist C, and Mathis D (2010). Aire’s partners in the molecular control of immunological tolerance. Cell 140, 123–135. - PubMed
    1. Alenghat T, Osborne LC, Saenz SA, Kobuley D, Ziegler CG, Mullican SE, Choi I, Grunberg S, Sinha R, Wynosky-Dolfi M, et al. (2013). Histone deacetylase 3 coordinates commensal-bacteria-dependent intestinal homeostasis. Nature 504, 153–157. - PMC - PubMed
    1. Amatullah H, and Jeffrey KL (2020). Epigenome-metabolome-microbiome axis in health and IBD. Curr. Opin. Microbiol 56, 97–108. - PMC - PubMed
    1. Anders S, Pyl PT, and Huber W (2015). HTSeq–a Python framework to work with high-throughput sequencing data. Bioinformatics 31, 166–169. - PMC - PubMed
    1. Andersen FF, Tange TØ, Sinnathamby T, Olesen JR, Andersen KE, Westergaard O, Kjems J, and Knudsen BR (2002). The RNA splicing factor ASF/SF2 inhibits human topoisomerase I mediated DNA relaxation. J. Mol. Biol 322, 677–686. - PubMed

Publication types