. 2022 Aug 17;110(16):2646-2663.e6.
doi: 10.1016/j.neuron.2022.06.022. Epub 2022 Aug 10.

Single-cell transcriptome analysis of regenerating RGCs reveals potent glaucoma neural repair genes

Affiliations

Single-cell transcriptome analysis of regenerating RGCs reveals potent glaucoma neural repair genes

Liang Li et al. Neuron. .

Abstract

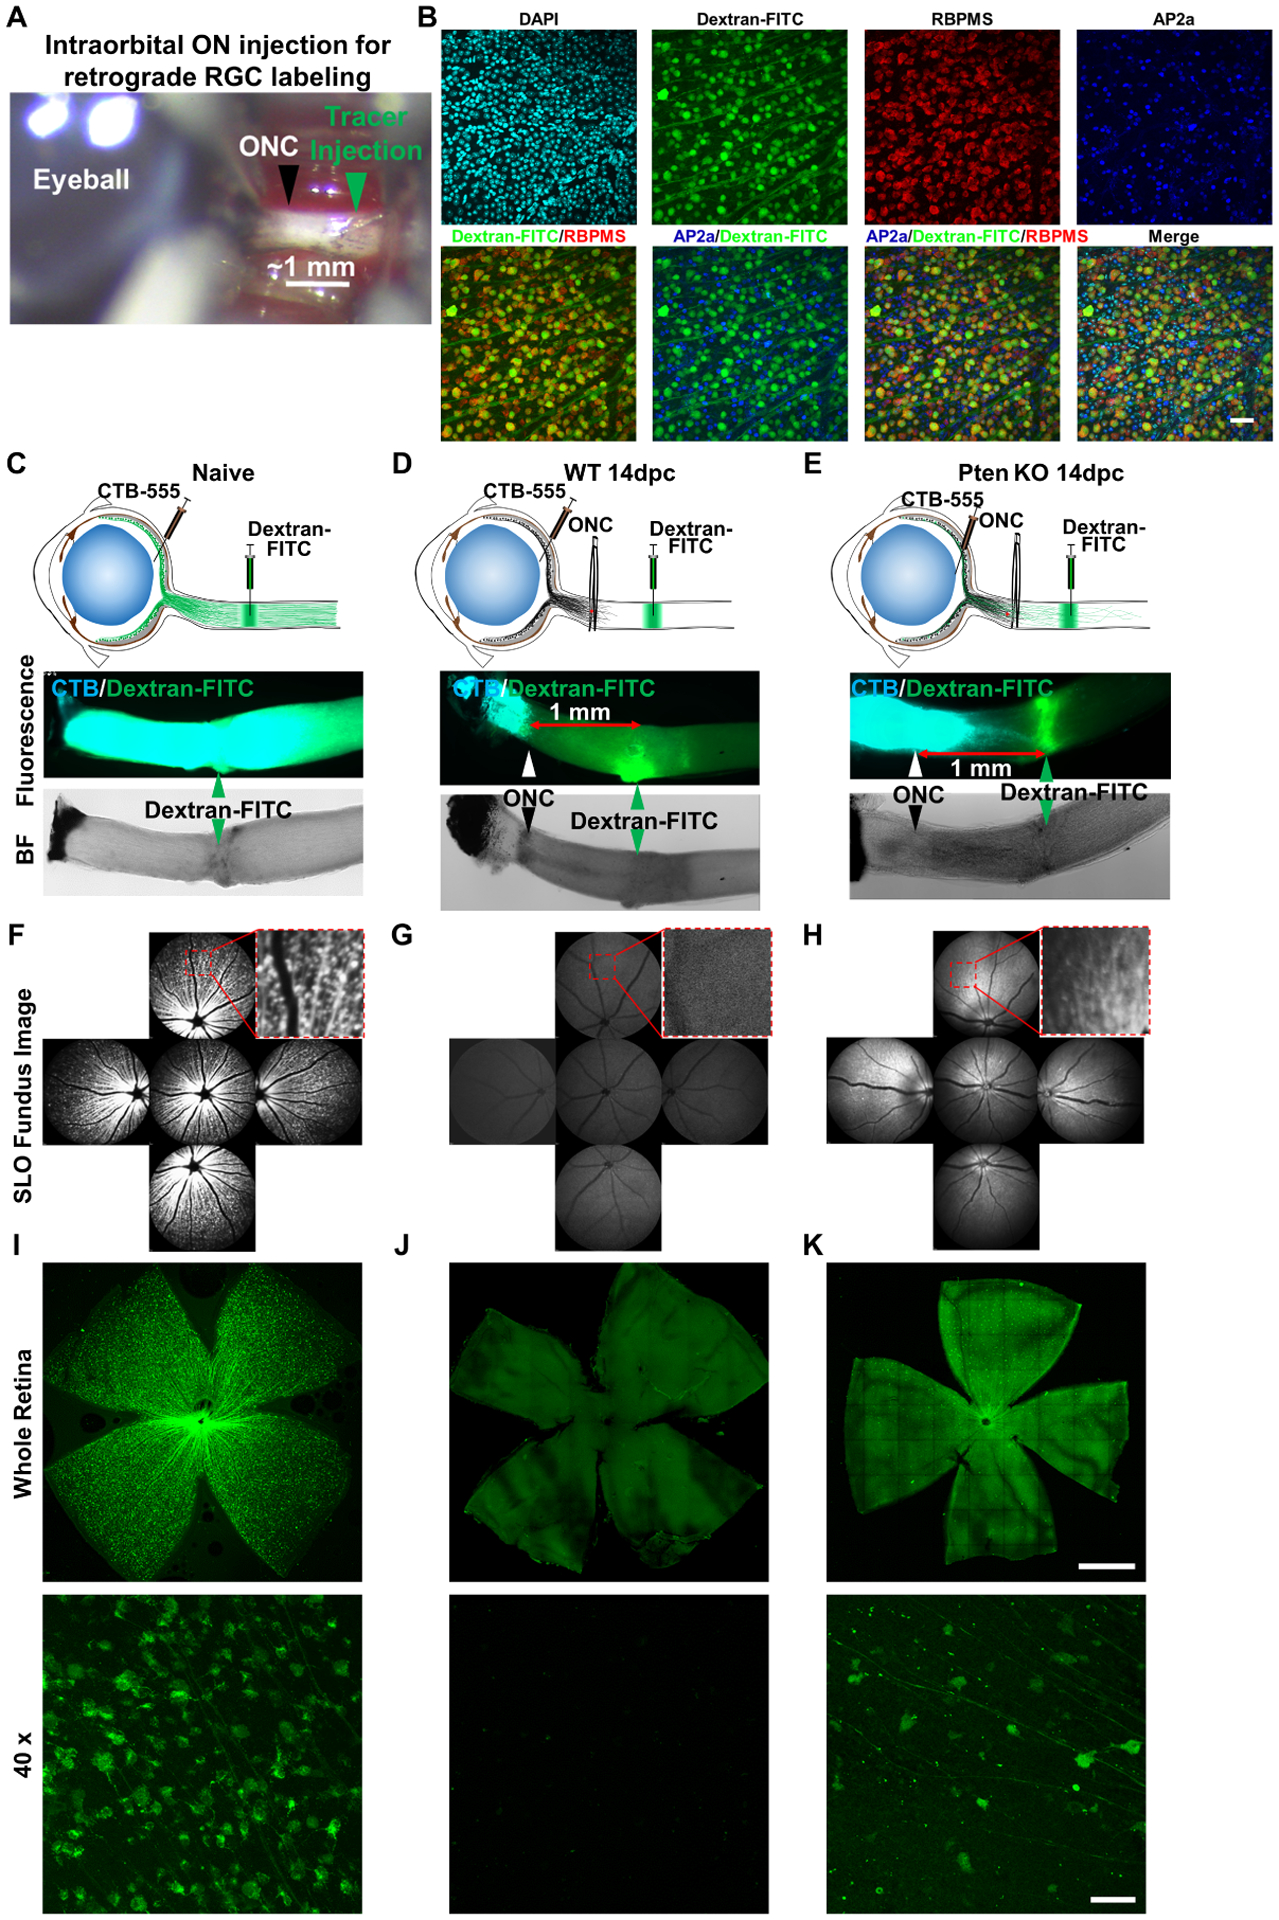
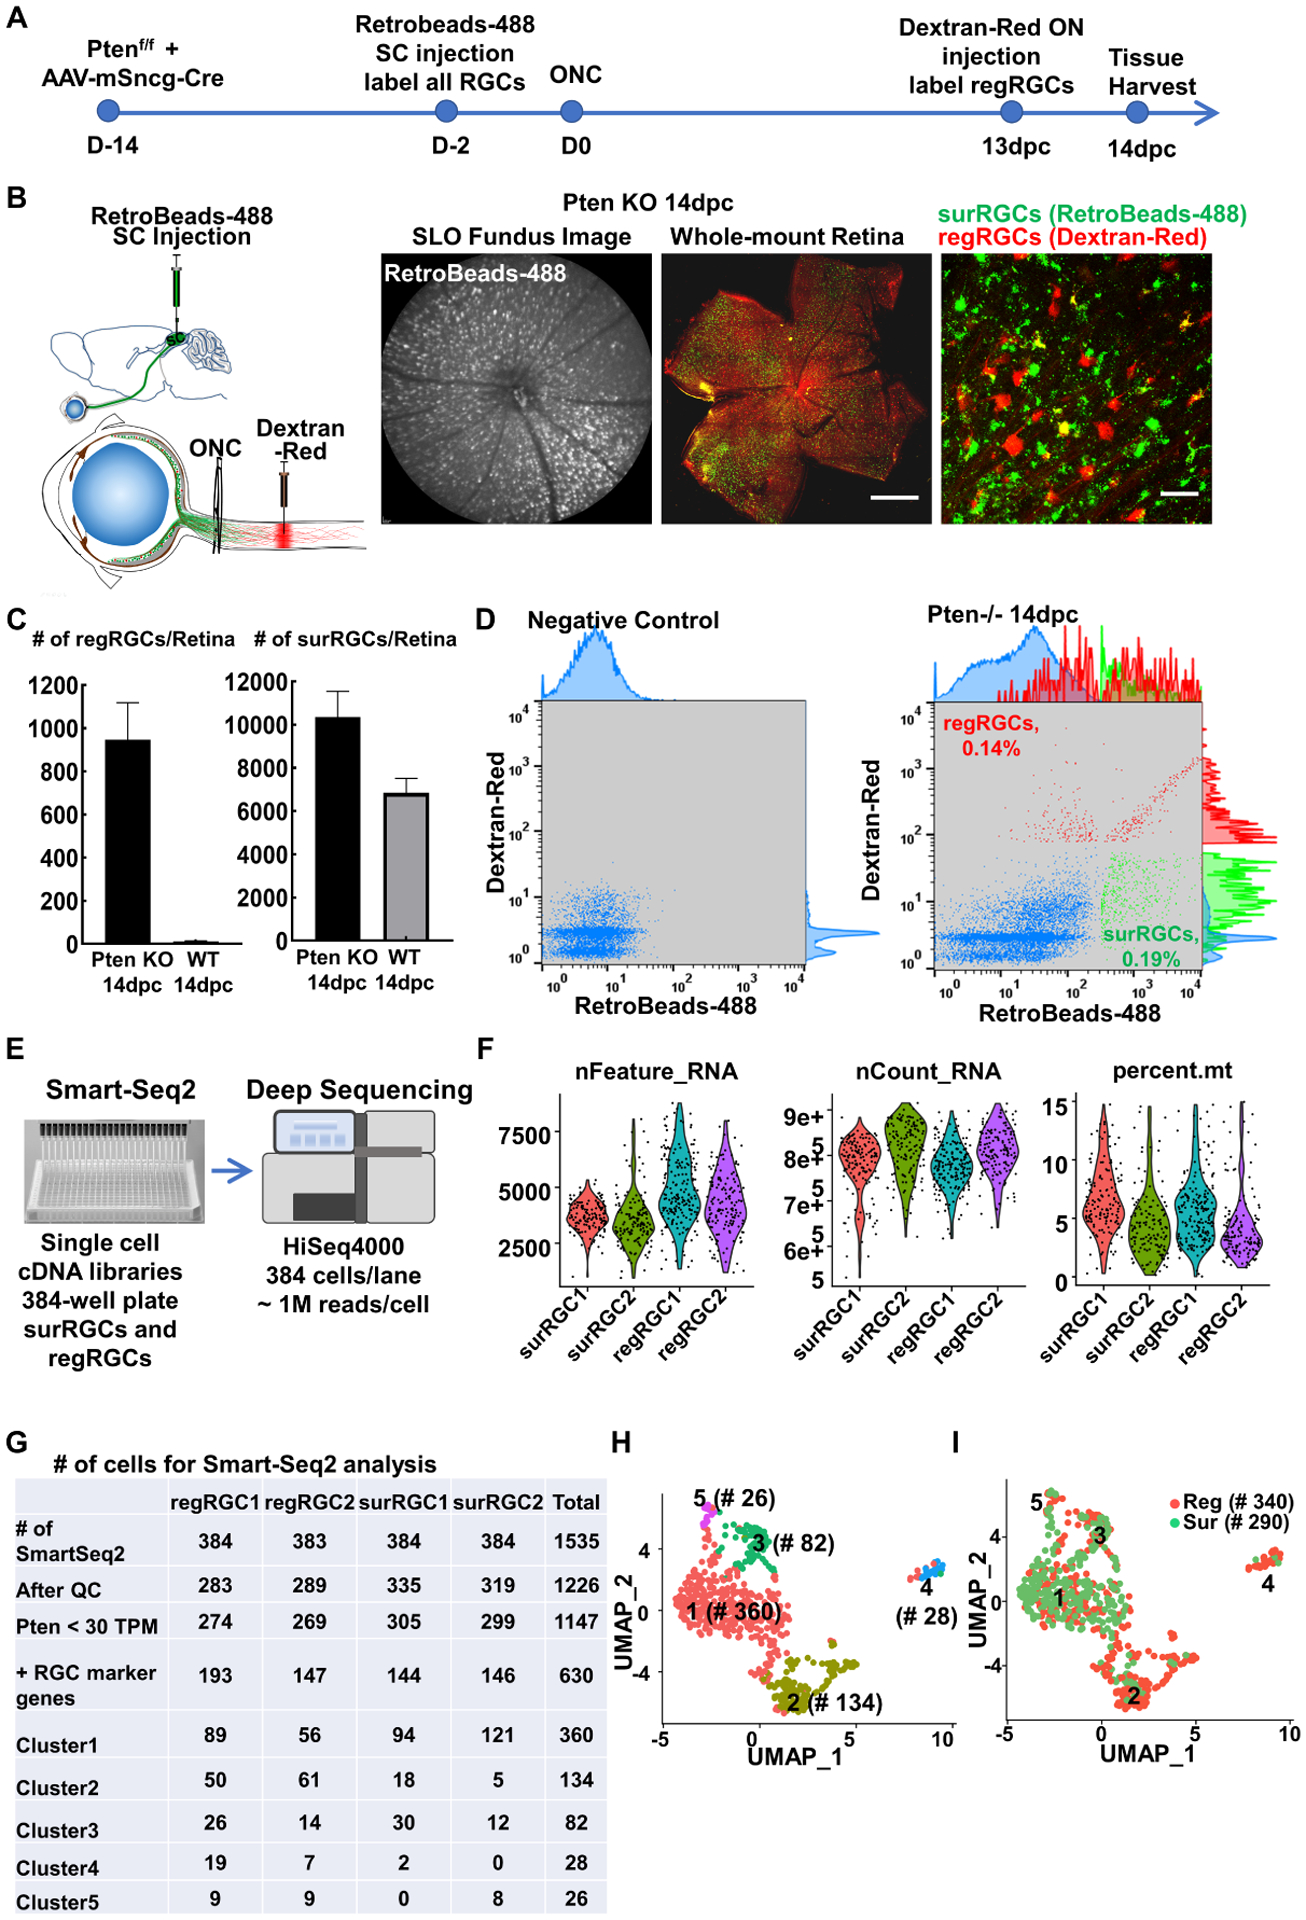
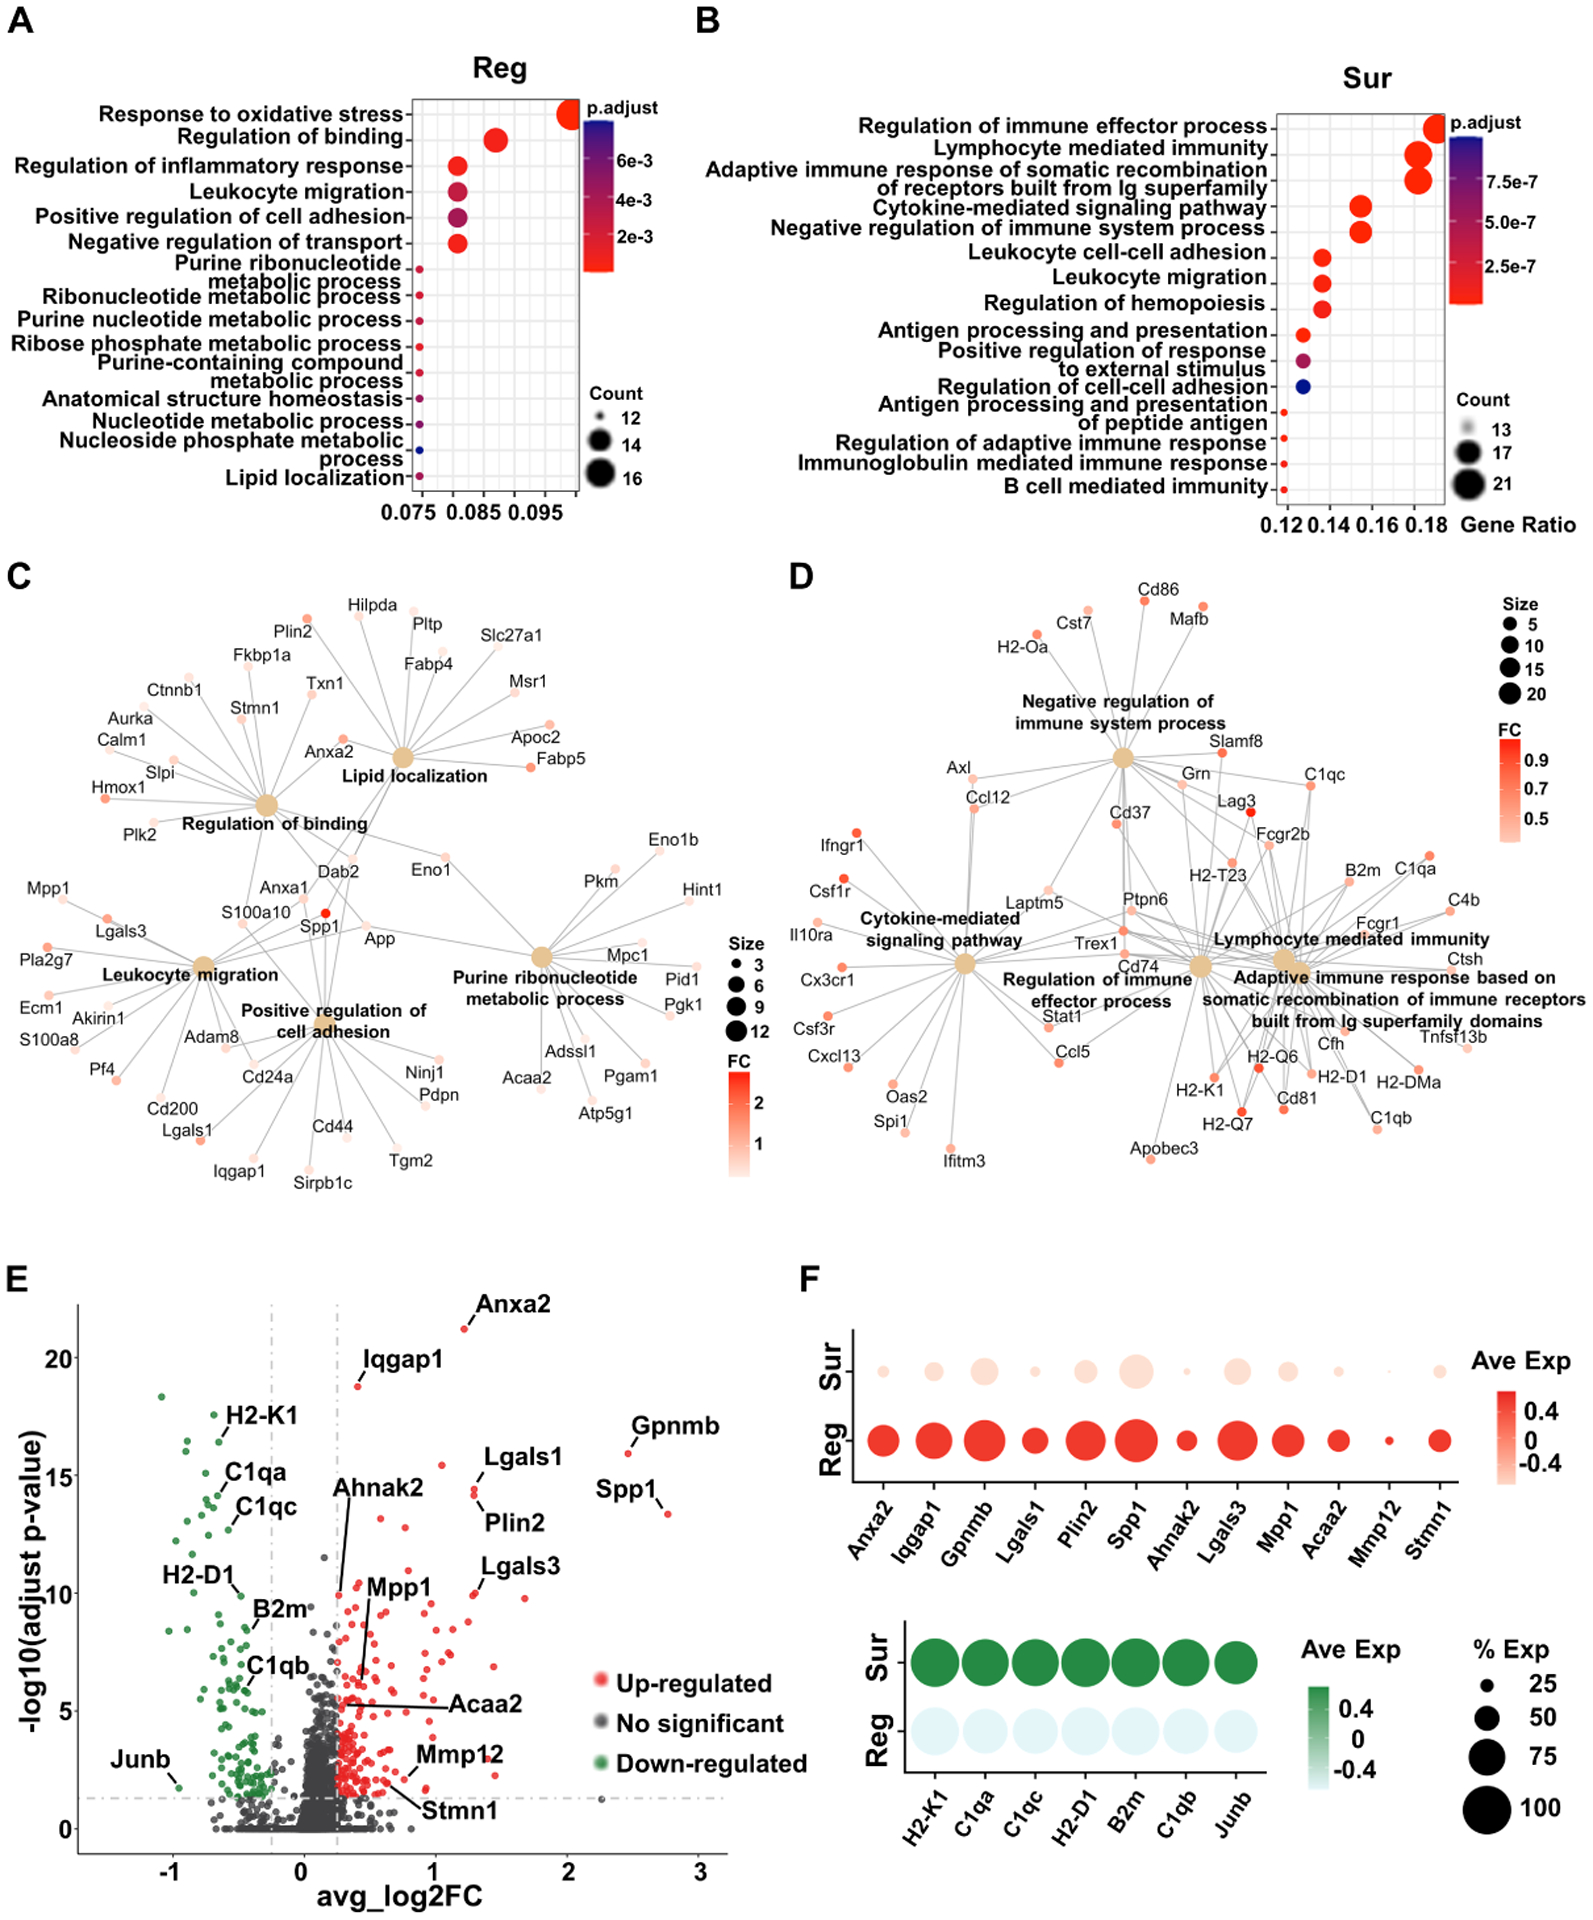
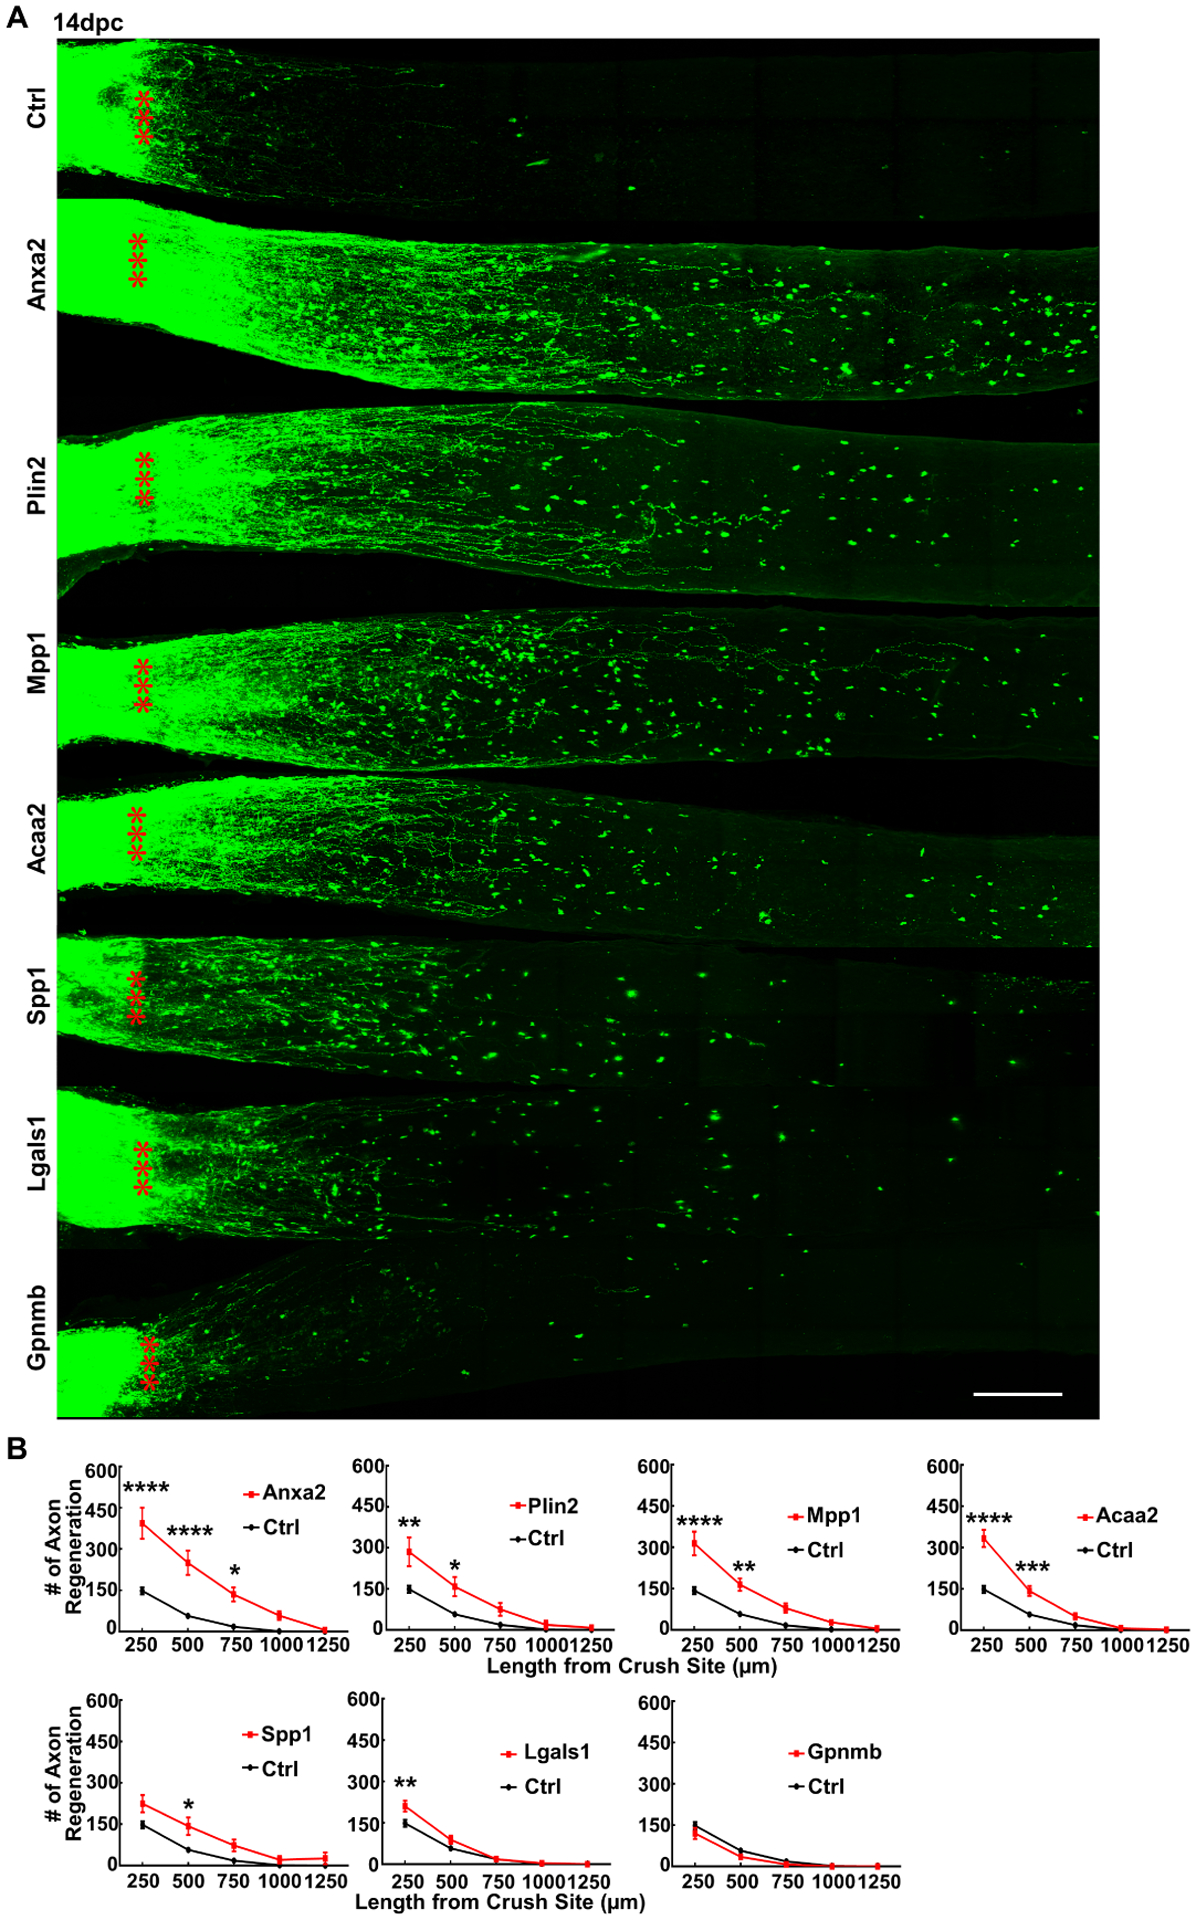
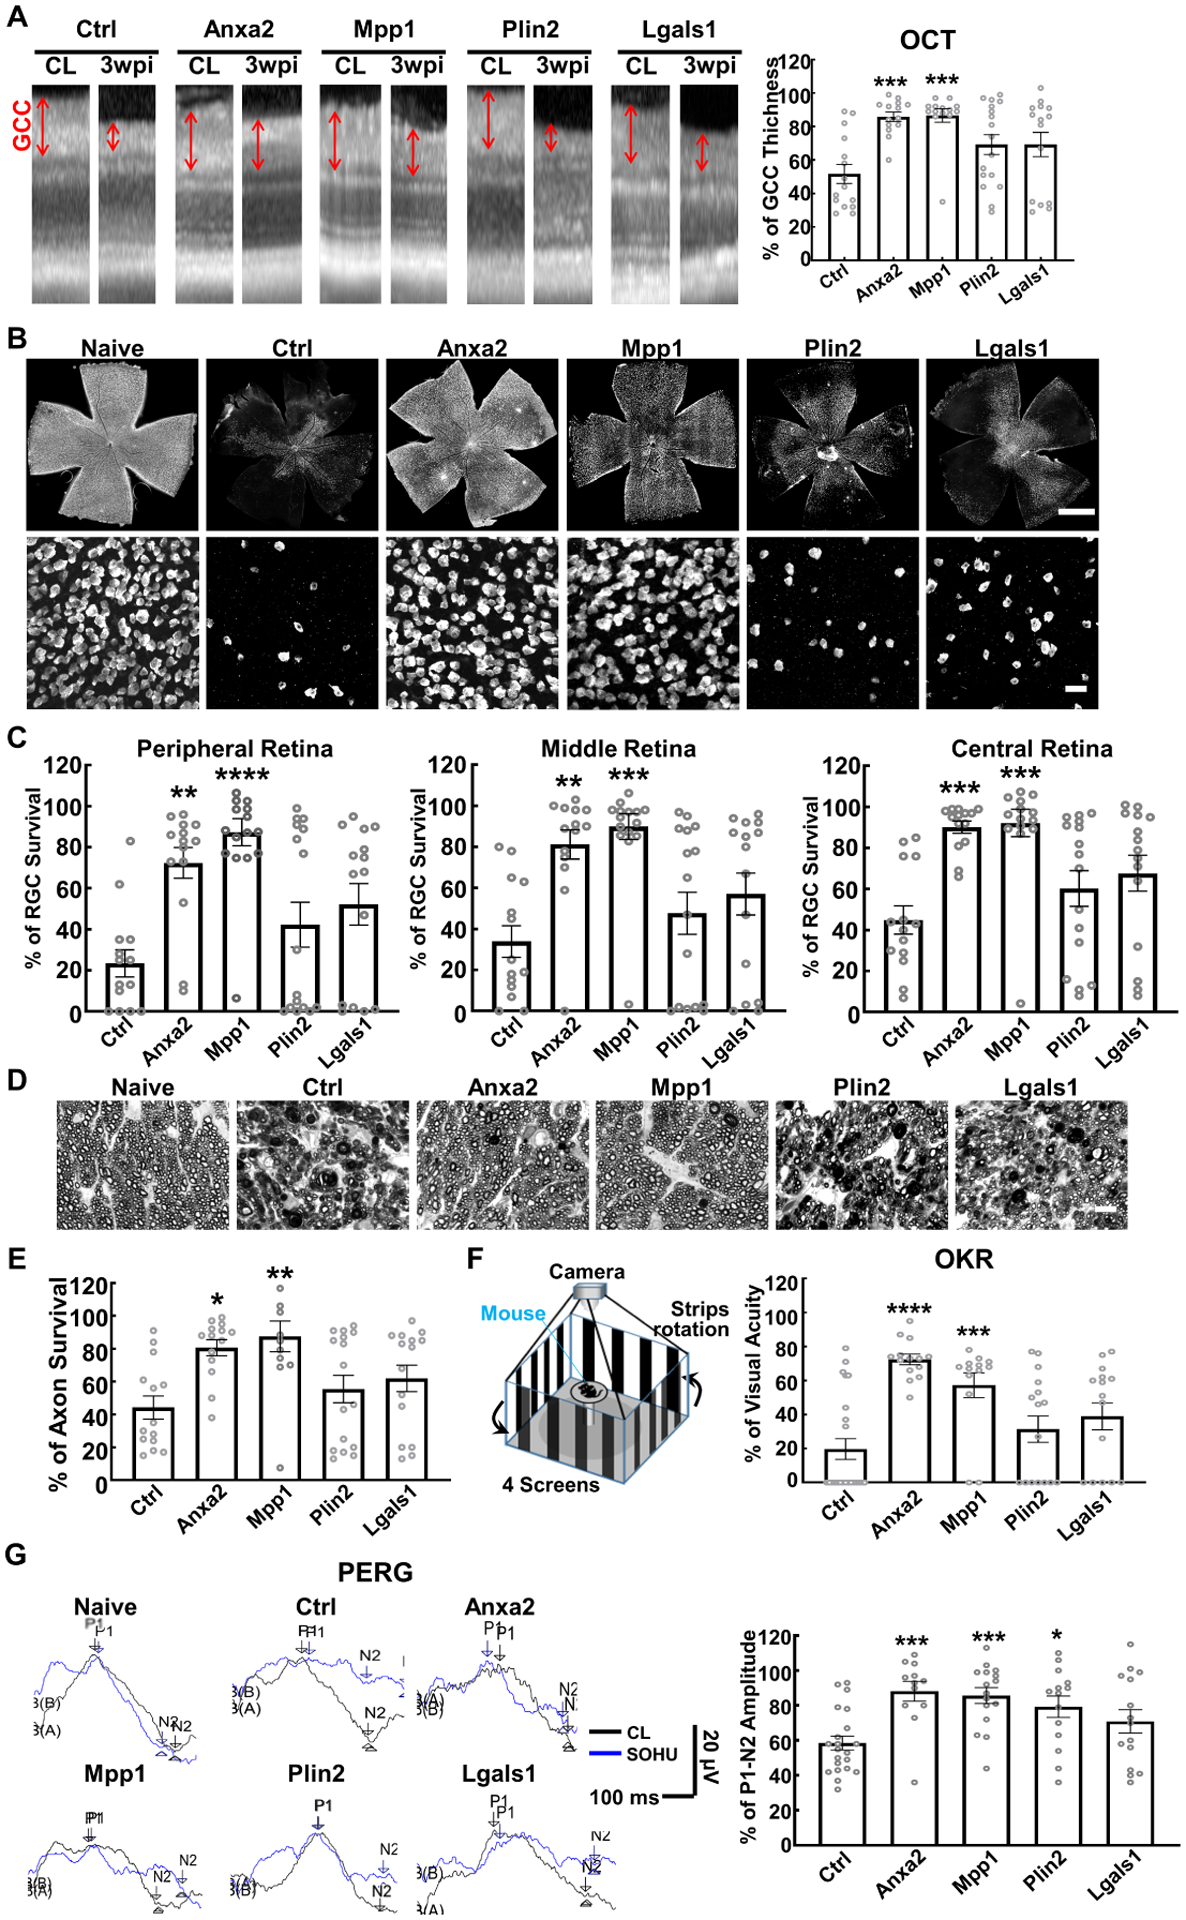
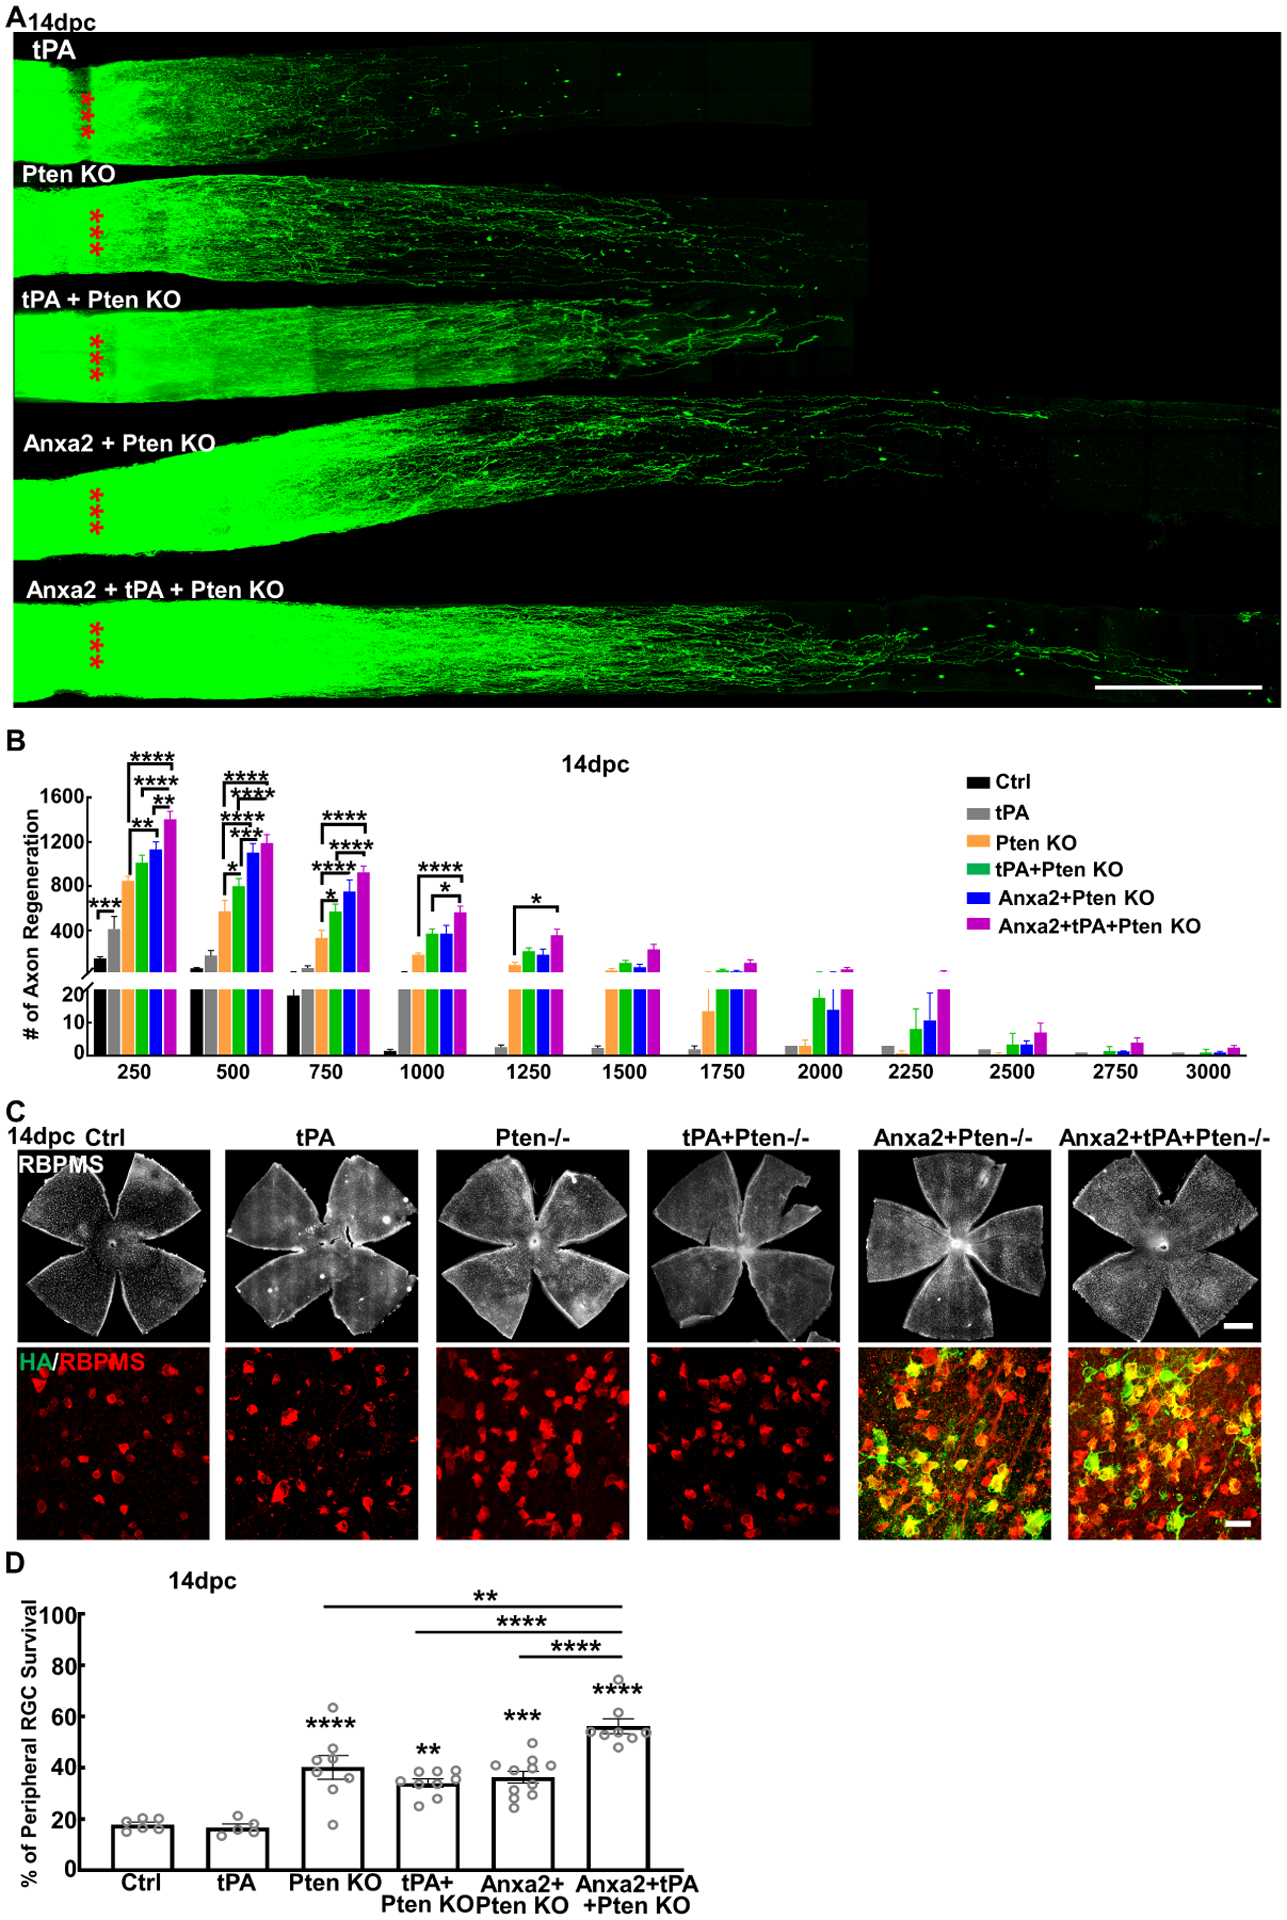
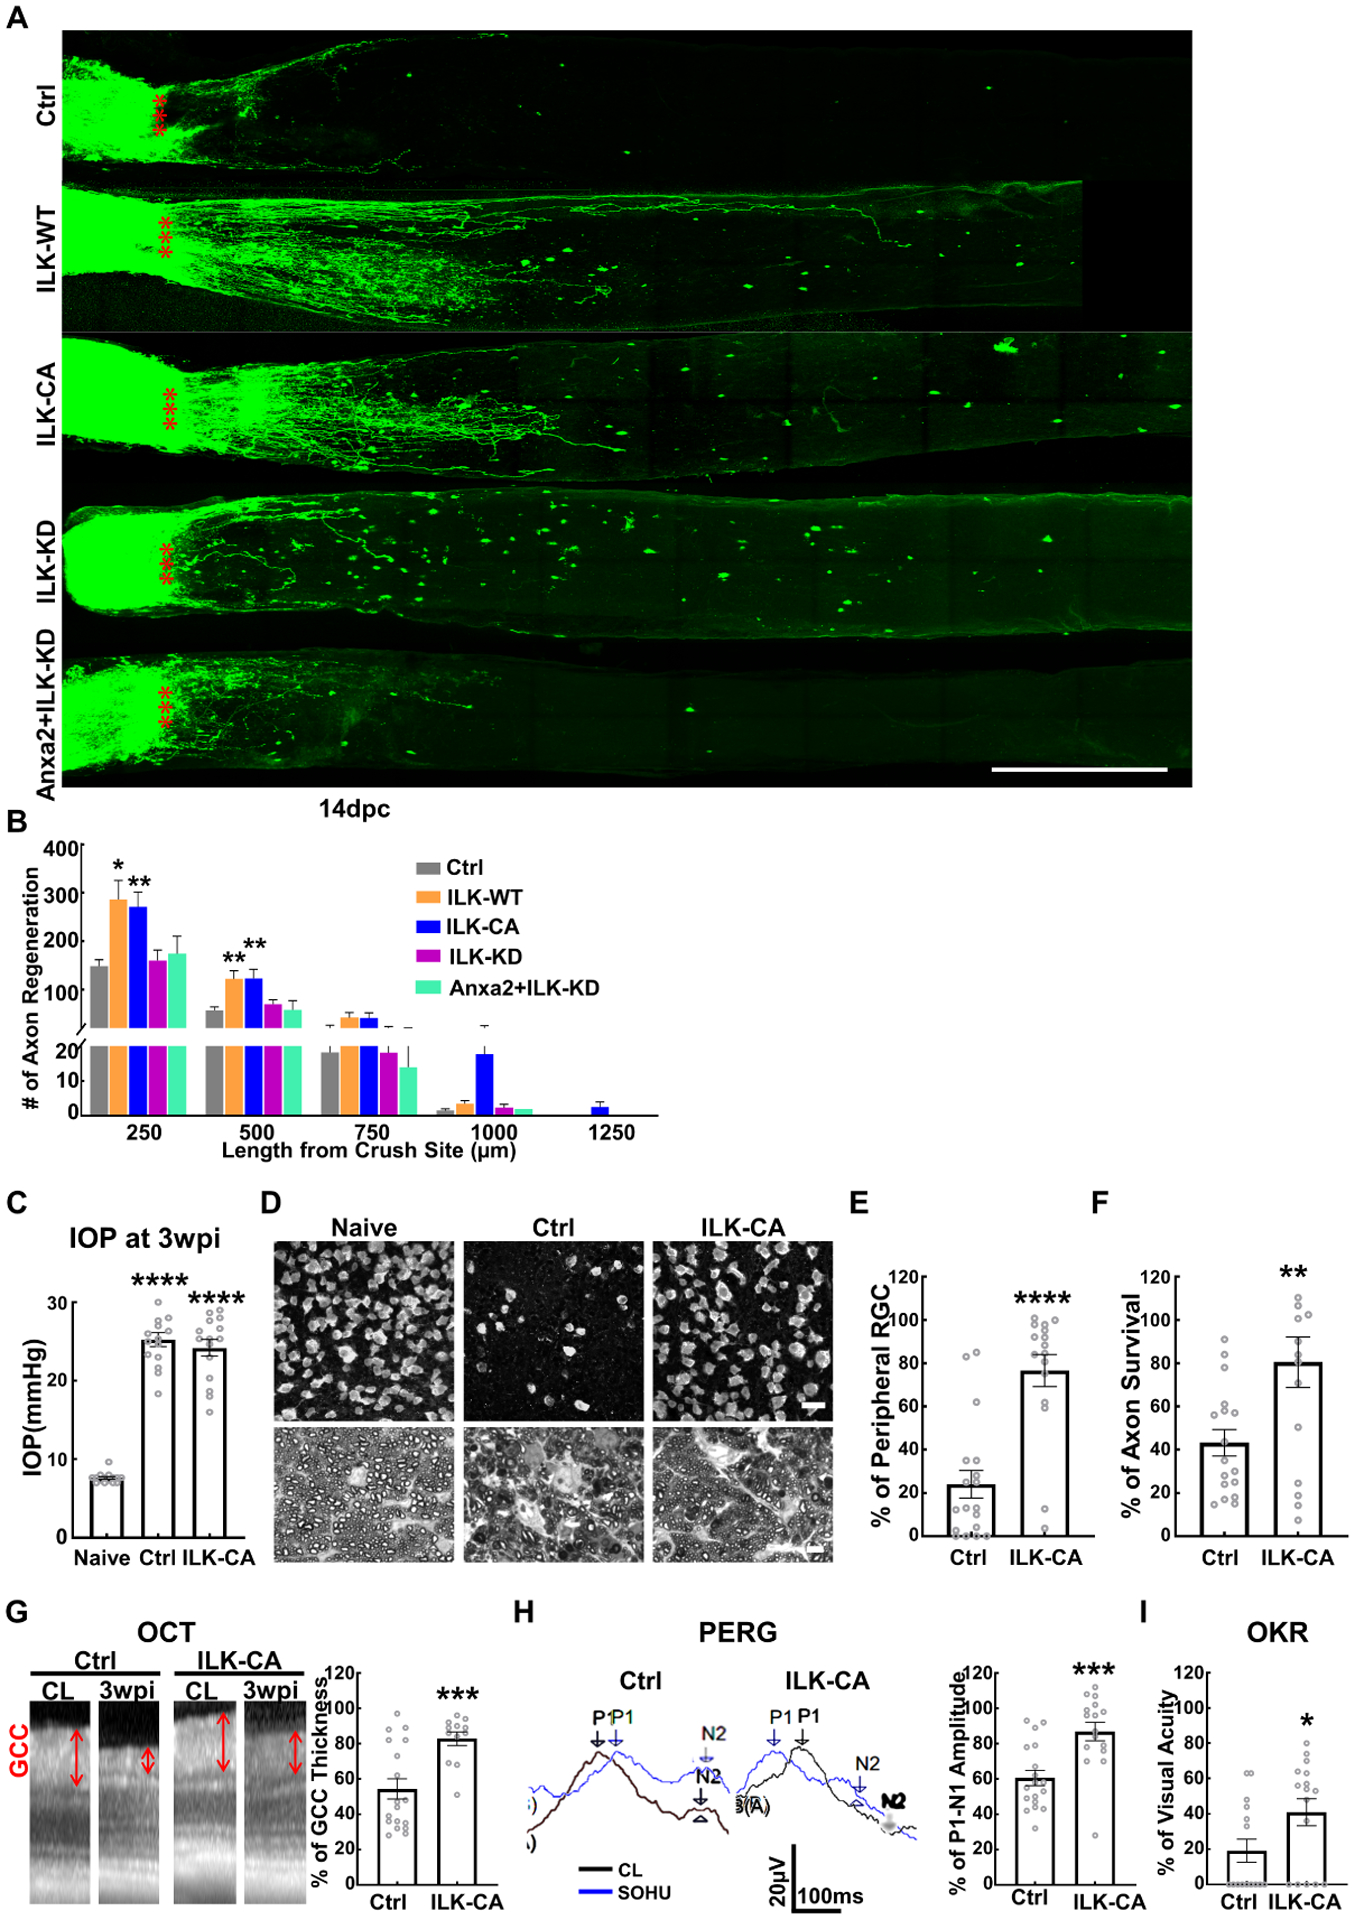
Axon regeneration holds great promise for neural repair of CNS axonopathies, including glaucoma. Pten deletion in retinal ganglion cells (RGCs) promotes potent optic nerve regeneration, but only a small population of Pten-null RGCs are actually regenerating RGCs (regRGCs); most surviving RGCs (surRGCs) remain non-regenerative. Here, we developed a strategy to specifically label and purify regRGCs and surRGCs, respectively, from the same Pten-deletion mice after optic nerve crush, in which they differ only in their regeneration capability. Smart-Seq2 single-cell transcriptome analysis revealed novel regeneration-associated genes that significantly promote axon regeneration. The most potent of these, Anxa2, acts synergistically with its ligand tPA in Pten-deletion-induced axon regeneration. Anxa2, its downstream effector ILK, and Mpp1 dramatically protect RGC somata and axons and preserve visual function in a clinically relevant model of glaucoma, demonstrating the exciting potential of this innovative strategy to identify novel effective neural repair candidates.

Keywords: Anxa2; ILK; Mpp1; Pten; RGC; Smart-Seq2; axon regeneration; glaucoma; neural repair; optic nerve.


Conflict of interest statement

Declaration of interests Y.H. is a consultant for Janssen BioPharma, Inc. A patent application has been submitted by Stanford Office of Technology Licensing for candidate neural repair targets identified in this manuscript.

Figures

Figure 1.
Figure 1.. Retrograde tracing of regenerating RGCs by intraorbital optic nerve dye injection.
(A) The intraorbital portion of optic nerve (~ 2mm) was exposed by pushing through the ocular muscles and soft tissues under the conjunctiva, without injuring the retro-orbital sinus. The ONC site is about 0.5 mm from the eyeball, leaving 1–1.5mm distal portion for dye injection. (B) Confocal images of retinal wholemounts of naïve mice one day after dextran-FITC intraorbital optic nerve injection, showing co-localization of the dextran and pan-RGC marker (RBPMS)-labeled RGCs, which are distinct from AP2α+ amacrine cells. Scale bar, 50μm. (C, D, E) Cartoon illustration of intravitreal injection of anterograde tracer dye CTB-555 and intraorbital optic nerve injection of retrograde tracer dye dextran-FITC in naïve, ONC injured WT and Pten KO mice at 14dpc; and corresponding fluorescent and bright field (BF) images of optic nerves showing the labeled axons and ONC sites. (F, G, H) SLO retinal fundus images of live animals showing the dextran-FITC labeled RGCs in naïve, ONC injured WT and Pten KO mice at 14dpc. (I, J, K) Retinal wholemounts of naïve, ONC injured WT, and Pten KO mice at 14dpc showing dextran-FITC labeled RGCs. Scale bar, upper panel: 500μm; lower panel: 50μm. See also Figure S1
Figure 2.
Figure 2.. Regenerating RGCs (regRGCs) and surviving but not regenerating RGCs (surRGCs): labeling, isolation, and Smart-Seq2 scRNA-seq.
(A) Timeline of experimental design for Pten deletion in RGCs 2 weeks before ONC, SC retrograde labeling of naïve RGCs, optic nerve retrograde tracing regRGCs, and tissue collection at 14dpc. (B) Cartoon illustration of SC injection of retrobeads-488 and intraorbital optic nerve injection of retrograde tracer dye dextran-Red; and SLO retinal fundus image of live animal showing RGCs labeled with retrobeads and retinal wholemounts showing surRGCs (green only) and regRGCs (red or yellow), in Pten KO mice at 14dpc. Scale bar, 500μm in the whole retina, 50μm in the zoom-in. (C) Quantification of the numbers of regRGCs/retina and surRGCs/retina labeled by our tracing strategy in WT and Pten KO mice at 14dpc. n = 6. Data are presented as means ± s.e.m. (D) FACS gating strategy for surRGCs (green only, no red) and regRGCs (red alone or red/green double) purification. (E) Smart-Seq2 preparation for scRNA-seq. (F) Quality control of scRNA-seq data showing number of genes detected/cell (nFeature), total reads/cell (nCount), and percentage of mitochondria genes (percent). (G) Numbers of cells collected for Smart-Seq2 analysis. (H) UMAP (Uniform Manifold Approximation and Projection) visualization of the transcriptional heterogeneity of 630 RGCs (340 regRGCs and 290 surRGCs) isolated from Pten KO mice at 14dpc. Cells are colored into 5 clusters. (I) The 5 RGC clusters are superimposed with regeneration identify: surRGCs are in green and regRGCs are in red. See also Figures S2, S3
Figure 3.
Figure 3.. Comparison of Smart-Seq2 transcriptomes of regRGCs and surRGCs reveals biological pathways and DEGs associated with RGC regeneration and survival.
(A, B) Top 15 enriched GO-pathways associated with regRGCs (A) or surRGCs (B). The size of each circle represents the numbers of genes enriched in each pathway, and the color represents the adjusted p value. (C, D) Cnetplot showing the interaction of 5 enriched pathways and their associated genes in regRGCs (C) and surRGCs (D). The size of each circle associated with each pathway represents the numbers of genes enriched in each pathway, and the color of each gene represents the fold change (FC). (E) VolcanoPlot of DEGs of regRGCs. Adjusted p value < 0.05, avg_log2FC > 0.25. The red genes are upregulated, and the green genes are downregulated in regRGCs. The grey genes are not significantly changed. (F) Dotplot showing expression of indicated regeneration-associated genes in regRGCs and surRGCs. The size of each circle represents the percentage of RGCs expressing the gene, and the color represents the expression level. See also Figures S4, S5
Figure 4.
Figure 4.. Anxa2 is the most potent of the 6 regeneration-associated genes that promote significant axon regeneration after ONC injury.
(A) Confocal images of optic nerve wholemounts after optical clearance showing maximum intensity projection of regenerating fibers labeled with CTB-Alexa 555 at 14dpc. Scale bar, 100 μm. *: crush site. (B) Quantification of regenerating fibers at different distances distal to the lesion site. Data are presented as means ± s.e.m, n = 8 in all groups except the Acaa2 group (n = 10). *: p<0.05, **: p<0.01, ***: p<0.001, ****: p<0.0001, two-way ANOVA with Sidak’s multiple comparisons test. See also Figure S5
Figure 5.
Figure 5.. RGC-specific Anxa2 and Mpp1 overexpression significantly promote survival of both RGC somata and axons, and preserves visual functions in SOHU glaucoma model.
(A) Representative OCT images of mouse retinas from SOHU glaucomatous eyes and contralateral control (CL) eyes at 3 weeks post SO injection (3wpi). GCC: ganglion cell complex, including RNFL, GCL and IPL layers; indicated as double end arrows. Quantification of GCC thickness measured by OCT at 3wpi, represented as percentage of GCC thickness in the SOHU eyes compared to the sham CL eyes. (B) Upper panel, representative confocal images of the whole flat-mounted retinas showing surviving RBPMS-positive RGCs at 3wpi, Scale bar, 500 μm. Lower panel, representative confocal images of peripheral flat-mounted retinas showing surviving RBPMS-labeled RGCs at 3wpi, Scale bar, 50 μm. (C) Quantification of surviving RGC somata in peripheral, middle, and central retinas at 3wpi, represented as percentage of glaucomatous eyes compared to the sham CL eyes. (D) Light microscope images of semi-thin transverse sections of ON with PPD staining at 3wpi. Scale bar, 10 μm. (E) Quantification of surviving axons at 3wpi, represented as percentage of glaucomatous eyes compared to the sham CL eyes. (F) Visual acuity measured by OKR at 3wpi, represented as percentage of glaucomatous eyes compared to the sham CL eyes. (G) Left: representative wave forms of PERG at baseline and 3wpi, blue traces represent glaucomatous eyes, black traces represent contralateral control (CL) eyes. Right: quantification of P1-N2 amplitude of PERG at 3wpi, represented as a percentage of glaucomatous eyes compared to the sham CL eyes. All the quantification, data are presented as means ± s.e.m, n = 13–16 in each group, *: p<0.05, **: p<0.01, ***: p<0.001, ****: p<0.0001, one-way ANOVA with Tukey’s multiple comparisons test. See also Figure S6A–C
Figure 6.
Figure 6.. Anxa2 and tPA potentiated Pten KO effects on axon regeneration and RGC survival after ONC.
(A) Confocal images of optic nerve wholemounts after optical clearance showing maximum intensity projection of regenerating fibers labeled with CTB-Alexa 555 at 14dpc. Scale bar, 500 μm. *: crush site. (B) Quantification of regenerating fibers at different distances distal to the lesion site. Data are presented as means ± s.e.m, n = 8. *: p<0.05, **: p<0.01, ***: p<0.001, ****: p<0.0001, two-way ANOVA with Tukey’s multiple comparisons test. (C) Confocal images of retinal wholemounts showing RBPMS+ RGCs and HA labeling of Anxa2 at 14dpc. Scale bar, upper panel: 500μm; lower panel: 50μm. (D) Quantification of surviving RGCs somata in peripheral retina at 14dpc, represented as percentage of crushed eyes compared to the sham CL eyes. Data are presented as means ± s.e.m, n = 6–11 in each group. **: p<0.01, ***: p<0.001, ****: p<0.0001, one-way ANOVA with Tukey’s multiple comparisons test. See also Figure S7
Figure 7.
Figure 7.. ILK acts downstream of Anxa2 in axon regeneration and glaucoma neuroprotection.
(A) Confocal images of ON wholemounts after optical clearance showing maximum intensity projection of regenerating fibers labeled with CTB-Alexa 555 at 14dpc. Scale bar, 500 μm. *: crush site. (B) Quantification of regenerating fibers at different distances distal to the lesion site. Data are presented as means ± s.e.m, n = 8–10. *: p<0.05, **: p<0.01, two-way ANOVA with Fisher’s LSD test. (C) IOP of naïve and SOHU eyes of control (Ctrl) and AAV-ILK-CA groups at 3wpi. Data are presented as means ± s.e.m, n = 15 in each group. ****: p<0.0001, Student’s t-test. (D) Representative confocal images of peripheral flat-mounted retinas showing surviving RBPMS-labeled RGCs and representative images of semi-thin transverse sections of ON with PPD staining at 3wpi. Upper panel, scale bar, 50 μm; lower panel, scale bar, 10 μm. (E) Quantification of peripheral surviving RGC somata at 3wpi, represented as percentage of glaucomatous eyes compared to the sham CL eyes. Data are presented as means ± s.e.m, n = 16 in each group, ****: p<0.0001, Student’s t-test. (F) Quantification of surviving axons at 3wpi, represented as percentage of glaucomatous eyes compared to the sham CL eyes. Data are presented as means ± s.e.m, n = 16 in each group, **: p<0.01, Student’s t-test. (G) Representative OCT images of mouse retinas from SOHU glaucomatous eyes and contralateral control eyes at 3wpi and quantification of GCC thickness at 3wpi, represented as percentage of GCC thickness in the SOHU eyes compared to the sham CL eyes. Data are presented as means ± s.e.m, n = 16 in each group, ***: p<0.001, Student’s t-test. (H) Left: representative wave forms of PERG at baseline and 3wpi, blue traces represent glaucomatous eyes, black traces represent contralateral control (CL) eyes. Right: quantification of P1-N2 amplitude of PERG at 3wpi, represented as a percentage of glaucomatous eyes compared to the sham CL eyes. Data are presented as means ± s.e.m, n = 16 in each group, ***: p<0.001, Student’s t-test. (I) Visual acuity measured by OKR at 3wpi, represented as percentage of glaucomatous eyes compared to the sham CL eyes. Data are presented as means ± s.e.m, n = 16 in each group, *: p<0.05, Student’s t-test. See also Figure S6D,E

Comment in

References

    1. Abreu CA, De Lima SV, Mendonca HR, Goulart CO, and Martinez AM (2017). Absence of galectin-3 promotes neuroprotection in retinal ganglion cells after optic nerve injury. Histol Histopathol 32, 253–262. 10.14670/HH-11-788. - DOI - PubMed
    1. Almasabi S, Ahmed AU, Boyd R, and Williams BRG (2021). A Potential Role for Integrin-Linked Kinase in Colorectal Cancer Growth and Progression via Regulating Senescence and Immunity. Frontiers in genetics 12, 638558. 10.3389/fgene.2021.638558. - DOI - PMC - PubMed
    1. Benowitz LI, He Z, and Goldberg JL (2015). Reaching the brain: Advances in optic nerve regeneration. Exp Neurol. 10.1016/j.expneurol.2015.12.015. - DOI - PubMed
    1. Bharadwaj A, Bydoun M, Holloway R, and Waisman D (2013). Annexin A2 heterotetramer: structure and function. Int J Mol Sci 14, 6259–6305. 10.3390/ijms14036259. - DOI - PMC - PubMed
    1. Bharadwaj A, Kempster E, and Waisman DM (2021a). The Annexin A2/S100A10 Complex: The Mutualistic Symbiosis of Two Distinct Proteins. Biomolecules 11. 10.3390/biom11121849. - DOI - PMC - PubMed

Publication types