. 2022 Oct;610(7930):154-160.
doi: 10.1038/s41586-022-05200-3. Epub 2022 Aug 11.

Context-specific emergence and growth of the SARS-CoV-2 Delta variant

Affiliations

Context-specific emergence and growth of the SARS-CoV-2 Delta variant

John T McCrone et al. Nature. 2022 Oct.

Abstract

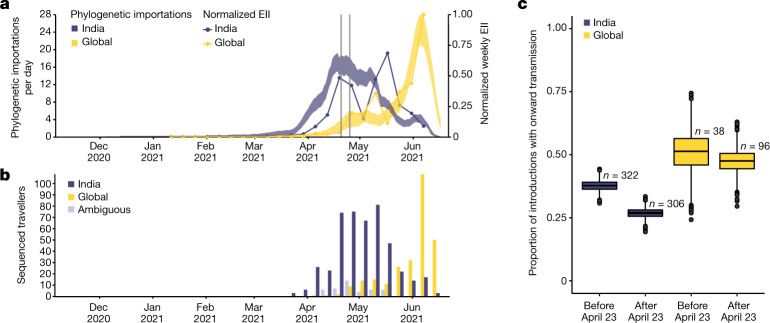
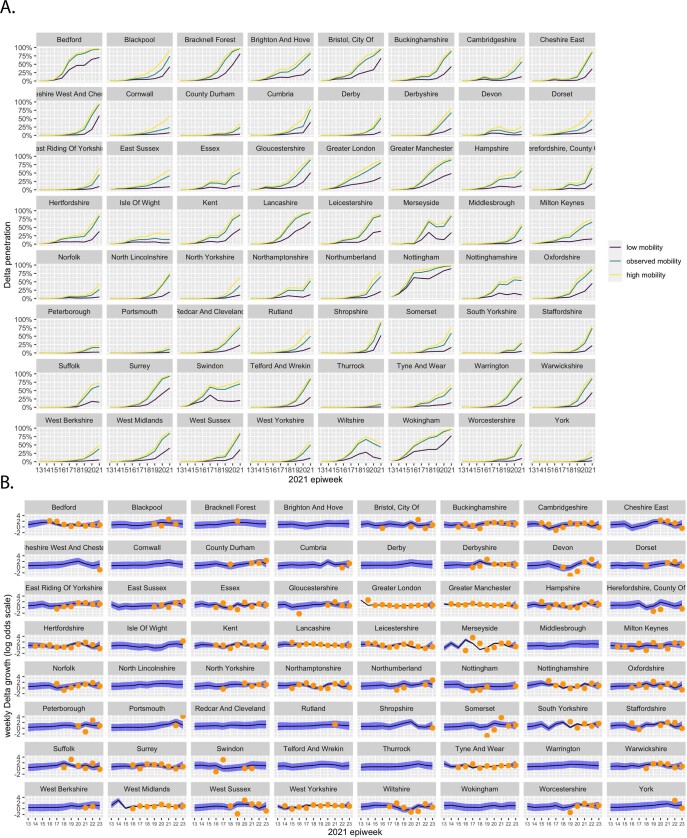
The SARS-CoV-2 Delta (Pango lineage B.1.617.2) variant of concern spread globally, causing resurgences of COVID-19 worldwide1,2. The emergence of the Delta variant in the UK occurred on the background of a heterogeneous landscape of immunity and relaxation of non-pharmaceutical interventions. Here we analyse 52,992 SARS-CoV-2 genomes from England together with 93,649 genomes from the rest of the world to reconstruct the emergence of Delta and quantify its introduction to and regional dissemination across England in the context of changing travel and social restrictions. Using analysis of human movement, contact tracing and virus genomic data, we find that the geographic focus of the expansion of Delta shifted from India to a more global pattern in early May 2021. In England, Delta lineages were introduced more than 1,000 times and spread nationally as non-pharmaceutical interventions were relaxed. We find that hotel quarantine for travellers reduced onward transmission from importations; however, the transmission chains that later dominated the Delta wave in England were seeded before travel restrictions were introduced. Increasing inter-regional travel within England drove the nationwide dissemination of Delta, with some cities receiving more than 2,000 observable lineage introductions from elsewhere. Subsequently, increased levels of local population mixing-and not the number of importations-were associated with the faster relative spread of Delta. The invasion dynamics of Delta depended on spatial heterogeneity in contact patterns, and our findings will inform optimal spatial interventions to reduce the transmission of current and future variants of concern, such as Omicron (Pango lineage B.1.1.529).


Conflict of interest statement

The authors declare no competing interests.

Figures

Fig. 1
Fig. 1. The emergence and rapid geographic expansion of Delta.
a, Time-calibrated phylogenetic reconstruction of Delta based on 1,000 sequences subsampled from 93,649 sequences from 100 countries (52,992 from England). The tree was split into three subtrees (with n = 28,783, 28,715 and 36,151 sequences, respectively) prior to full analysis. The roots of these three subtrees, and of lineage AY.4 are labelled with black squares. Lineage colours represent the inferred countries and/or regions where transmission occurred. b, The number of sequenced cases of Delta per week in India, England and globally, where ‘global’ refers all countries other than England and India. c, The proportion of sequenced, reported positive cases in India and England (solid lines, n = 52,992 sequences from England, corresponding to 84% of all sequences from the UK during the study period) and the proportion of sequenced cases classified as Delta in India and England (dashed lines).
Fig. 2
Fig. 2. Timing of importations of Delta into England.
a, The estimated daily number of importations of Delta from India (blue shaded area) and other countries (yellow shaded area), inferred from phylogenetic analysis. Shaded areas show 95% HPDs of the estimate. Blue and yellow lines show the EII of Delta, obtained by combining data on human movements, cases and prevalence of Delta, normalized to the same scale as the phylogenetic estimates. Grey vertical lines show the timing of the announcement of travel restrictions from India to England (18 April 2021) and their implementation on 23 April 2021. b, Temporal distribution of genome sequences from cases with a known travel history from India (blue) and other countries (yellow). Isolates with recent travel to both India and other countries are considered ambiguous (grey). c, The proportion of all virus introductions that show evidence of onward transmission in the UK, estimated separately for weeks before and after the implementation of hotel quarantine (23 April 2021) and stratified by the location of origin (India, blue; other countries, yellow). The box plot displays the median, with lower and upper hinges representing the 25th and 75th percentiles of each group. Whiskers extend to the most extreme data points no more than 1.5 times the interquartile range beyond each hinge. The number of observations in each group is annotated above each box.
Fig. 3
Fig. 3. Introductions and regional dynamics of Delta transmission lineages.
a, The number of independent introductions per UTLA in England derived from continuous phylogeographic analysis of all Delta transmission lineages with more than five sequences. b, Trends in aggregate intra- and inter-UTLA mobility normalized to pre-pandemic levels (yellow) and the number of virus lineage movements between postcode districts. Letters denote stages of lockdown easing: A, schools re-open and limited outdoor mixing between households is permitted (8 March 2021); B, ‘stay at home’ directive is lifted, more outdoor mixing (up to six people from two households) is allowed (29 March 2021); C, non-essential retail, holiday lets and campsites re-open and outdoor dining is permitted (12 April 2021); D, indoor hospitality re-opens and indoor mixing is permitted (17 May 2021). c, The proportion of virus lineage movements between postcodes more than 25 km apart: the y axis denotes the proportion of movements that are less than or equal to the value on the x axis. This is shown for movements before lockdown easing (C (blue)), between C and D (yellow) and D (red). C and D are defined in b. d, Virus lineage movements inferred by continuous phylogeographic analysis for four example large transmission lineages (transmission lineages IV, VI and VII are shown in Extended Data Fig. 5). The direction of lineage movement is anticlockwise, and dots represent the start and end points of movements, coloured by inferred date. The size of each lineage and its inferred TMRCA date are shown below each map. Distance kernels for each lineage are shown in Extended Data Fig. 7.
Fig. 4
Fig. 4. Variation in Delta growth rates across UTLAs in England.
a, The increase in Delta frequency compared with Alpha at the UTLA level. UTLAs are coloured according to the level of average within-UTLA mobility: high, the five UTLAs with the highest within-location mobility; low, the five UTLAs with the lowest within-location mobility; medium, the remaining UTLAs. Solid lines show data for given UTLAs; dashed lines show LOESS curves fit to the data for each mobility category. b, Examples of weekly growth (the solid line corresponds to posterior medians) of UTLAs with high (left) and low (right) within-UTLA mobility. The shaded regions represent the corresponding 95% Bayesian credible intervals (2.5th and 97.5th quantiles of the posterior distribution). In a, data are shown only for UTLAs with 500 or more sequenced samples.
Extended Data Fig. 1
Extended Data Fig. 1. SARS-CoV-2 movement dynamics.
A) Daily number of reported SARS-CoV-2 cases (yellow bars, right hand axis) in India. Weekly human movements in England, relative to the maximum in England (dark blue line, left hand axis, Methods), and in India, relative to the maximum in India (red line, left hand axis, Methods). Proportion of genomes in India that are assigned to lineages B.1.617.2 (black line, no points) and B.1.617.1 (light blue line, no points) (left hand axis). First vertical line represents the announcement of the quarantine policy for arrivals of travellers from India to England (17 March 2021) and the second vertical line represents the date of implementation (23 March 2021). B) Proportion of weekly Estimated Exportation Intensity (EEI) of Delta by country. See Methods for details of calculation (left y-axis). The black line represents the total EEI by week (right y-axis).
Extended Data Fig. 2
Extended Data Fig. 2. Travel history of Delta importations.
Temporal distribution of genomic isolates from the AY.4 sublineage with travel history, by the likely location of exposure.
Extended Data Fig. 3
Extended Data Fig. 3. Changing importation dynamics.
A) R2 (coefficient of determination) between estimated number of importations from the phylogenetic analysis and the Estimated Importation Intensity (EII) (Fig. 2a). The R2 is calculated separately for India (blue) before and after hotel quarantine was introduced, and for other countries (yellow), whilst also accounting for phylogenetic uncertainty. B) Proportion of singletons vs non-singletons stratified by non-travel associated clusters and travel associated clusters and origin locations for the 3 weeks before and after the implementation of the hotel quarantine. The box plot displays the median with lower and upper hinges representing the 25th and 75th percentiles of each group. Whiskers extend to the most extreme data points no more than 1.5 times the interquartile range beyond each hinge. Figure 3a includes each of the trees in the posterior sample (n = 1998 for each box). The number of observations in each group in B is annotated above each box.
Extended Data Fig. 4
Extended Data Fig. 4. Representativeness of SARS-CoV-2 Delta genomes.
Correlation between the number of weekly Delta sequences and the number of weekly Delta cases each UTLA (Pearson’s r = 0.68, 95% CI: 0.65–0.71). Shaded region represents 95% CI.
Extended Data Fig. 5
Extended Data Fig. 5. Internal dissemination of Delta.
A) Maps showing virus movements inferred using continuous phylogeographic analysis for the fourth, sixth and seventh largest transmission lineages. Direction of movement is anti-clockwise, and dots are coloured by date. Cumulative number of UTLAs that the five largest Delta transmission lineages are sampled in absolute (B) and relative (C) time.
Extended Data Fig. 6
Extended Data Fig. 6. Drivers of exportations.
Number of estimated exportations from phylogeographic analysis and population size at the UTLA level (Pearson’s r = 0.54, 95% CI: 0.38–0.68, p-value < 0.005). Grey shaded region represents 95% CI.
Extended Data Fig. 7
Extended Data Fig. 7. Distance of viral movements.
Histograms of the distance of viral movements over 50km for each of the largest seven Delta transmission lineages in England.
Extended Data Fig. 8
Extended Data Fig. 8. Weekly lineage growth rates.
Growth of transmission lineages in England for lineages observed for at least 3 weeks and with >100 genomes sampled in total. A) The log number of weekly sampled genomes per transmission lineage plotted over time. Lines represent a linear fit (assuming exponential growth). B) Distribution of growth rates (slopes in A). C) Quantile plot comparing the observed quantiles in the growth rate distribution to theoretical quantiles from a normal distribution.
Extended Data Fig. 9
Extended Data Fig. 9. Representativeness of SARS-CoV-2 Delta genomes in India.
Scatter plot showing the number of confirmed cases per state in India vs. the number of cases sequenced in that state in India between 28th of November 2020 to the 16th of May 2021. In states above the line more than the mean number of cases were sequenced.
Extended Data Fig. 10
Extended Data Fig. 10. Counterfactual scenarios.
A) Estimated and observed proportions of Delta variant samples across UTLAs, for various counterfactual scenarios: minimum (purple) and maximum relative within UTLA mobility (yellow), observed within UTLA mobility (light blue). All lines represent median posterior estimates using the model with epiweek and within UTLA mobility as covariates which was fit to data from 2021 epiweeks 13–21. B) Time-varying relative growth of Delta (on the log odds scale). The shaded regions represent the corresponding 95% Bayesian credible intervals. The orange points indicate the raw growth rates calculated directed from the data (note, there are missing values in these data due to the presence of dates when no samples were taken or when the frequency of Delta remained at 0% or 100%).
Extended Data Fig. 11
Extended Data Fig. 11. Model evaluation.
A) Posterior and B) prior predictive simulations for the Delta frequency. In both cases, the orange point-ranges display the observed data (points indicate posterior medians and whiskers indicate 2.5%–97.5% posterior quantiles assuming a uniform prior for each independent data point). The blue shaded region represents in (A) the posterior simulated 2.5%–97.5% quantiles and in (B) the equivalent prior simulated quantiles; lines indicate median simulation values.
Extended Data Fig. 12
Extended Data Fig. 12. Simulation model.
Simulation comparing known vs estimated relative growth rates (see Methods) for hypothetical locations.

Update of

  • Context-specific emergence and growth of the SARS-CoV-2 Delta variant.
    McCrone JT, Hill V, Bajaj S, Pena RE, Lambert BC, Inward R, Bhatt S, Volz E, Ruis C, Dellicour S, Baele G, Zarebski AE, Sadilek A, Wu N, Schneider A, Ji X, Raghwani J, Jackson B, Colquhoun R, O'Toole Á, Peacock TP, Twohig K, Thelwall S, Dabrera G, Myers R; COVID-19 genomics UK (COG-UK) consortium; Faria NR, Huber C, Bogoch II, Khan K, du Plessis L, Barrett JC, Aanensen DM, Barclay WS, Chand M, Connor T, Loman NJ, Suchard MA, Pybus OG, Rambaut A, Kraemer MUG. McCrone JT, et al. Res Sq [Preprint]. 2021 Dec 20:rs.3.rs-1159614. doi: 10.21203/rs.3.rs-1159614/v1. Res Sq. 2021. Update in: Nature. 2022 Oct;610(7930):154-160. doi: 10.1038/s41586-022-05200-3. PMID: 34981043 Free PMC article. Updated. Preprint.
  • Context-specific emergence and growth of the SARS-CoV-2 Delta variant.
    McCrone JT, Hill V, Bajaj S, Pena RE, Lambert BC, Inward R, Bhatt S, Volz E, Ruis C, Dellicour S, Baele G, Zarebski AE, Sadilek A, Wu N, Schneider A, Ji X, Raghwani J, Jackson B, Colquhoun R, O'Toole Á, Peacock TP, Twohig K, Thelwall S, Dabrera G, Myers R; COVID-19 genomics UK (COG-UK) consortium; Faria NR, Huber C, Bogoch II, Khan K, du Plessis L, Barrett JC, Aanensen DM, Barclay WS, Chand M, Connor T, Loman NJ, Suchard MA, Pybus OG, Rambaut A, Kraemer MUG. McCrone JT, et al. medRxiv [Preprint]. 2021 Dec 21:2021.12.14.21267606. doi: 10.1101/2021.12.14.21267606. medRxiv. 2021. Update in: Nature. 2022 Oct;610(7930):154-160. doi: 10.1038/s41586-022-05200-3. PMID: 34981069 Free PMC article. Updated. Preprint.

References

    1. Vöhringer HS, et al. Genomic reconstruction of the SARS-CoV-2 epidemic in England. Nature. 2021;600:506–511. doi: 10.1038/s41586-021-04069-y. - DOI - PMC - PubMed
    1. Earnest R, et al. Comparative transmissibility of SARS-CoV-2 variants Delta and Alpha in New England, USA. Cell Rep. Med. 2022;3:100583. doi: 10.1016/j.xcrm.2022.100583. - DOI - PMC - PubMed
    1. Kupferschmidt, K. & Wadman, M. Delta variant triggers dangerous new phase in the pandemic. Sciencehttps://www.sciencemag.org/news/2021/06/delta-variant-triggers-dangerous... (2021).
    1. Vaidyanathan G. Coronavirus variants are spreading in India—what scientists know so far. Nature. 2021;593:321–322. doi: 10.1038/d41586-021-01274-7. - DOI - PubMed
    1. Elliott P, et al. Exponential growth, high prevalence of SARS-CoV-2, and vaccine effectiveness associated with the Delta variant. Science. 2021;374:eabl9551. doi: 10.1126/science.abl9551. - DOI - PMC - PubMed

Publication types

Supplementary concepts