. 2022 Sep;609(7929):994-997.
doi: 10.1038/s41586-022-05189-9. Epub 2022 Aug 11.

Pandemic-scale phylogenomics reveals the SARS-CoV-2 recombination landscape

Affiliations

Pandemic-scale phylogenomics reveals the SARS-CoV-2 recombination landscape

Yatish Turakhia et al. Nature. 2022 Sep.

Abstract

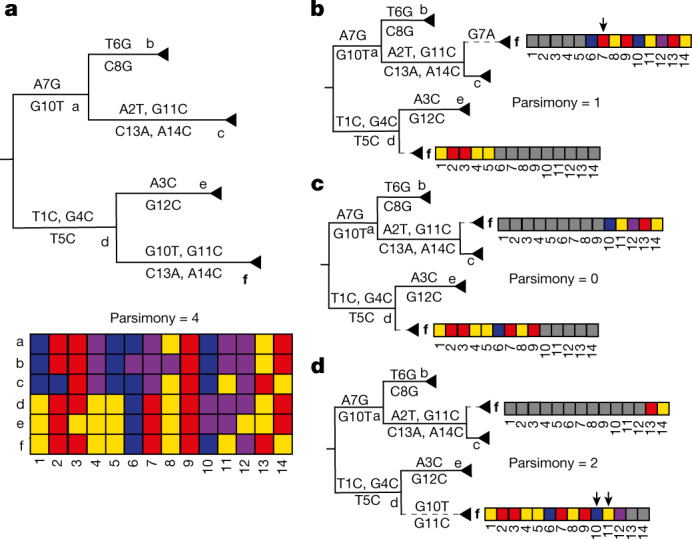
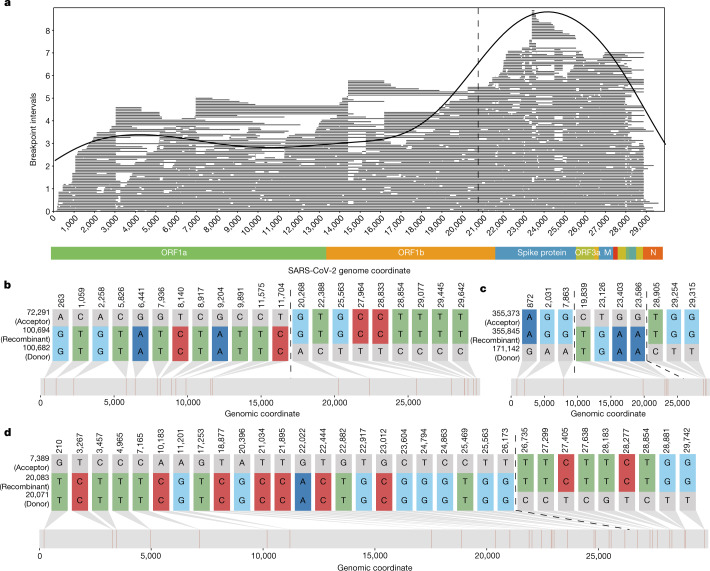
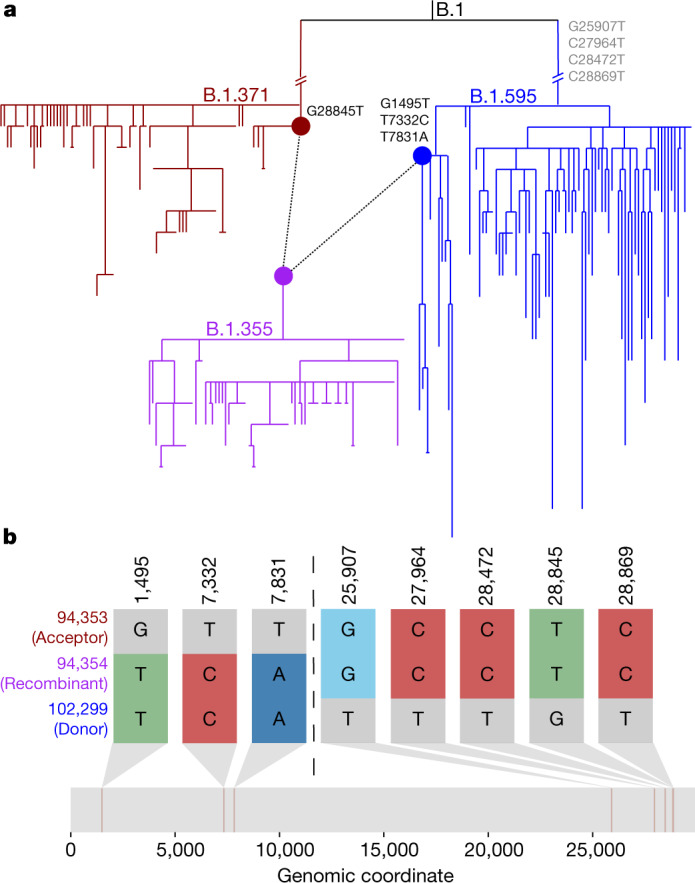
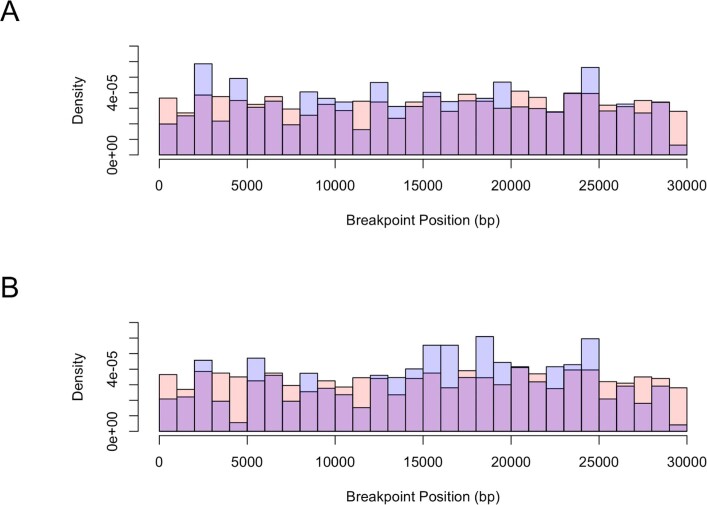
Accurate and timely detection of recombinant lineages is crucial for interpreting genetic variation, reconstructing epidemic spread, identifying selection and variants of interest, and accurately performing phylogenetic analyses1-4. During the SARS-CoV-2 pandemic, genomic data generation has exceeded the capacities of existing analysis platforms, thereby crippling real-time analysis of viral evolution5. Here, we use a new phylogenomic method to search a nearly comprehensive SARS-CoV-2 phylogeny for recombinant lineages. In a 1.6 million sample tree from May 2021, we identify 589 recombination events, which indicate that around 2.7% of sequenced SARS-CoV-2 genomes have detectable recombinant ancestry. Recombination breakpoints are inferred to occur disproportionately in the 3' portion of the genome that contains the spike protein. Our results highlight the need for timely analyses of recombination for pinpointing the emergence of recombinant lineages with the potential to increase transmissibility or virulence of the virus. We anticipate that this approach will empower comprehensive real-time tracking of viral recombination during the SARS-CoV-2 pandemic and beyond.


Conflict of interest statement

R.L. works as an advisor to GISAID. The remaining authors declare no competing interests.

Figures

Fig. 1
Fig. 1. RIPPLES exhaustively searches for optimal parsimony improvements using partial interval placements.
a, A phylogeny with six internal nodes (labelled a–f), in which node f (in bold) is the one being investigated as a putative recombinant. The initial parsimony score of node f is 4, according to the multiple sequence alignment below the phylogeny, which shows the variation among samples and internal nodes. Note that internal nodes may not have corresponding sequences in reality but test for recombination using reconstructed ancestral genomes. bd, Three partial placements of the two intervals (grey cells indicate sites outside the interval) resulting from the breakpoints after site 5 (panel b), 9 (panel c) and 12 (panel d) respectively, along with their resulting parsimony scores. The dashed lines indicate the new branches resulting from the partial placements of f. Arrows mark sites that increase the sum parsimony of the two partial placements of f. The optimal partial placement and breakpoint prediction for node f is in the centre (c), with one breakpoint after site 9 and with partial placements both as a sibling of node c and as a descendant of node d.
Fig. 2
Fig. 2. RIPPLES detects an excess of recombination in the spike protein region.
a, The distribution of midpoints of each breakpoint’s prediction interval are shown as a density plot, with the underlying recombination prediction intervals plotted as individual lines in grey. We used the midpoint of the breakpoint prediction interval because recombination events can only be localized to prediction intervals, which are the regions between two recombination-informative SNPs. A dashed vertical line at position 20,875 delimits recombination rate regions identified by change-point analysis (Supplementary Text 15). The apparent lack of recombination towards the chromosome edges probably reflects a detection bias, which we describe above (Extended Data Fig. 2). bd, Recombination-informative sites (that is, positions where the recombinant node matches either but not both parent nodes) for three example recombinant trios detected by RIPPLES. The numbers to the left of each sequence correspond to the node identifiers from our MAT. b and d are examples of a recombinant with a single breakpoint (shown with dotted lines), c is an example of a recombinant with two breakpoints. bd were generated using the SNIPIT package (https://github.com/aineniamh/snipit).
Fig. 3
Fig. 3. RIPPLES uncovered evidence that the B.1.355 lineage might have resulted from a recombination event between lineages of B.1.595 and B.1.371.
a, Sub-phylogeny consisting of all 78 B.1.355 samples (purple) and the most closely related 78 samples to nodes 94,353 and 102,299 from lineages B.1.371 and B.1.595, respectively, using the ‘k nearest samples’ function in matUtils. Nodes 94353 (red) and 102299 (blue) are connected by dotted lines to node 94,354 (purple), the root of lineage B.1.355. Recombination-informative mutations are marked where they occur in the phylogeny, with those occurring in a parent but not shared by the recombinant sequence shown in grey. b, Recombination-informative sites (that is, sites where the recombinant node matches either but not both parent nodes) are shown following the same format as Fig. 2b–d. b was generated using the SNIPIT package (https://github.com/aineniamh/snipit).
Extended Data Fig. 1
Extended Data Fig. 1. Histogram of inferred and simulated recombination breakpoint positions.
A) True simulated breakpoints (red) are shown with all detected recombination interval midpoints (blue). Where blue bars exceed the height of red, it implies an excess rate of detection relative to the true rate of breakpoint positions. Likewise, where red bars exceed the height of blue, it implies a deficit. B) True simulated breakpoints (red) are shown with detected recombination interval midpoints for the 20% of the most closely related donor-acceptor pairs (blue). In both comparisons, we broke ties between equivalently improved partial phylogenetic placement parsimony scores by selecting the largest recombination intervals.
Extended Data Fig. 2
Extended Data Fig. 2. RIPPLES more easily detects breakpoints causing large changes in parsimony score.
The distribution of simulated breakpoints detected for each simulated sample is shown for each sample by A) initial parsimony score and B) minimum genetic distance from simulated sample to parent. Initial parsimony (A) is dependent upon the initial placement of the recombinant node in the tree and refers to the genetic distance in mutations between the recombinant node and its direct parent in the phylogeny. Minimum genetic distance from sample to parent (B) refers to the number of mutations relevant to recombination that separate the recombinant node from either the donor or the acceptor, and is not dependent on -the initial phylogeny. Similarly, among the simulated samples detected by RIPPLES, the detected and undetected breakpoints are shown by C) initial parsimony score and D) minimum genetic distance to parent. Detected samples and breakpoints are shown in black and undetected samples and breakpoints are shown in red. We condition on locating the true breakpoints and observing a significant parsimony score according to our phylogenetic null model. Therefore, we exclude recombination events with minimum starting parsimony scores and genetic distances of less than 3, as these are not significant under our null model.
Extended Data Fig. 3
Extended Data Fig. 3. Examples of detected trios filtered out due to sequence quality concerns.
A) Partial alignment of consensus sequences from a filtered recombinant trio of nodes 77695, 169585, and 77690, centred on site 28225, has consensus sequences of mostly 'N' spanning several sites meant to be informative of a recombination event. This can occur when many descendant samples have missing data. Mismatches between the three consensus sequences immediately flanking this region may be the result of poor sequencing quality as well. B) Partial alignment of consensus sequences from a filtered recombinant trio of nodes 173213, 173209, and 173274, centred on site 16846, has 7 recombination-informative mutations in an 8-nucleotide window that are unlikely to be true mutation events, but rather an alignment artifact or a complex indel event. C) Partial alignment of consensus sequences from a filtered recombinant trio of nodes 293461, 293460, and 211841, centred on site 29769, has 3 mismatches in a 5-nucleotide window, immediately flanked by a large gap in the alignment and are unlikely to be true mutations.
Extended Data Fig. 4
Extended Data Fig. 4. Recombinant ancestors exhibit increased spatial and temporal overlap.
A) Spatial and B) temporal overlap for our recombinant trios (in blue) and the null distribution (in gray), with Mann-Whitney Ranked-Sum p-values for the statistical increase in overlap for the recombinant ancestors shown on the top.
Extended Data Fig. 5
Extended Data Fig. 5. Ancestors of recombinants are genetically similar.
A) The initial parsimony scores for placements of putative (red) and simulated (blue) recombinant samples. B) The genetic distance between inferred (red) and simulated (blue) ancestor-donor pairs that gave rise to putative or simulated recombinants.

References

    1. Moutouh L, Corbeil J, Richman DD. Recombination leads to the rapid emergence of HIV-1 dually resistant mutants under selective drug pressure. Proc. Natl Acad. Sci. USA. 1996;93:6106–6111. doi: 10.1073/pnas.93.12.6106. - DOI - PMC - PubMed
    1. Golubchik T, et al. Pneumococcal genome sequencing tracks a vaccine escape variant formed through a multi-fragment recombination event. Nat. Genet. 2012;44:352–355. doi: 10.1038/ng.1072. - DOI - PMC - PubMed
    1. Schierup MH, Hein J. Consequences of recombination on traditional phylogenetic analysis. Genetics. 2000;156:879–891. doi: 10.1093/genetics/156.2.879. - DOI - PMC - PubMed
    1. Didelot X, Wilson DJ. ClonalFrameML: efficient inference of recombination in whole bacterial genomes. PLoS Comput. Biol. 2015;11:e1004041. doi: 10.1371/journal.pcbi.1004041. - DOI - PMC - PubMed
    1. Hodcroft EB, et al. Want to track pandemic variants faster? Fix the bioinformatics bottleneck. Nature. 2021;591:30–33. doi: 10.1038/d41586-021-00525-x. - DOI - PubMed

Publication types

Substances