. 2022 Sep;43(9):E19-E35.
doi: 10.3174/ajnr.A7586. Epub 2022 Aug 11.

Amyloid-Related Imaging Abnormalities with Emerging Alzheimer Disease Therapeutics: Detection and Reporting Recommendations for Clinical Practice

Affiliations

Amyloid-Related Imaging Abnormalities with Emerging Alzheimer Disease Therapeutics: Detection and Reporting Recommendations for Clinical Practice

P M Cogswell et al. AJNR Am J Neuroradiol. 2022 Sep.

Abstract

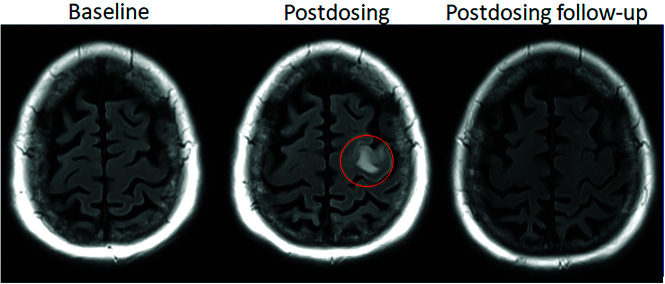
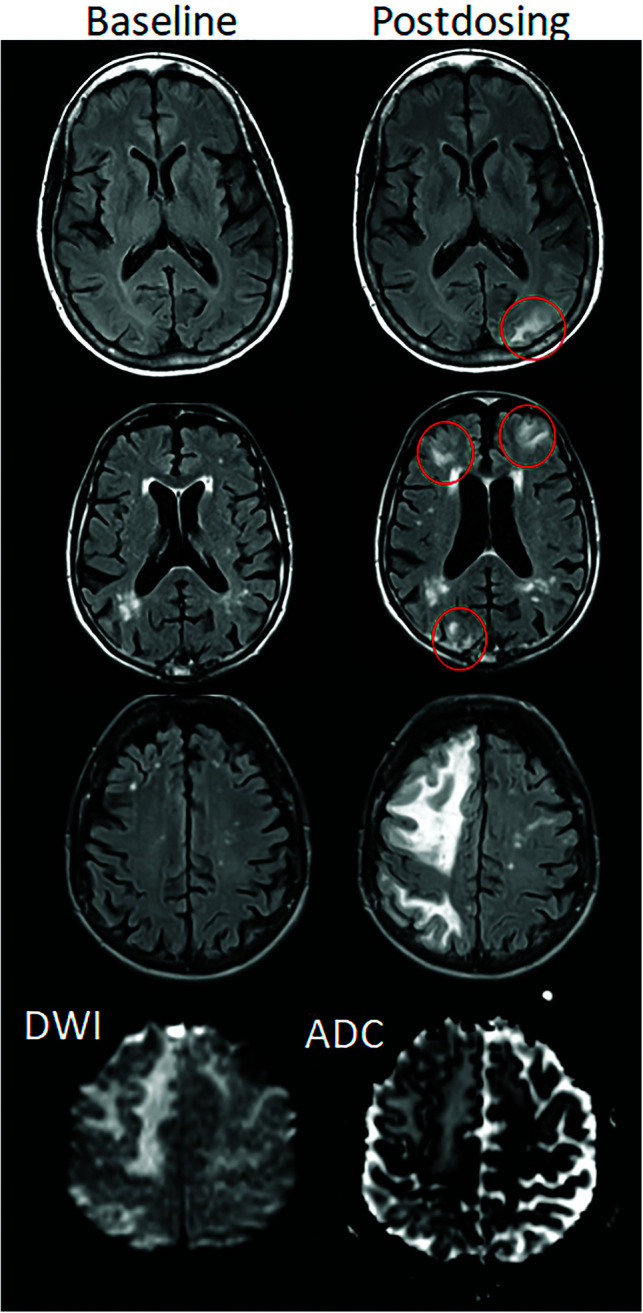
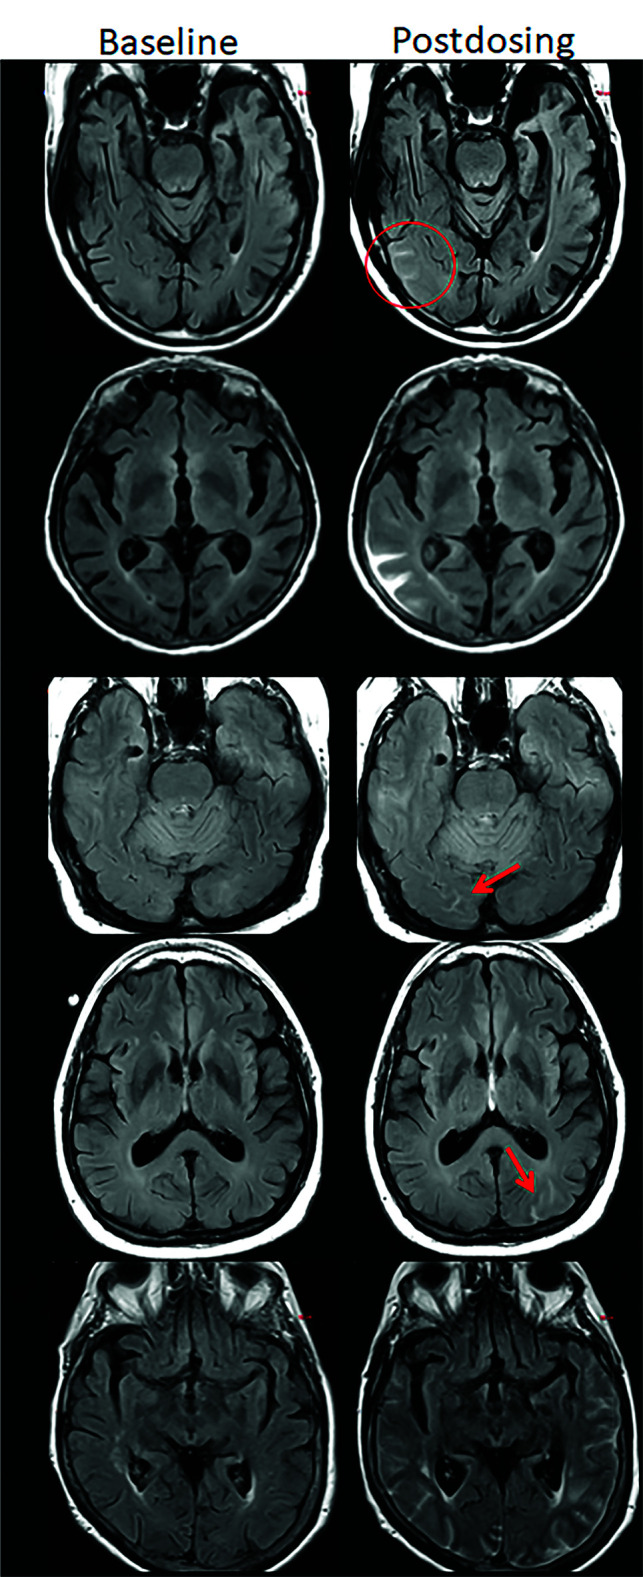
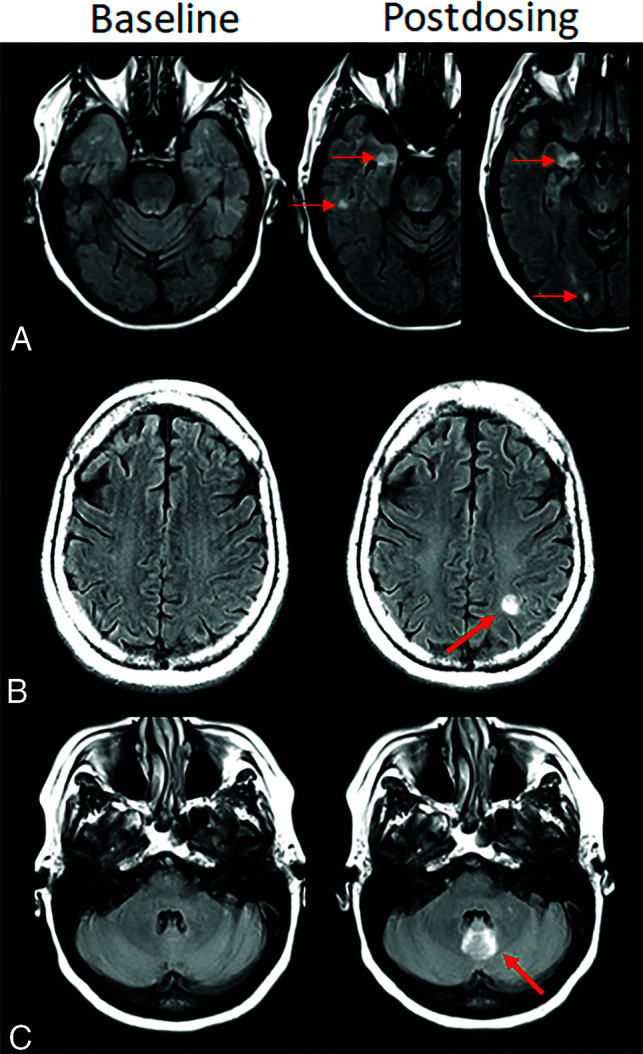
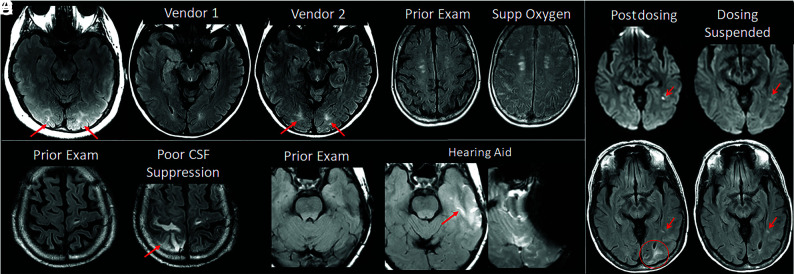
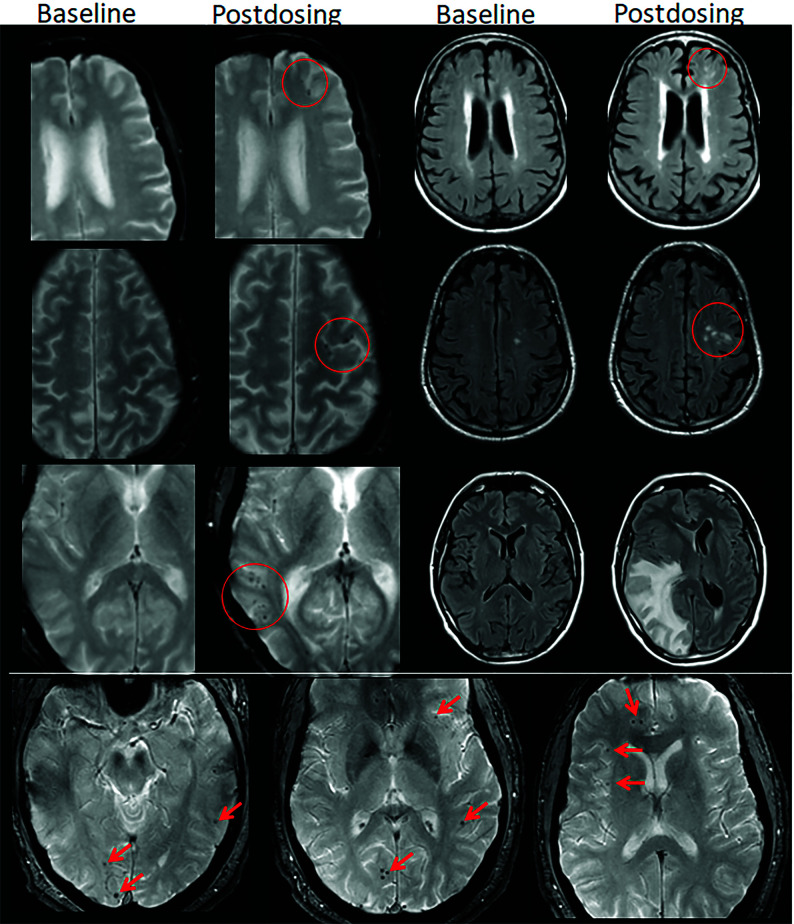
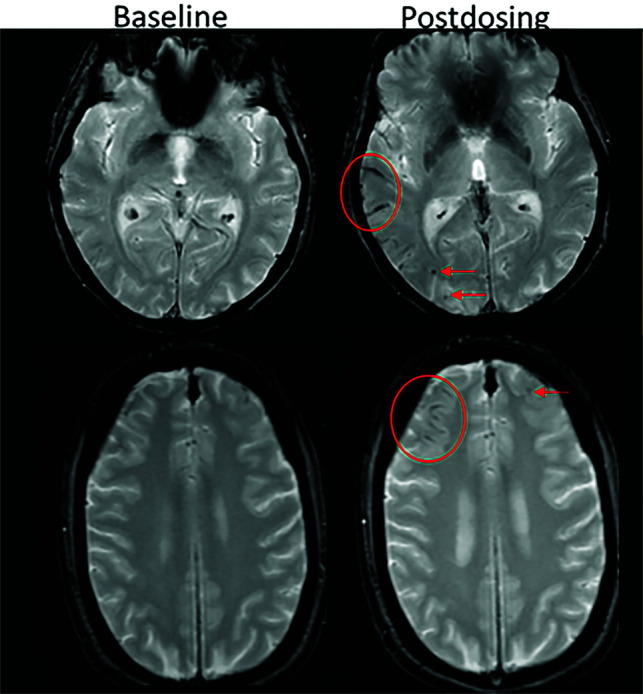
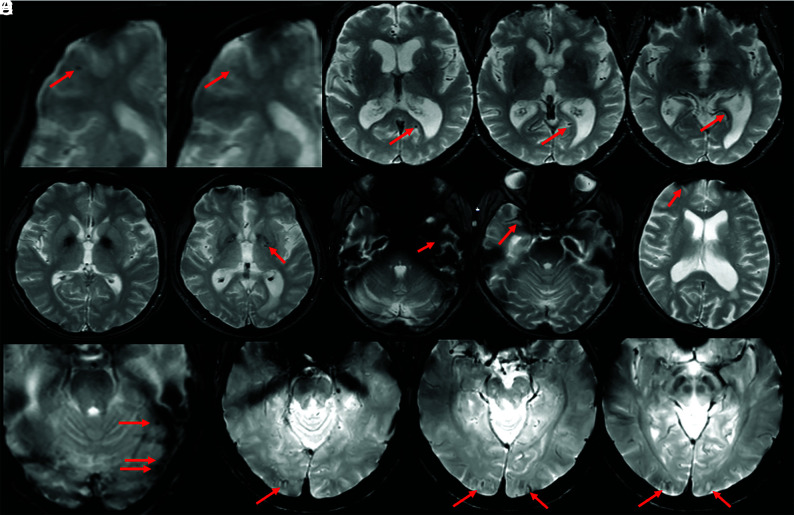
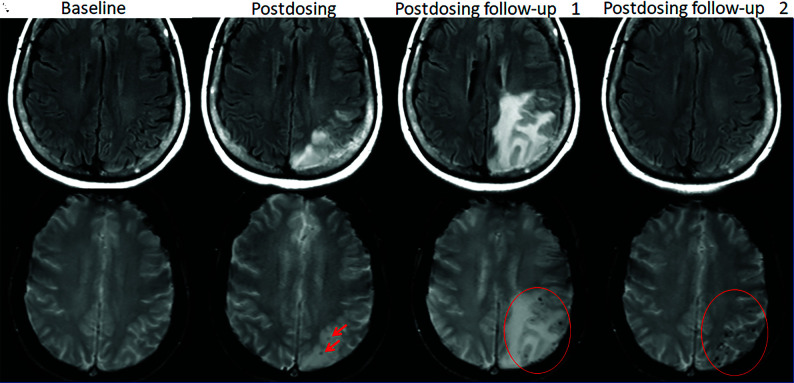
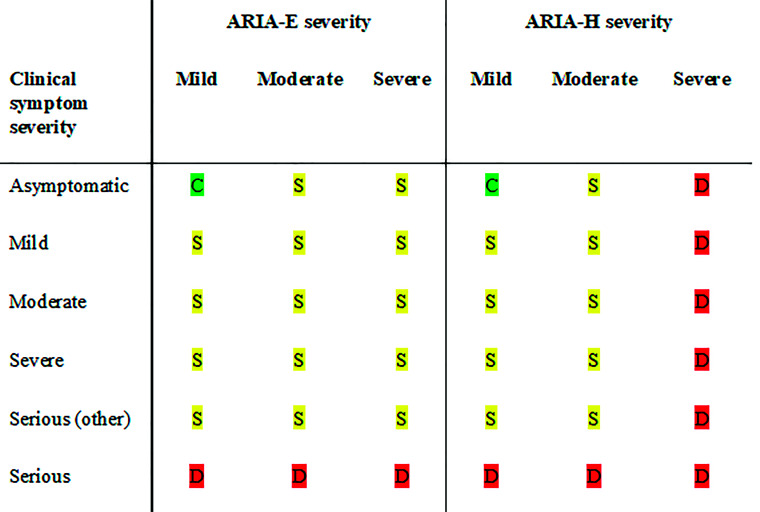
Monoclonal antibodies are emerging disease-modifying therapies for Alzheimer disease that require brain MR imaging for eligibility assessment as well as for monitoring for amyloid-related imaging abnormalities. Amyloid-related imaging abnormalities result from treatment-related loss of vascular integrity and may occur in 2 forms. Amyloid-related imaging abnormalities with edema or effusion are transient, treatment-induced edema or sulcal effusion, identified on T2-FLAIR. Amyloid-related imaging abnormalities with hemorrhage are treatment-induced microhemorrhages or superficial siderosis identified on T2* gradient recalled-echo. As monoclonal antibodies become more widely available, treatment screening and monitoring brain MR imaging examinations may greatly increase neuroradiology practice volumes. Radiologists must become familiar with the imaging appearance of amyloid-related imaging abnormalities, how to select an appropriate imaging protocol, and report findings in clinical practice. On the basis of clinical trial literature and expert experience from clinical trial imaging, we summarize imaging findings of amyloid-related imaging abnormalities, describe potential interpretation pitfalls, and provide recommendations for a standardized imaging protocol and an amyloid-related imaging abnormalities reporting template. Standardized imaging and reporting of these findings are important because an amyloid-related imaging abnormalities severity score, derived from the imaging findings, is used along with clinical status to determine patient management and eligibility for continued monoclonal antibody dosing.


Figures

FIG 1.
FIG 1.
Dynamic and transient nature of ARIA-E. Axial T2 FLAIR images over 3 sequential time points for a patient undergoing anti-amyloid monoclonal antibody therapy. On the postdosing examination (middle, red circle), there is FLAIR hyperintensity involving the left superior frontal cortex and subcortical white matter measuring <5 cm in transverse dimension (mild ARIA-E) that is new from the baseline examination. On the 1-month postdosing follow-up examination, performed to reassess the ARIA-E, the left frontal FLAIR hyperintensity had resolved, as is typically seen and in keeping with the transient nature of ARIA-E. Images courtesy of Biogen.
FIG 2.
FIG 2.
ARIA-E, parenchymal edema. Axial T2-FLAIR images from 3 separate patients at the time of the pretreatment baseline (left) and on a monitoring examination following initiation of anti-amyloid monoclonal antibody therapy (postdosing, right). A, On the postdosing examination, new T2-FLAIR hyperintense signal in the left parieto-occipital subcortical white matter with mild local mass effect and sulcal effacement measuring <5 cm the transverse dimension (mild ARIA-E, red circle). B, New multifocal, patchy T2-FLAIR hyperintense signal in the bifrontal and right occipital subcortical white matter on the postdosing examination, each region measuring <5 cm (red circles). A single region measuring <5 cm would be classified as mild, but >1 yields a classification of moderate ARIA-E. Multiplicity of ARIA-E involvement yields a classification of moderate, as long as each region is <10 cm in diameter. In some regions, there is involvement of the cortex, mild local mass effect, and gyral swelling. C, On the postdosing examination, development of extensive T2-FLAIR hyperintense signal throughout the right frontal and parietal lobes measuring >10 cm (severe ARIA-E). Associated mass effect and sulcal effacement throughout much of the right cerebral hemisphere. Hyperintense signal on DWI (lower left) is confirmed to be T2 shinethrough on the ADC map (lower right), differentiating ARIA-E from acute ischemia or other cause of cytotoxic edema. Images courtesy of Biogen and the Dominantly Inherited Alzheimer Network.
FIG 3.
FIG 3.
ARIA-E, sulcal effusion. Axial T2-FLAIR images from 4 separate patients at pretreatment baseline (left) and on a monitoring examination following initiation of anti-amyloid monoclonal antibody therapy (postdosing, right). A, Compared with the baseline examination, new sulcal T2-FLAIR hyperintense signal in the right temporal-occipital lobe measuring <5 cm in transverse dimensions (mild ARIA-E, red circle). B, Postdosing, new T2-FLAIR sulcal effusion involving the right posterior temporal and parietal lobes measuring 5–10 cm (moderate ARIA-E). C, Subtle multifocal, bi-occipital, sulcal effusion on the postdosing examination, each region measuring <5 cm (moderate ARIA-E, red arrows). A single region of ARIA-E measuring <5 cm would be classified as mild, but >1 cm yields a classification of moderate. Multiplicity of ARIA-E involvement yields a classification of moderate, as long as each region is <10 cm in diameter. Identification of these subtle abnormalities requires careful comparison with prior monitoring and/or baseline examination. D, Postdosing, extensive T2-FLAIR sulcal effusion involving the bilateral temporal and occipital lobes measuring ≥10 cm in extent (severe ARIA-E). Images courtesy of Biogen and the Dominantly Inherited Alzheimer Network.
FIG 4.
FIG 4.
Atypical ARIA-E, parenchymal edema. Axial T2-FLAIR images from 3 separate patients at pretreatment baseline (left) and on a monitoring examination following initiation of anti-amyloid monoclonal antibody therapy (postdosing, right). A, Adjacent slices on postdosing T2-FLAIR show development of multiple nodular areas of ARIA-E (red arrows). This nodular presentation is less commonly encountered in contrast to the typical ARIA-E, which has an amorphous parenchymal pattern as expected for vasogenic edema. In this case, although each area of ARIA-E is small (<5 cm), the multiplicity of lesions yields a classification of moderate ARIA-E. B, Atypical ARIA-E as a rounded focus of T2-FLAIR hyperintense signal in the left parietal white matter (left, red arrow) that may be mistaken for neoplastic process and differentiated by the time course of appearance coinciding with monoclonal antibody dosing and subsequent resolution. C, Atypical ARIA-E in the cerebellar vermis. Postdosing, new T2-FLAIR hyperintense signal in the cerebellar vermis (red arrow), a less common location for ARIA-E relative to the cerebral hemispheres. Although ARIA-E has a slight predilection for the parieto-occipital lobes, similar to posterior reversible encephalopathy, any part of the brain may be affected. Images courtesy of Biogen and the Dominantly Inherited Alzheimer Network.
FIG 5.
FIG 5.
ARIA-E interpretation pitfalls and mimics. A, Shading artifacts with prescan normalize inadvertently turned off, results in T2-FLAIR hyperintense signal in the bilateral occipital white matter (red arrows) that mimics ARIA-E (edema). B, Axial T2-FLAIR images from 2 time points with the 2 scans performed on different vendors. T2-FLAIR hyperintense signal in the bilateral occipital white matter on vendor 2 (red arrows) appears to be new from the prior examination on vendor 1 and may be mistaken for subtle ARIA-E. The participant returned for repeat imaging on vendor 1, and the apparent abnormality was resolved (not shown). C, Diffuse sulcal T2-FLAIR hyperintense signal with administration of supplemental oxygen mimics ARIA-E effusion. The abnormality resolved on repeat imaging without supplemental oxygen. D, Poor CSF suppression results in artifactual sulcal T2-FLAIR hyperintense signal mimicking ARIA-E (red arrow) and was confirmed to be artifacts by resolution on immediate repeat imaging with optimized parameters. E, Susceptibility artifacts from a hearing aid results in apparent T2-FLAIR hyperintense signal (red arrow), new from the prior examination on which the patient’s hearing aid was not in place. The third image in this set is the GRE scan showing the marked signal void artifacts from the hearing aid. The resulting susceptibility effect results in incomplete water suppression on T2-FLAIR, and the resulting artifacts mimic ARIA-E. F, Patient with left occipital subcortical T2-FLAIR hyperintense signal on the postdosing monitoring examination (mild ARIA-E, circle), which resolved on the follow-up monitoring scan. Separate subcentimeter focus of periventricular T2 signal with associated diffusion restriction (arrow, left) was consistent with an incidental acute/subacute infarct that showed expected evolution on the postdosing follow-up examination (right). Images courtesy of Biogen and the Dominantly Inherited Alzheimer Network. Supp indicates supplemental.
FIG 6.
FIG 6.
ARIA-H, microhemorrhage. Baseline and postdosing GRE (left, A–C) and T2-FLAIR (right, A–C) for 3 patients. A, Postdosing, few (<5) new peripheral left frontal microhemorrhages (mild ARIA-H, red circle) that occur with new patchy T2-FLAIR hyperintense signal in that region (mild ARIA-E, red circle). B, Postdosing, 5 treatment-emergent microhemorrhages (moderate ARIA, red circle) that occurred with regional mild ARIA-E edema (red circle). C, Postdosing, ≥10 new microhemorrhages (severe ARIA-H, red circle). Associated extensive right cerebral hemisphere T2-FLAIR hyperintense signal involving the cortex and subcortical white matter with mass effect and midline shift (severe ARIA-E). D, At least 12 treatment-emergent cerebral microhemorrhages (severe ARIA-H, red arrows) without ARIA-E. In comparison with case C, these microhemorrhages are scattered, rather than clustered. Regional distribution of microhemorrhages may vary, and both cases C and D are severe ARIA-H and would prompt discontinuation of anti-amyloid therapy per current guidelines. Images courtesy of Biogen and the Dominantly Inherited Alzheimer Network.
FIG 7.
FIG 7.
ARIA-H, superficial siderosis. Axial T2*-GRE imaging from 2 patients at baseline and postdosing. A, Postdosing, new right temporal superficial siderosis, which involves contiguous sulci when viewed over multiple slices (mild ARIA-H, siderosis, red circle). This patient also had 2 treatment-emergent microhemorrhages in the right occipital lobe (mild ARIA-H, microhemorrhage, red arrows). B, Two regions of treatment-emergent superficial siderosis in the right greater-than-left frontal lobes (moderate ARIA-H, red circle and arrow). Images courtesy of Biogen.
FIG 8.
FIG 8.
ARIA-H interpretation pitfalls. A, Motion and partial volume effects (right) result in poor visualization of a previously documented right frontal microhemorrhage (left, red arrow). B, Vessel in profile mimics a microhemorrhage on a single section (left, red arrow) but can be traced as a vessel flow void on adjacent slices (right, arrow). C, Deep gray mineralization is often confluent and ill-defined (left) and may be clearly differentiated from a microhemorrhage. However, when punctate, senescent mineralization may mimic a microhemorrhage (right, arrow). D, Bulk susceptibility effects preclude evaluation of the inferior temporal lobes adjacent to the mastoids and sinuses (arrows). E, Susceptibility artifacts may appear as punctate foci (arrows) adjacent to obvious susceptibility areas. Therefore, punctate foci of susceptibly in these regions should be interpreted with caution and in correlation with prior examinations. F, Phase artifacts, especially about the torcula (red arrows), can mimic microhemorrhages/siderosis and may be differentiated by recognition of the shape of the torcula repeating in the phase direction. Images courtesy of Biogen.
FIG 9.
FIG 9.
ARIA-E and -H. Patient on anti-amyloid therapy who developed ARIA-E (T2-FLAIR, A–D) and ARIA-H microhemorrhages (T2*-GRE, E–H). On postdosing T2-FLAIR (B), new left parietal T2-FLAIR hyperintense signal involving the cortex and subcortical white matter with associated local mass effect, consisting of sulcal effacement and gyral expansion. Despite suspension of dosing, the extent of T2-FLAIR abnormality and mass effect progressed at the postdosing follow-up No. 1 (1 month). ARIA-E resolved by postdosing follow-up No. 2 (2 months). On postdosing T2*-GRE, 2 new, treatment-emergent microhemorrhages (mild ARIA-H, F, red arrows) that increased in number over postdosing follow-up examinations with severe ARIA-H at postdosing follow-up No. 2 (H, red circle).
FIG 10.
FIG 10.
Patient management based on ARIA severity and clinical symptoms. ARIA-H management rules are the same for each severity of microhemorrhages and superficial siderosis. C (green) indicates continue dosing at current dose and schedule; S (yellow), suspend dosing; resume dosing at same dose once ARIA-E resolved or ARIA-H stable and clinical symptoms resolve; D (red), discontinue dosing; Serious (other), medical event unrelated to anti-amyloid therapy.

Comment in

References

    1. Rajan KB, Weuve J, Barnes LL, et al. . Population estimate of people with clinical Alzheimer’s disease and mild cognitive impairment in the United States (2020-2060). Alzheimers Dement 2021;17:1966–75 10.1002/alz.12362 - DOI - PMC - PubMed
    1. ADUHELM®. (aducanumab-avwa) is FDA Approved for Healthcare Professionals. https://biogencdn.com/us/aduhelm-pi.pdf. Accessed June 7, 2021
    1. Honce JM, Nagae L, Nyberg E. Neuroimaging of natalizumab complications in multiple sclerosis: PML and other associated entities. Mult Scler Int 2015;2015:e80925 10.1155/2015/809252 - DOI - PMC - PubMed
    1. Wattjes MP, Vennegoor A, Steenwijk MD, et al. . MRI pattern in asymptomatic natalizumab-associated PML. J Neurol Neurosurg Psychiatry 2015;86:793–98 10.1136/jnnp-2014-308630 - DOI - PubMed
    1. Jack CR, Bennett DA, Blennow K, et al. . NIA-AA Research Framework: toward a biological definition of Alzheimer’s disease. Alzheimers Dement 2018;14:535–62 10.1016/j.jalz.2018.02.018 - DOI - PMC - PubMed