Review
. 2022 Dec:426:108586.
doi: 10.1016/j.heares.2022.108586. Epub 2022 Jul 22.

Underlying neural mechanisms of degraded speech intelligibility following noise-induced hearing loss: The importance of distorted tonotopy

Affiliations
Review

Underlying neural mechanisms of degraded speech intelligibility following noise-induced hearing loss: The importance of distorted tonotopy

Satyabrata Parida et al. Hear Res. 2022 Dec.

Abstract

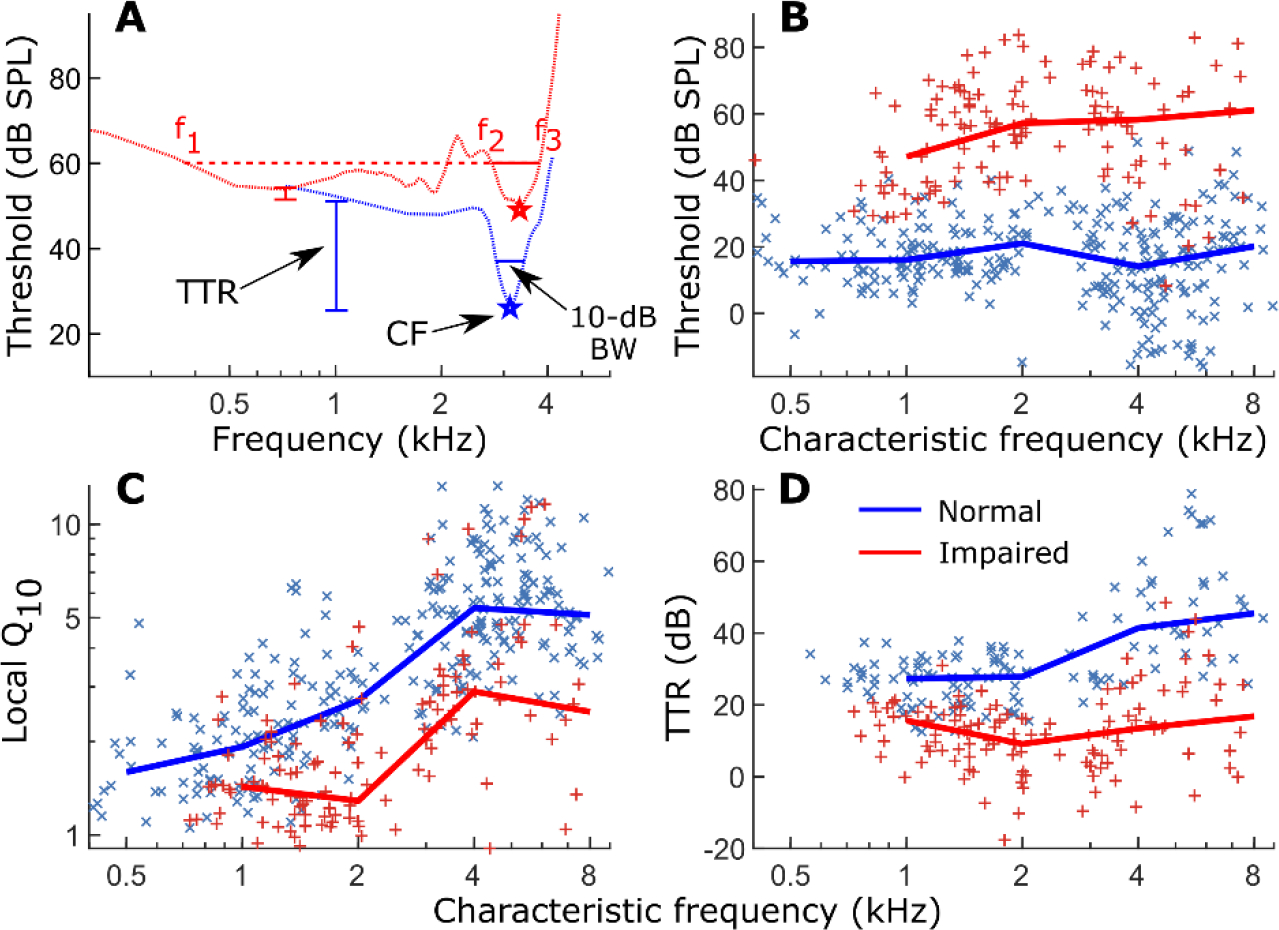
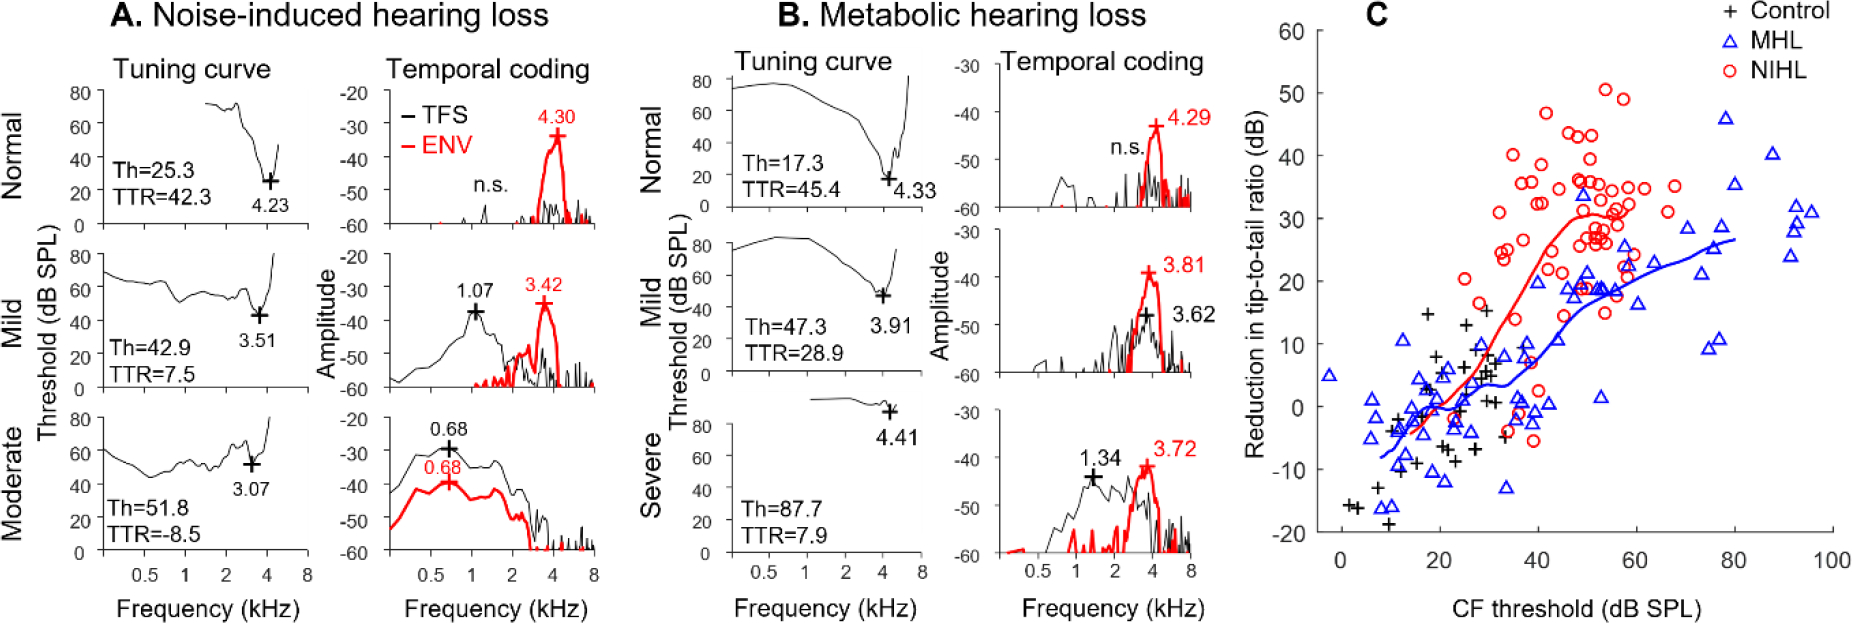
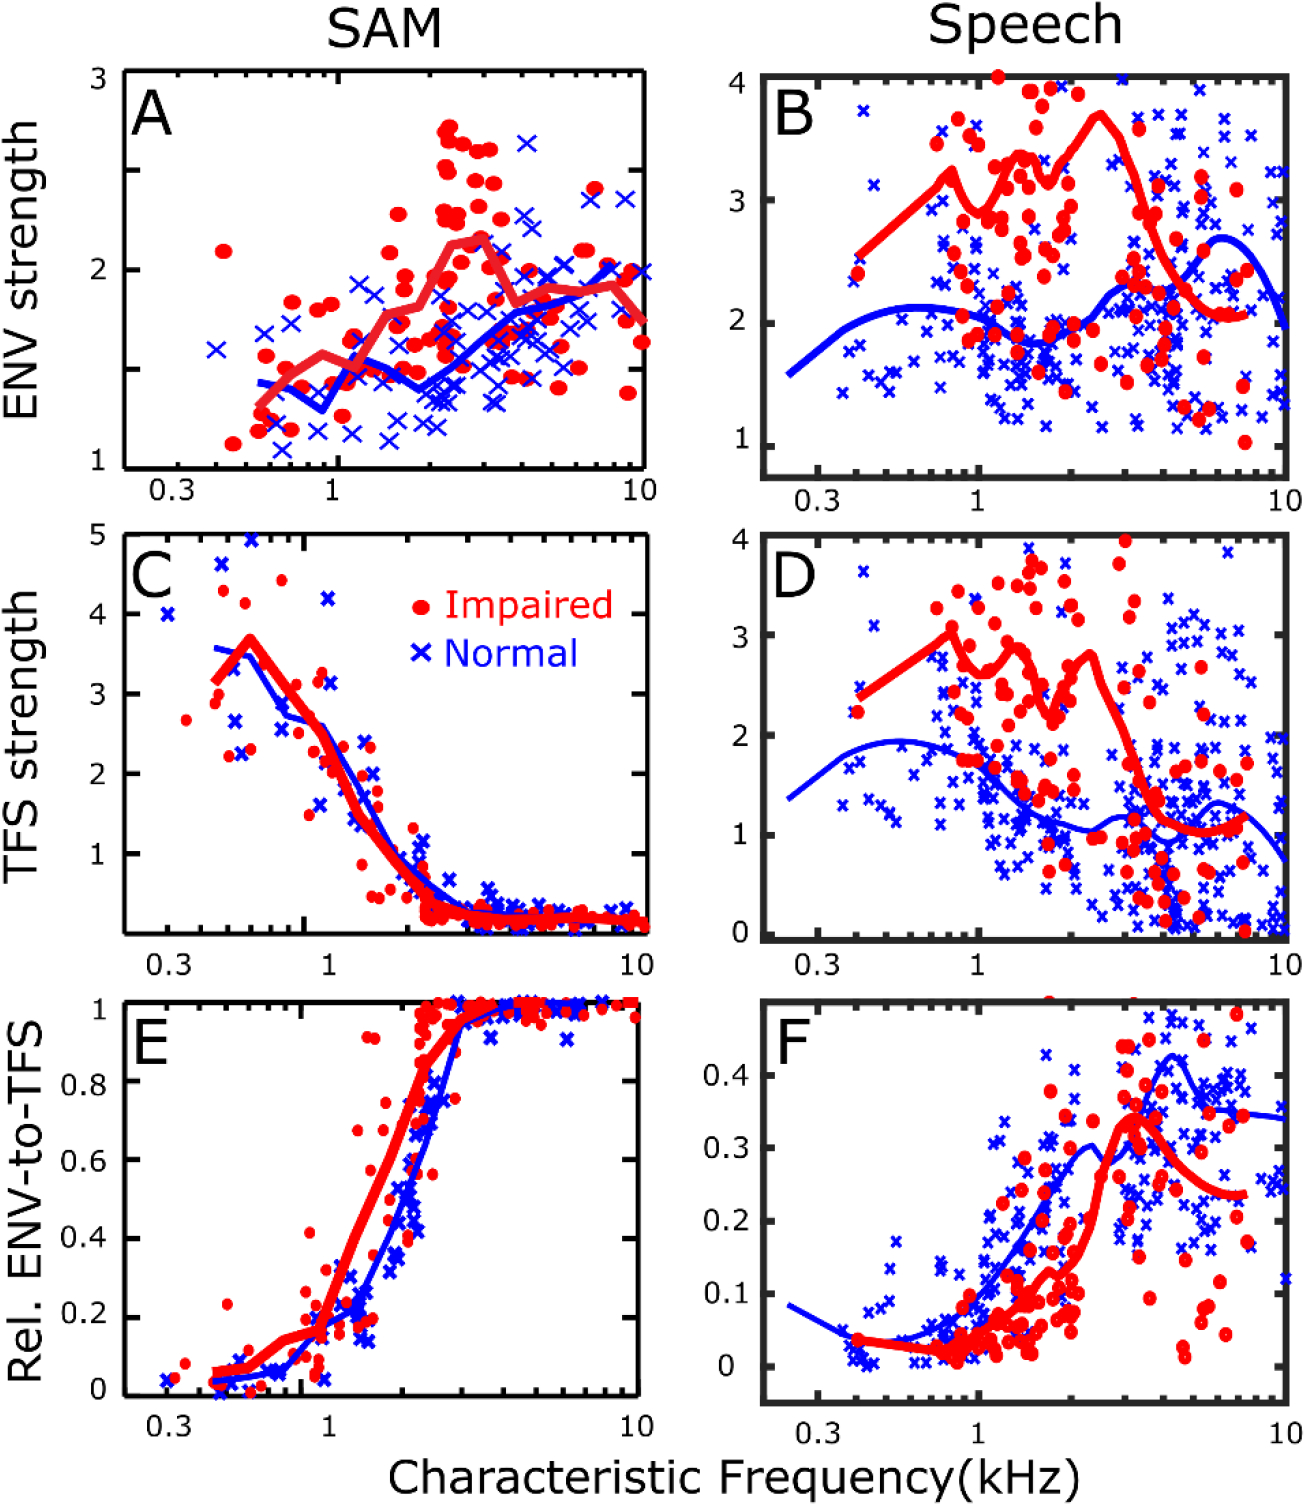
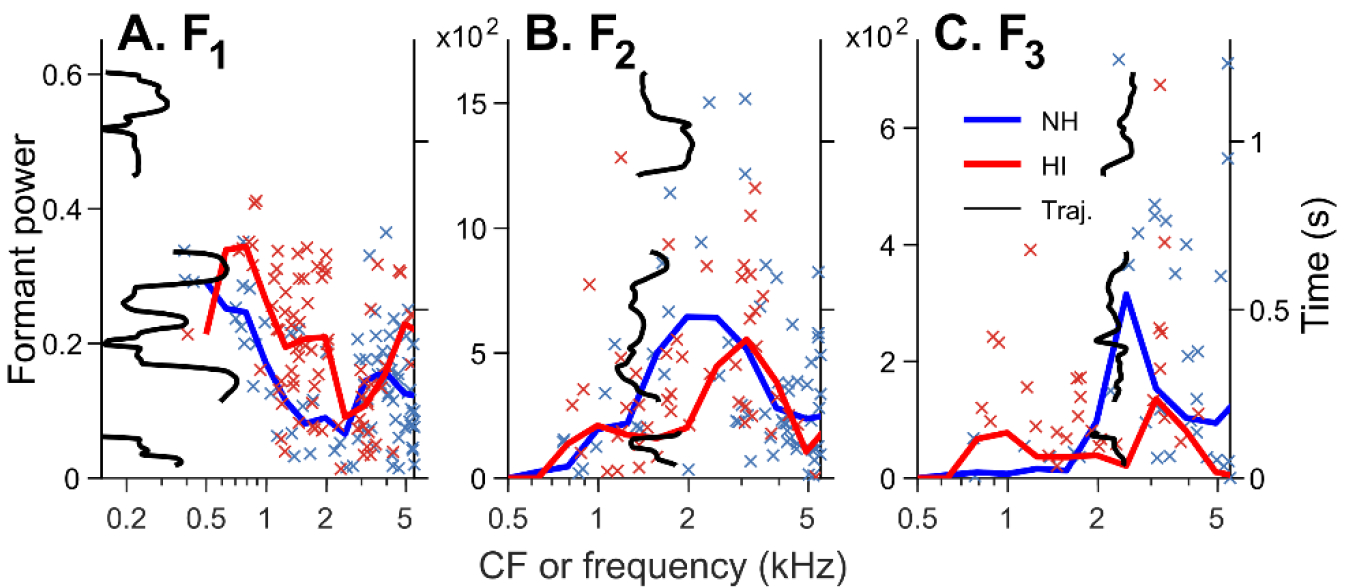
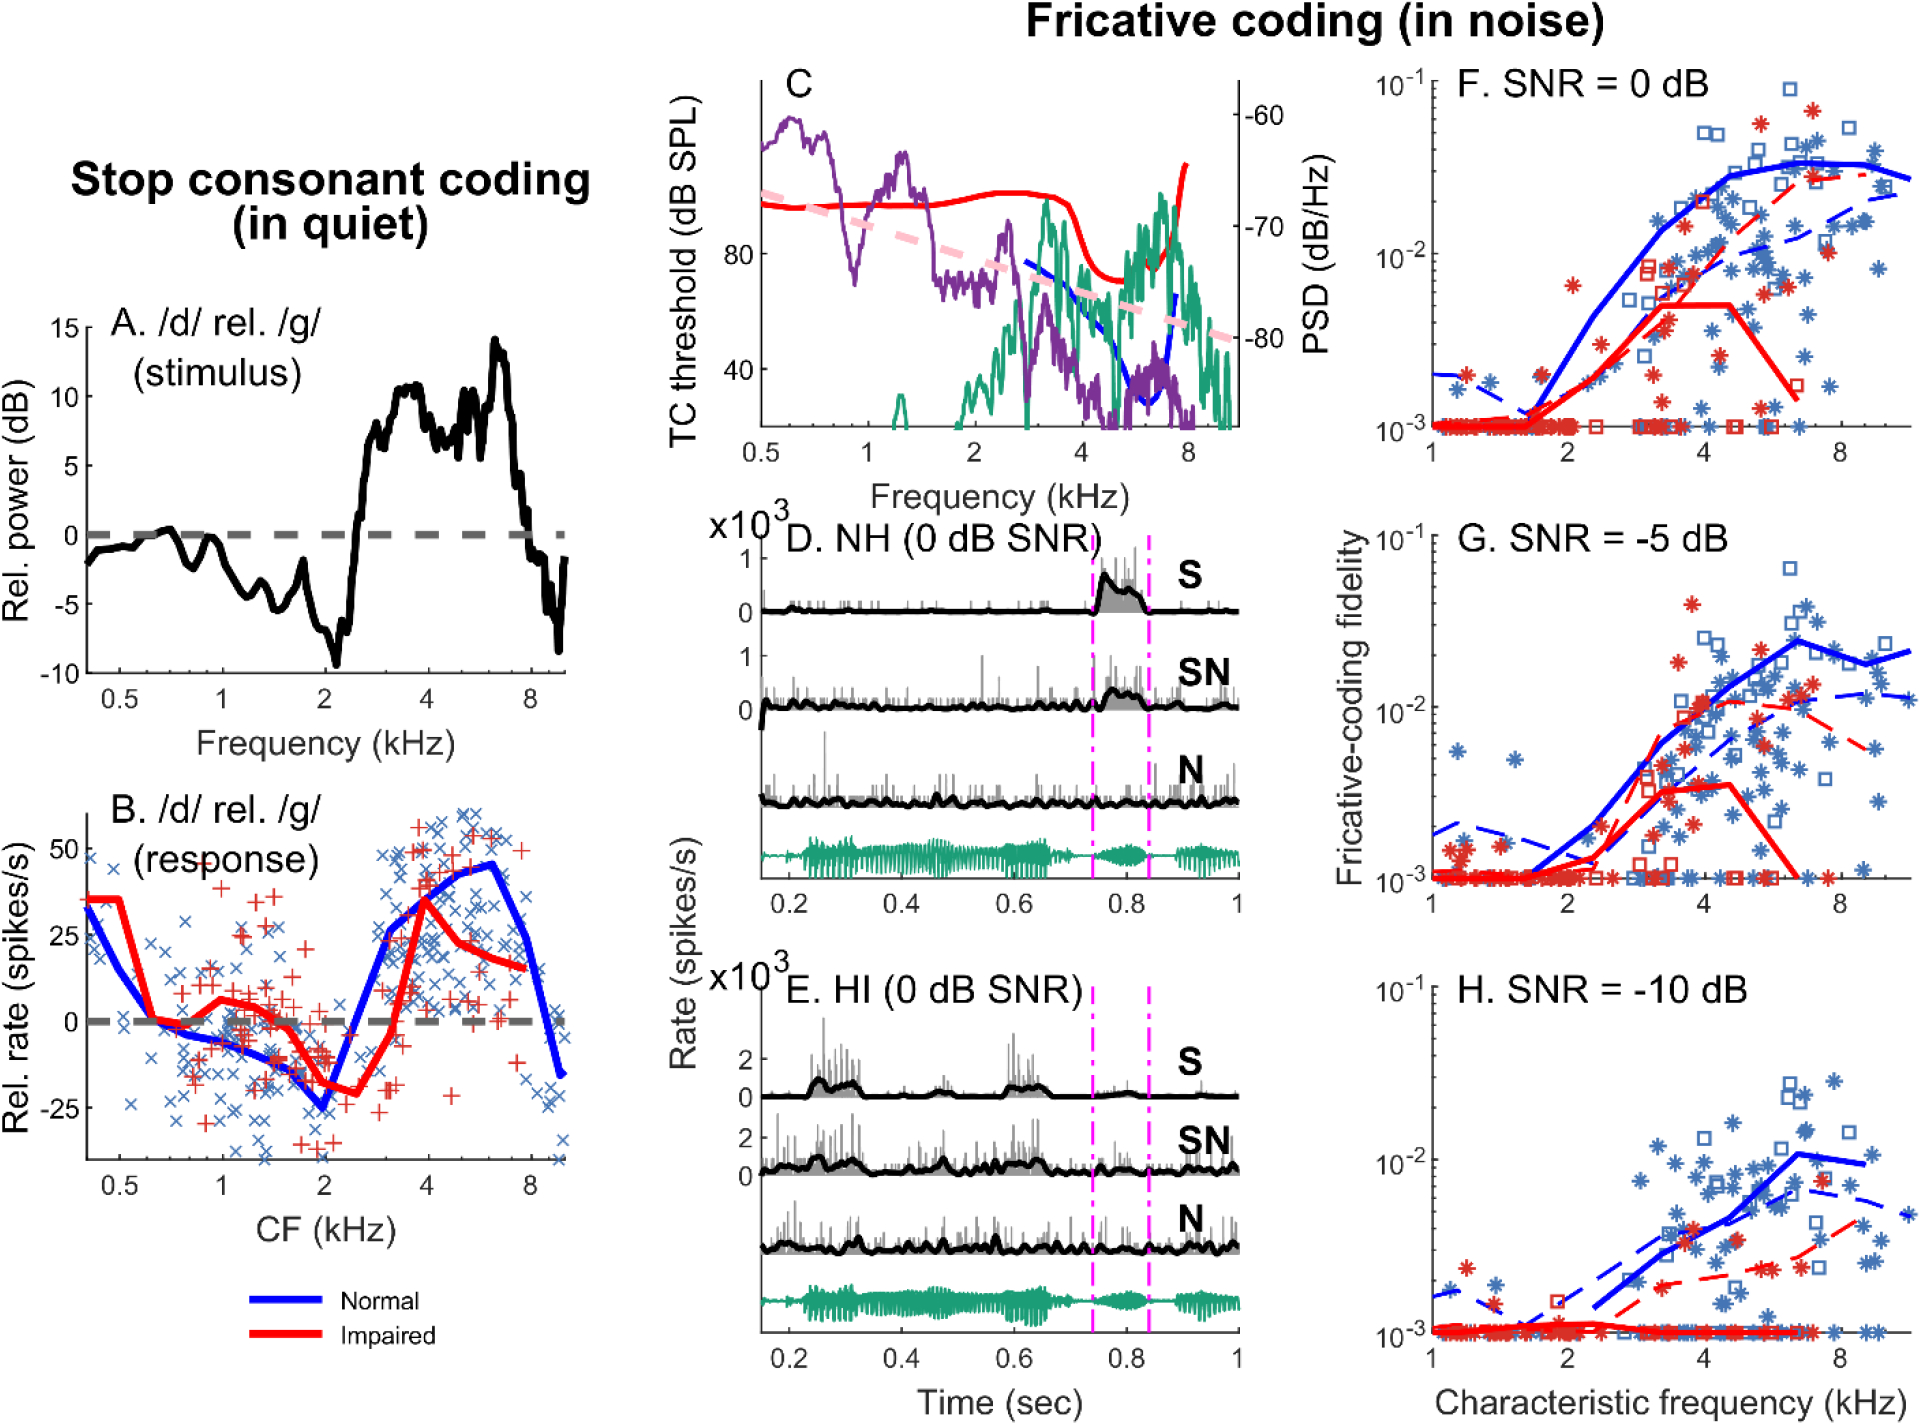
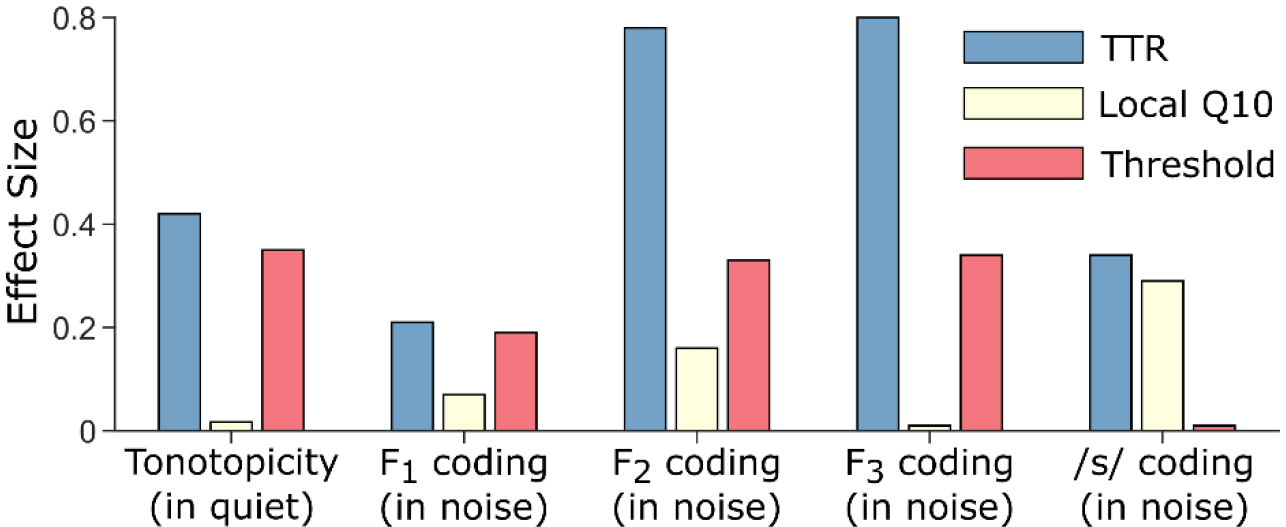
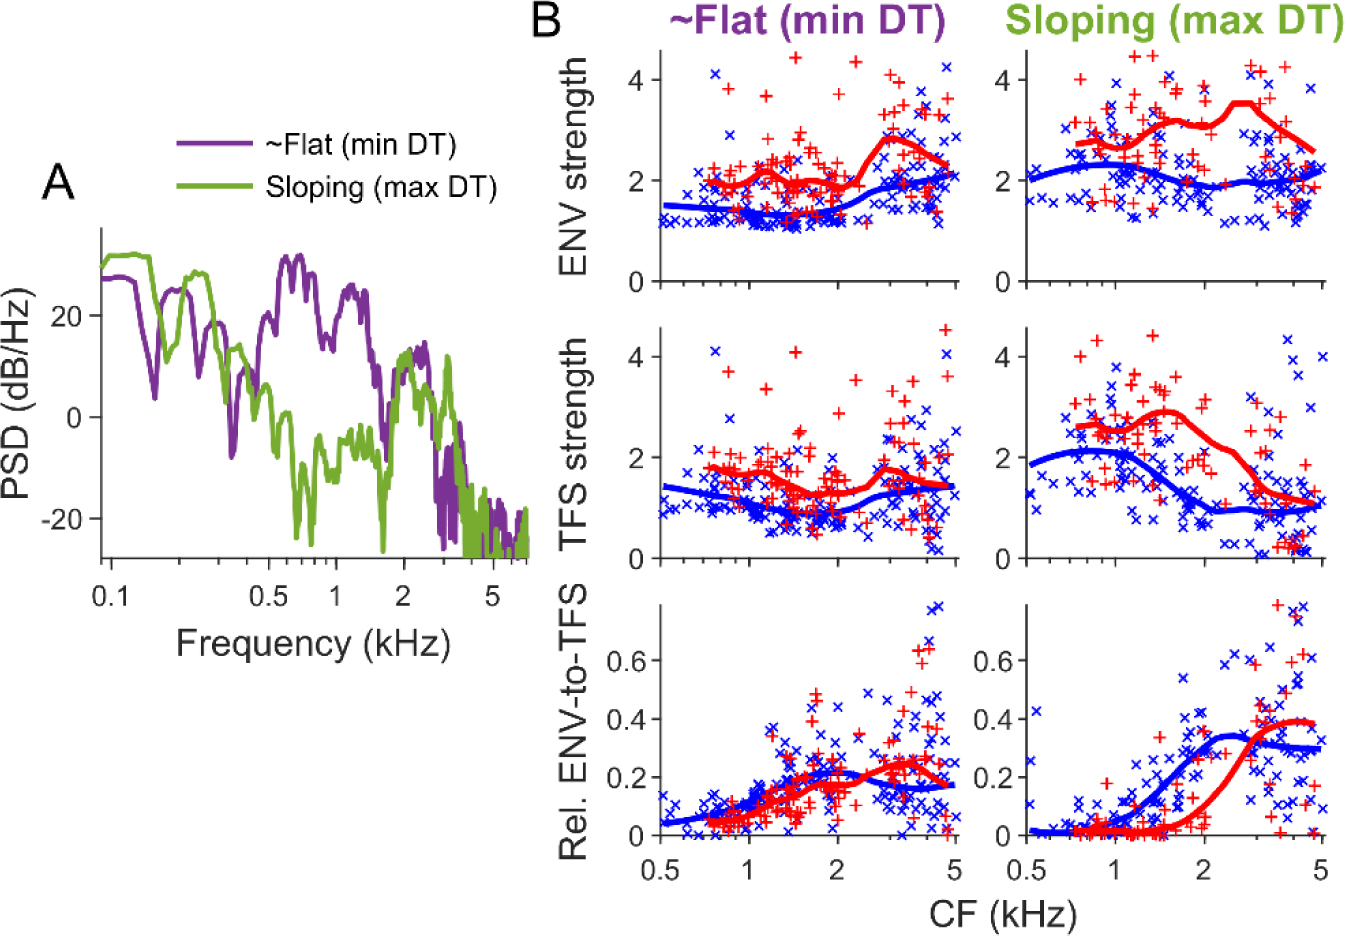
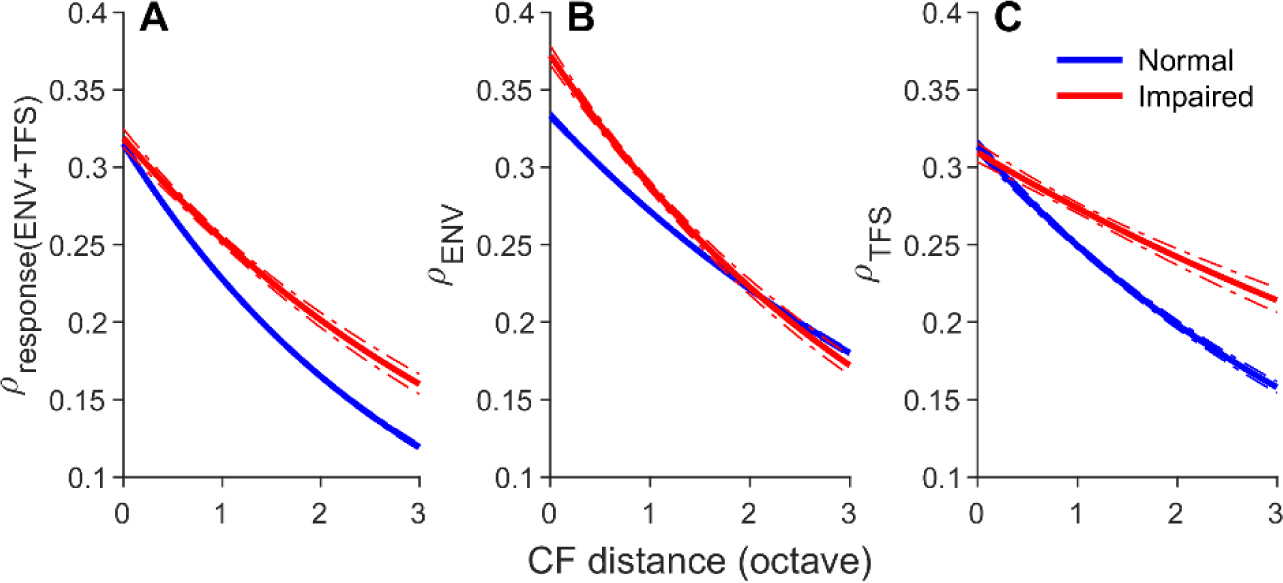
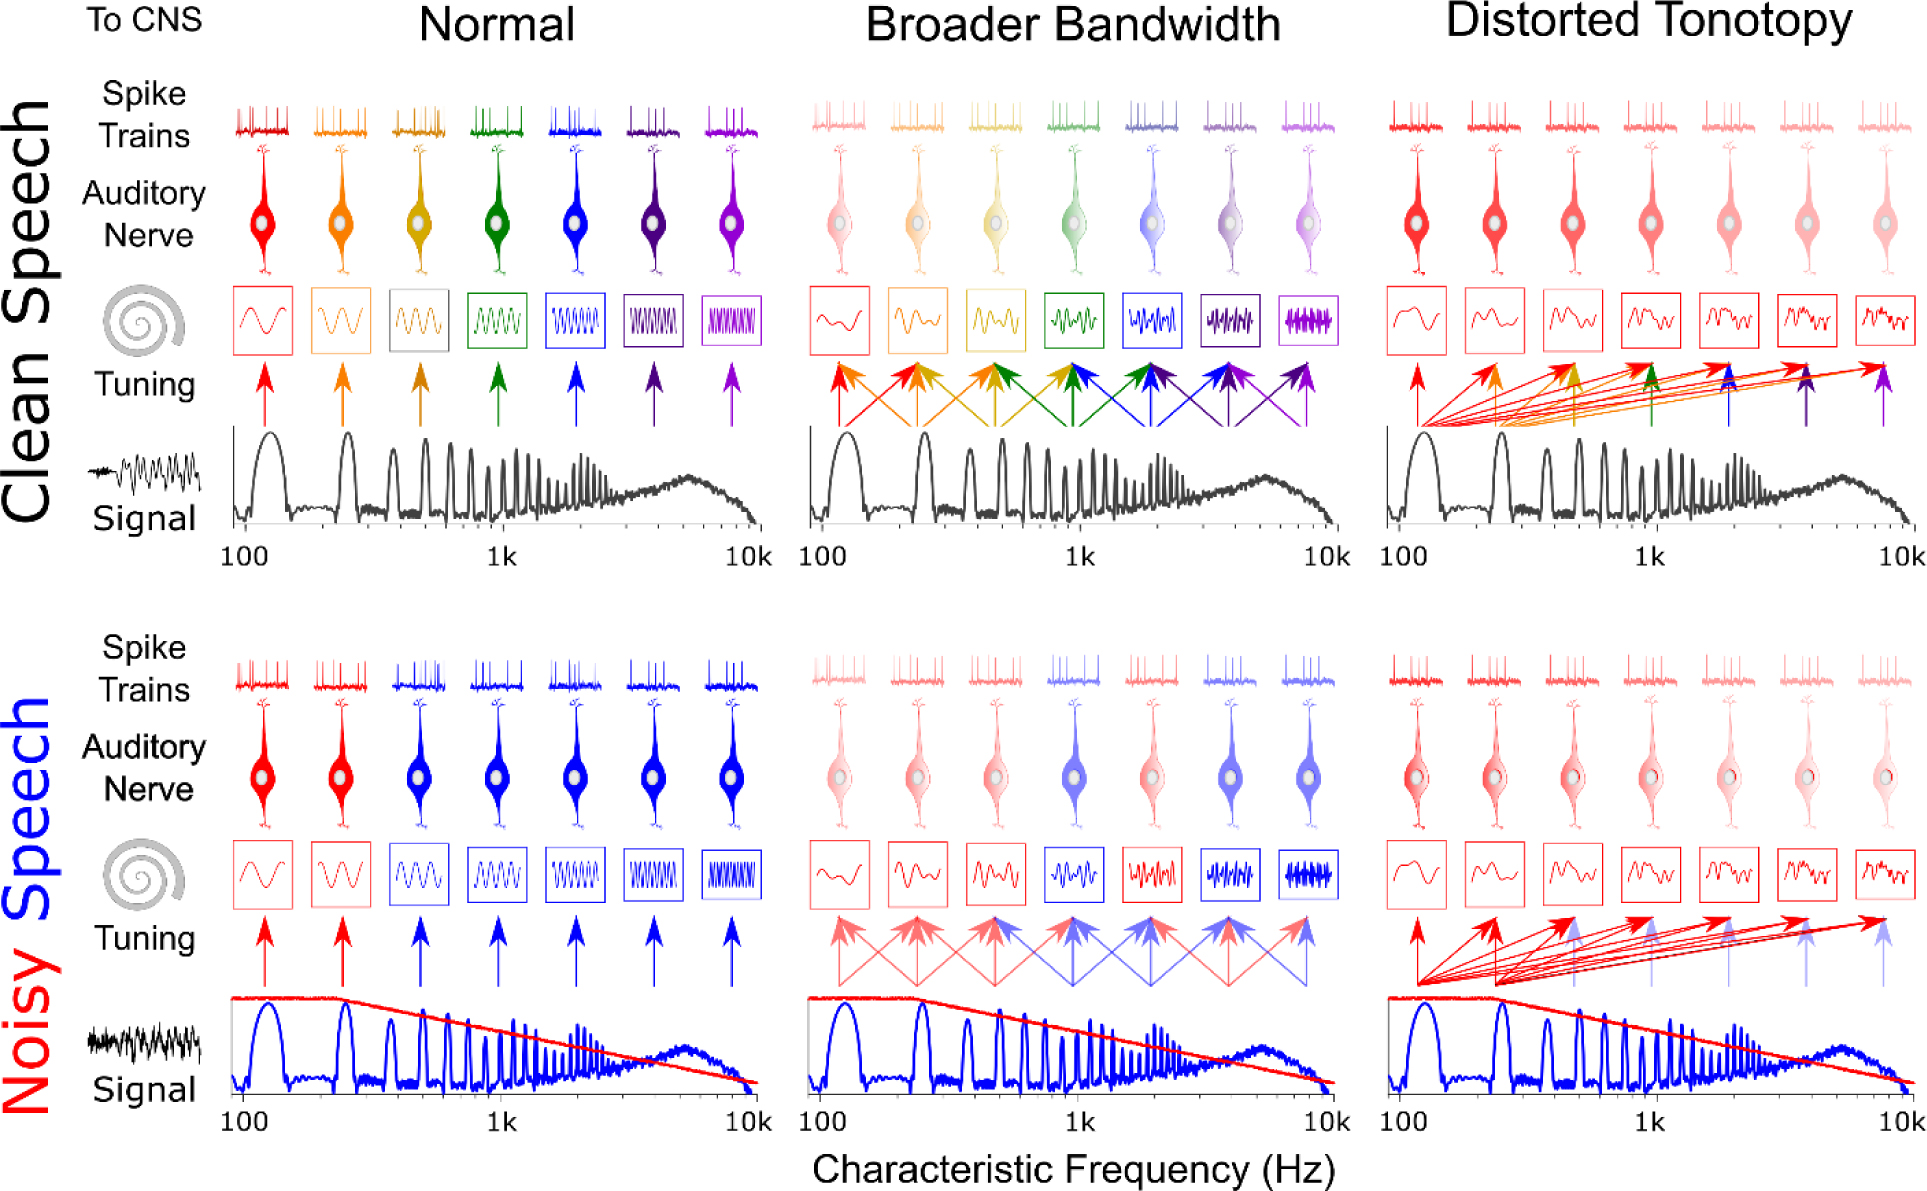
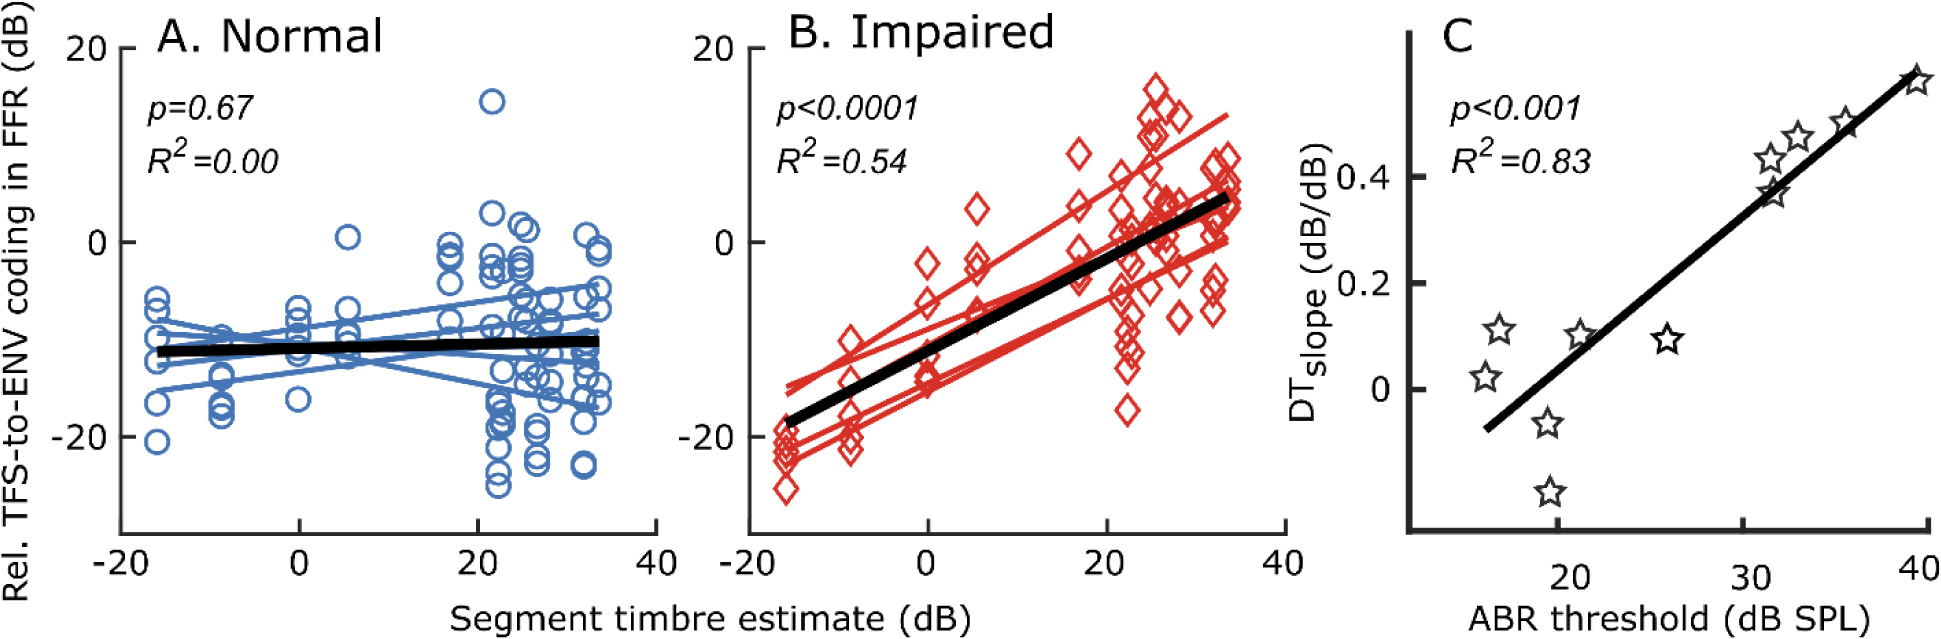
Listeners with sensorineural hearing loss (SNHL) have substantial perceptual deficits, especially in noisy environments. Unfortunately, speech-intelligibility models have limited success in predicting the performance of listeners with hearing loss. A better understanding of the various suprathreshold factors that contribute to neural-coding degradations of speech in noisy conditions will facilitate better modeling and clinical outcomes. Here, we highlight the importance of one physiological factor that has received minimal attention to date, termed distorted tonotopy, which refers to a disruption in the mapping between acoustic frequency and cochlear place that is a hallmark of normal hearing. More so than commonly assumed factors (e.g., threshold elevation, reduced frequency selectivity, diminished temporal coding), distorted tonotopy severely degrades the neural representations of speech (particularly in noise) in single- and across-fiber responses in the auditory nerve following noise-induced hearing loss. Key results include: 1) effects of distorted tonotopy depend on stimulus spectral bandwidth and timbre, 2) distorted tonotopy increases across-fiber correlation and thus reduces information capacity to the brain, and 3) its effects vary across etiologies, which may contribute to individual differences. These results motivate the development and testing of noninvasive measures that can assess the severity of distorted tonotopy in human listeners. The development of such noninvasive measures of distorted tonotopy would advance precision-audiological approaches to improving diagnostics and rehabilitation for listeners with SNHL.

Keywords: Auditory nerve; Distorted tonotopy; Hearing loss; Speech coding; Speech intelligibility; Temporal coding.


Conflict of interest statement

Declaration of Competing Interest The authors declare no competing interests.

Figures

Fig. 1.
Fig. 1.. NIHL leads to elevated AN fiber threshold, broader tuning, and reduced tip-to-tail ratio.
(A) Example FTCs for a normal (blue) and an impaired (red) AN fiber. CF (stars), 10-dB bandwidth (horizontal lines), and TTR (vertical bars) are indicated for both fibers. For the impaired fiber, local 10-dB bandwidth is f3-f2, whereas global 10-dB bandwidth is f3-f1. These local and global bandwidths are used to estimate local and global Q10(=CF/BW), respectively. (B-D) Following NIHL, AN-fiber threshold is elevated, cochlear tuning sharpness (local Q10) is reduced (i.e., broader bandwidth), and TTR is reduced. NIHL was induced with an octave-band noise centered at 500 Hz, played to male chinchillas for 2 hours at 116 dB SPL. Data in B, C, and D replotted from Parida and Heinz, 2022a. BW, bandwidth; FTC, frequency tuning curve; CF, characteristic frequency; TTR, tip-to-tail ratio.
Fig. 2.
Fig. 2.. Distorted tonotopy varies across hearing loss etiology.
(A) Frequency tuning curve (left) and temporal coding strength of ENV and TFS (right) as a function of frequency for three exemplar AN fibers (different rows: one normal, two with NIHL of varying degrees). ENV and TFS coding were quantified using Wiener kernel analyses (Henry et al., 2019). (B) Same as A, but for metabolic hearing loss (MHL) due to reduced endocochlear potential. While distorted tonotopic TFS coding occurs even with mild NIHL, such distortions occur only after severe MHL. ENV coding is typically tonotopically distorted after moderate NIHL but may still be tonotopic even with severe MHL. (C) Tip-to-tail ratio, which is correlated with these tonotopic distortions of ENV and TFS, is more dramatically reduced for NIHL than MHL (i.e., even for a similar degree of hearing loss). Figures adapted and modified from Henry et al., 2019.
Fig. 3.
Fig. 3.. Observed effects of NIHL on temporal coding differ between TFS and ENV stimulus components, but in different ways for narrowband and broadband sounds due to distorted tonotopy.
(A-B) Envelope coding strength (quantified using SUMCOR height at 0 delay) is enhanced for the impaired (red) group for both SAM tones and a natural speech stimulus. (C-D) TFS coding strength (quantified using DIFCOR height at 0 delay) is similar for the two groups for SAM-tone stimuli (suggesting no change to the fundamental ability of AN fibers to follow rapid TFS components) but is substantially enhanced (due to low-frequency encoding resulting from distorted tonotopy) for the impaired group for the broadband speech stimulus. (E-F) The relative ENV-to-TFS coding (quantified using the ratio of peaks in SCC and SAC, Louage et al., 2004; 0 indicated dominant TFS coding, 1 represents dominant ENV coding) is enhanced in the impaired group for SAM tones, but is diminished for the speech stimulus. Panels A, C, and E are adapted and modified from Kale and Heinz, 2010, with permission. Data in B, D, and F reanalyzed from Parida and Heinz, 2022a. SAM, sinusoidally amplitude modulated; SAC, shuffled auto-correlogram; SCC, shuffled cross-correlogram.
Fig. 4.
Fig. 4.. Following NIHL, F1 coding across a connected speech sentence is enhanced whereas the coding of F2 and F3 is diminished; coding of all formants is shifted up to higher-CF regions.
(A) Symbols indicate the F1 coding strength for normal (blue) and impaired (red) AN fibers (left y-axis). Colored lines denote octave-band averages of formant power. Black curve represents F1 trajectory across the sentence (time on right y-axis). (B-C) Same as A, but for F2 and F3, respectively. These AN-fiber data are in response to a connected speech sentence in steady speech-shaped noise at 0 dB SNR; similar results are seen for quiet and −5 dB SNR conditions (data not shown). Reprinted from Parida and Heinz, 2022a.
Fig. 5.
Fig. 5.. Distorted tonotopy also degrades the coding of consonants in quiet and in noise. (A-B) Stop-consonant coding in quiet.
(A) Difference in power spectra of the burst portion of two stop consonants, /d/ and /g/. (B) Difference in driven rates in response to the same stimuli for normal (blue) and impaired (red) AN fibers. (C-H) Fricative coding in noise. (C) Spectra of a fricative (/s/, green) and masking noise (purple, speech-shaped spectrum). Note that the noise spectrum is steeper than an ideal pink spectrum (pink line). FTCs are also shown for two example AN fibers (blue, normal; red, impaired). (D) Peristimulus time histograms (bin width= 200 μs) and response envelopes (low-pass filtered; 32 Hz cut off; fourth order) for speech in quiet (S), noise-alone (N), and speech in noise (SN) for the normal AN fiber in C. Dashed magenta lines indicate the fricative window used for analysis in F-H. (E) Same as D, but for the impaired AN fiber in C. (F-H) Symbols indicate response correlation between SN and N (after subtracting noise floor estimated as correlation between S and N). Thick (thin) lines indicate octave band averages for low/medium (high) SR AN fibers. Normal low/medium SR fibers maintained robust coding at all SNRs tested but responses of impaired low/medium SR fibers were severely degraded. Panels adapted and modified from Parida and Heinz, 2022a. SR, spontaneous rate.
Fig. 6.
Fig. 6.. Tip-to-tail ratio (TTR), a proxy for quantifying distorted tonotopy, was the dominant factor underlying all speech and speech-in-noise coding degradations tested.
A mechanistic mixed-effect model was constructed to evaluate the contributions of three physiological factors (threshold, local Q10, and TTR) to each of several speech-coding metrics (see Parida and Heinz, 2022a for details). These metrics include the ratio of near-CF (octave wide centered at CF) power to low-frequency (<400 Hz) power in the response spectrum for voiced speech in quiet (Tonotopicity in quiet), formant (F1,F2, and F3) coding (in quiet, and in 0 dB and −5 dB SNR), and fricative (/s/) coding in noise (0, −5, and −10 dB SNR, as shown in Fig. 5F–H). Effect size was estimated using the dequivalent or deq metric (Rosenthal and Rubin, 2003), and was based on partial regression coefficients. Data summarized from Parida and Heinz, 2022a.
Fig. 7.
Fig. 7.. Severity of distorted tonotopy depends on the spectral timbre of the stimulus and varies dynamically across the speech sentence.
(A) Spectra of two 70-ms speech segments within the speech sentence with 1) relatively flat (up to 2 kHz, purple) and 2) downward sloping spectrum (green). These segments produced minimal and maximal distorted tonotopy, respectively, as indicated by FFRs recorded in chinchillas (Parida and Heinz 2021). (B) Strength of ENV, TFS, and relative ENV-to-TFS coding were quantified for individual AN fibers. Same format as Fig. 3. While ENV and TFS coding were similarly enhanced (similar relative ENV-to-TFS coding, SCC/SAC ratio) following NIHL for the segment with flat spectrum (left column in B), TFS was more enhanced than ENV for the sloping segment (right column in B) leading to substantially diminished relative ENV-to-TFS coding. Panel A reprinted from Parida and Heinz, 2021, with permission. Data in B reanalyzed from Parida and Heinz, 2022a.
Fig. 8.
Fig. 8.. Across-fiber response correlation increases following NIHL.
(A) Across-fiber response correlation was quantified using ρresponse=[SCCpeakX,Y-1]/[SACpeakX-1]×[SCCpeakY-1], where X and Y are spike train responses of two AN fibers. (B-C) Across-fiber response ENV and TFS correlation was quantified using ρENV and ρTFS, where ρENV=[SUMCORpeakX,Y-1]/[SUMCORpeakX-1]×[SUMCORpeakY-1] and ρTFS=DIFCORpeakX,Y/DIFCORpeakX×DIFCORpeakY. See Heinz and Swaminathan, 2009 and Swaminathan and Heinz, 2011 for more details about these metrics. Mean and 95% confidence intervals are shown computed from a population of AN-fiber responses to the connected speech sentence. Data reanalyzed from Parida and Heinz, 2022a.
Fig. 9.
Fig. 9.. Distorted tonotopy severely degrades speech coding in quiet and in noise.
(top, right) Distorted tonotopy leads to highly correlated AN-fiber responses to speech in quiet, which are dominated by low-frequency stimulus energy, therefore leading to very low information (channel) capacity. (bottom) While normal (left) and, to a lesser extent broader-bandwidth (middle) systems can benefit from narrow spectral regions with favorable SNR in a noisy speech stimulus (noise, red; speech, blue), a system with distorted tonotopy (right) will be severely affected by the masker, especially one with negatively sloping spectrum, such as multi-talker babble.
Fig. 10.
Fig. 10.. Disruption in relative TFS-to-ENV coding can be used to identify distorted tonotopy noninvasively using the frequency-following response (FFR).
(A) The relation between relative TFS-to-ENV strength in the FFR (y-axis) and an estimate of the spectral timbre (ratio of power in low and high frequency regions, x-axis, with steeper downward timbre being to the right) was estimated across different speech segments (each symbol represents computations made within various 64-ms duration segments of the speech sentence). Thin blue lines represent individual animals. Thick black line indicates population average. (B) Same format as A but for hearing-impaired chinchillas following NIHL. While the relative power of TFS and ENV in the FFR is not related to speech spectral timbre for normal-hearing chinchillas, these response and stimulus metrics are correlated for hearing-impaired chinchillas. (C) The correlation (DTslope, in dB/dB) was greater for chinchillas with more noise-induced hearing loss (estimated using threshold of auditory brainstem responses or ABR). Panels adapted and modified from Parida and Heinz, 2021, with permission.

Similar articles

Cited by

References

    1. Abdala C, Sininger YS, Ekelid M, Zeng F-G, 1996. Distortion product otoacoustic emission suppression tuning curves in human adults and neonates. Hearing Research 98, 38–53. 10.1016/0378-5955(96)00056-1 - DOI - PubMed
    1. Beutelmann R, Brand T, Kollmeier B, 2010. Revision, extension, and evaluation of a binaural speech intelligibility model. The Journal of the Acoustical Society of America 127, 2479–2497. 10.1121/1.3295575 - DOI - PubMed
    1. Bharadwaj HM, Verhulst S, Shaheen L, Liberman MC, Shinn-Cunningham BG, 2014. Cochlear neuropathy and the coding of supra-threshold sound. Front. Syst. Neurosci. 8. 10.3389/fnsys.2014.00026 - DOI
    1. Bruce IC, Zilany MSA, 2007. Modelling the effects of cochlear impairment on the neural representation of speech in the auditory nerve and primary auditory cortex. Proceedings of the International Symposium on Auditory and Audiological Research 1, 1–10.
    1. Chung K, 2004. Challenges and Recent Developments in Hearing Aids: Part I. Speech Understanding in Noise, Microphone Technologies and Noise Reduction Algorithms. Trends in Amplification 8, 83–124. 10.1177/108471380400800302 - DOI - PMC - PubMed

Publication types

MeSH terms