. 2023 Mar 1;146(3):1212-1226.
doi: 10.1093/brain/awac298.

Mapping astrogliosis in the individual human brain using multidimensional MRI

Affiliations

Mapping astrogliosis in the individual human brain using multidimensional MRI

Dan Benjamini et al. Brain. .

Abstract

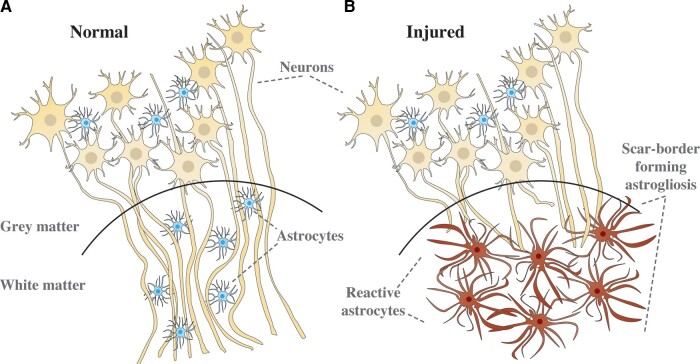
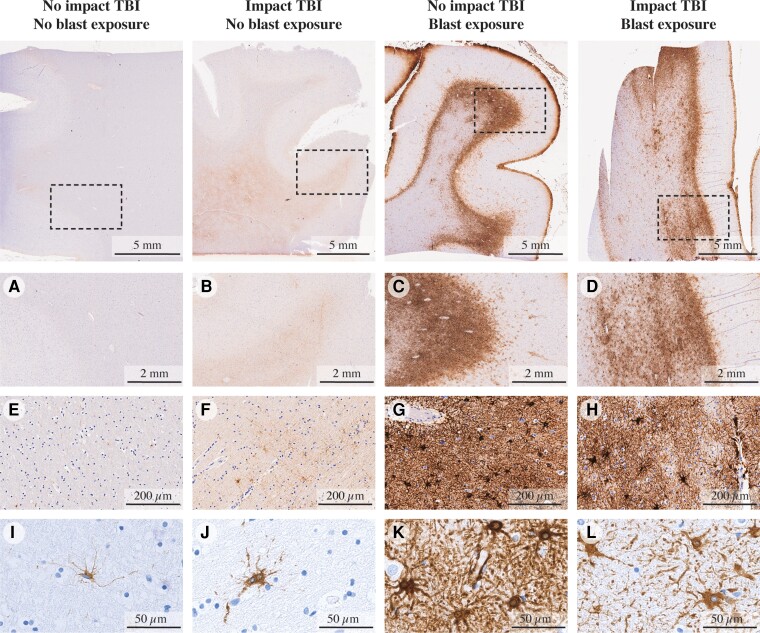
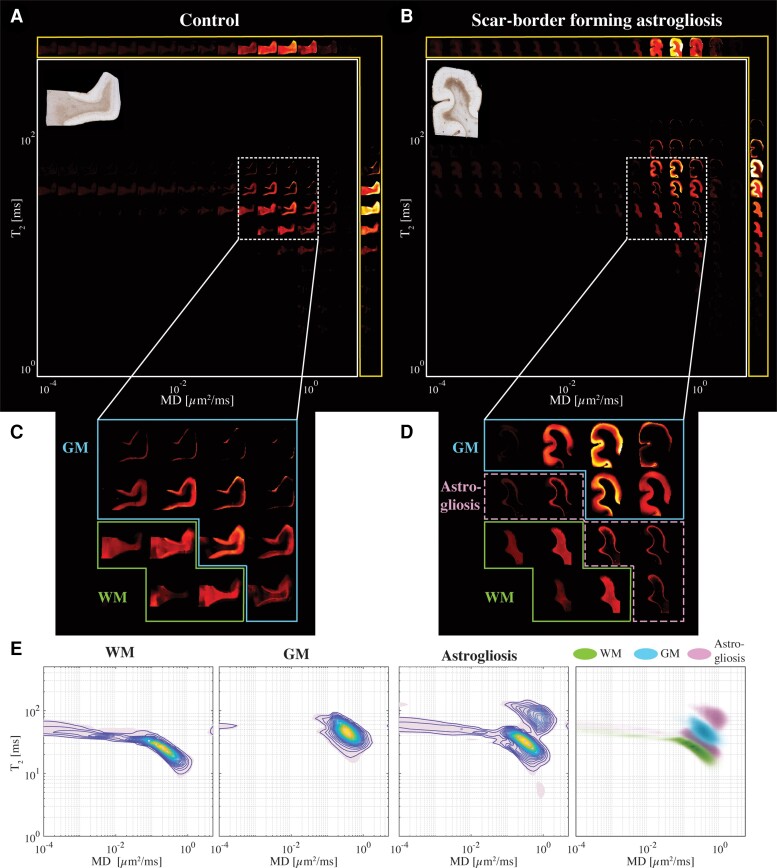
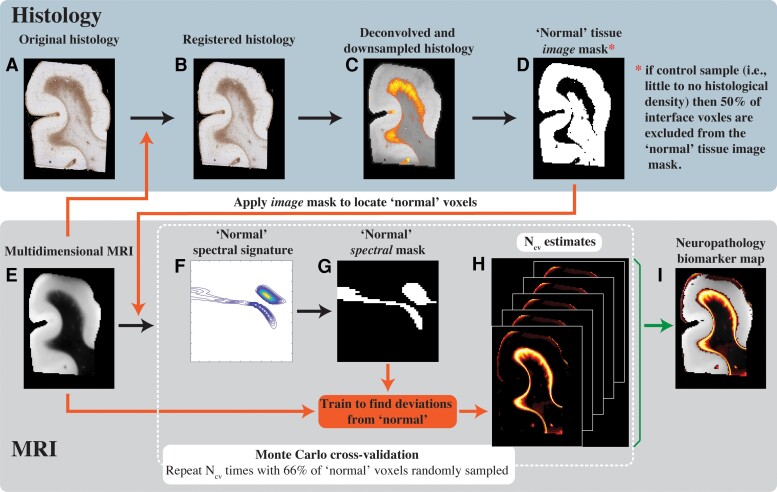
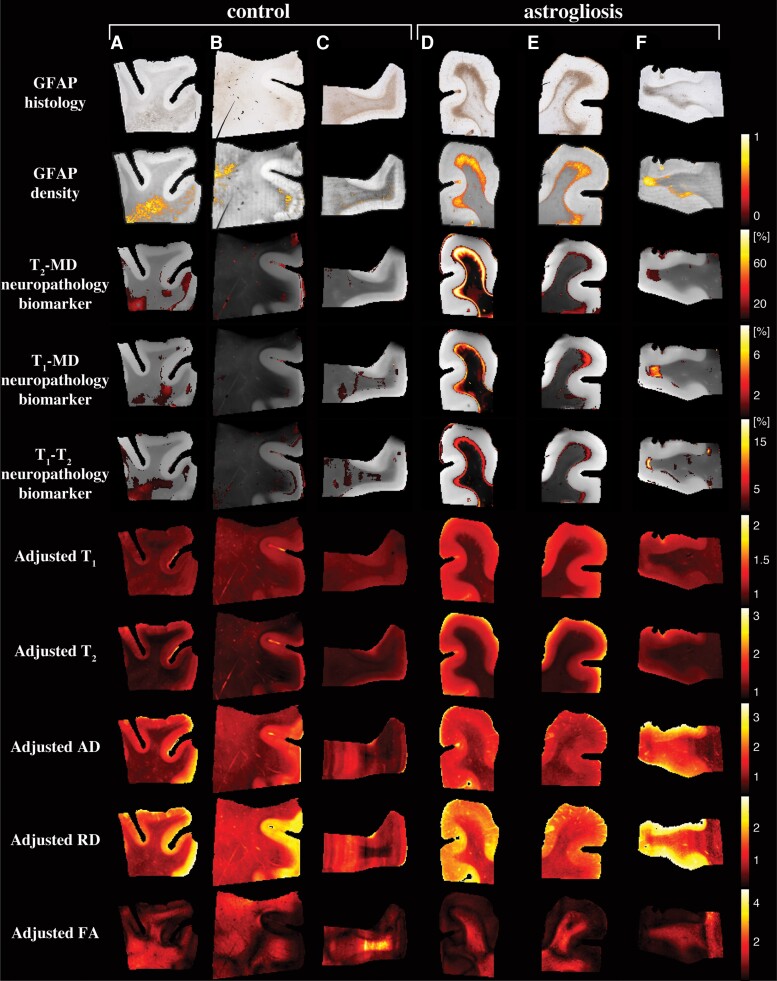
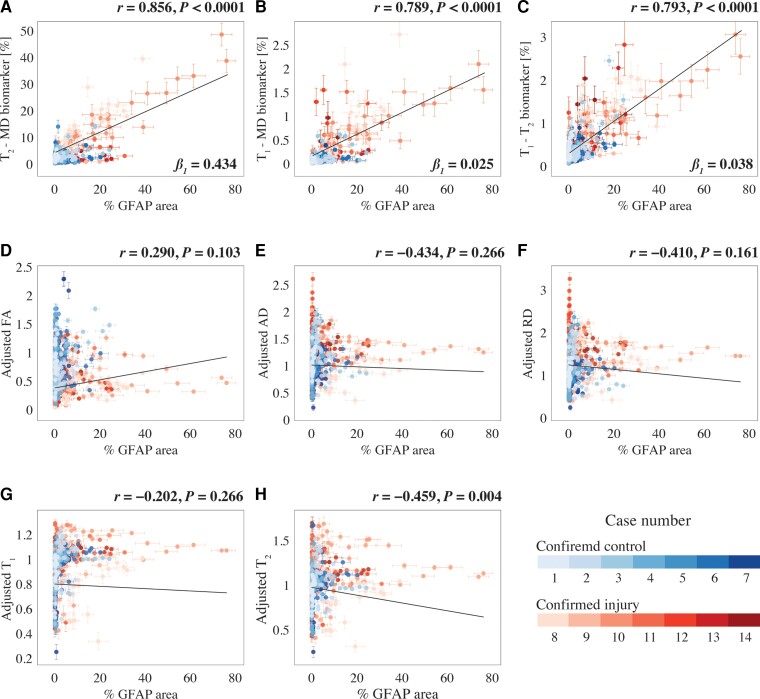
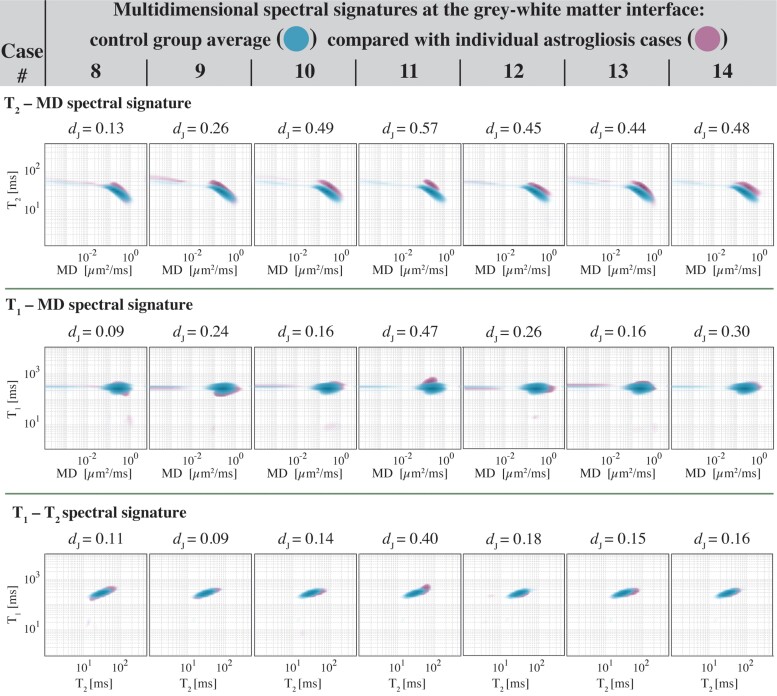
There are currently no non-invasive imaging methods available for astrogliosis assessment or mapping in the central nervous system despite its essential role in the response to many disease states, such as infarcts, neurodegenerative conditions, traumatic brain injury and infection. Multidimensional MRI is an increasingly employed imaging modality that maximizes the amount of encoded chemical and microstructural information by probing relaxation (T1 and T2) and diffusion mechanisms simultaneously. Here, we harness the exquisite sensitivity of this imagining modality to derive a signature of astrogliosis and disentangle it from normative brain at the individual level using machine learning. We investigated ex vivo cerebral cortical tissue specimens derived from seven subjects who sustained blast-induced injuries, which resulted in scar-border forming astrogliosis without being accompanied by other types of neuropathological abnormality, and from seven control brain donors. By performing a combined post-mortem radiology and histopathology correlation study we found that astrogliosis induces microstructural and chemical changes that are robustly detected with multidimensional MRI, and which can be attributed to astrogliosis because no axonal damage, demyelination or tauopathy were histologically observed in any of the cases in the study. Importantly, we showed that no one-dimensional T1, T2 or diffusion MRI measurement can disentangle the microscopic alterations caused by this neuropathology. Based on these findings, we developed a within-subject anomaly detection procedure that generates MRI-based astrogliosis biomarker maps ex vivo, which were significantly and strongly correlated with co-registered histological images of increased glial fibrillary acidic protein deposition (r = 0.856, P < 0.0001; r = 0.789, P < 0.0001; r = 0.793, P < 0.0001, for diffusion-T2, diffusion-T1 and T1-T2 multidimensional data sets, respectively). Our findings elucidate the underpinning of MRI signal response from astrogliosis, and the demonstrated high spatial sensitivity and specificity in detecting reactive astrocytes at the individual level, and if reproduced in vivo, will significantly impact neuroimaging studies of injury, disease, repair and aging, in which astrogliosis has so far been an invisible process radiologically.

Keywords: GFAP; astrogliosis; blast; diffusion; machine learning; multidimensional MRI; radiological–pathological correlations; relaxation; traumatic brain injury.


Figures

Figure 1
Figure 1
Illustration of microstructural changes occurring in the grey–white matter junction when scar-border forming astrogliosis is present. In A, axons are tightly aligned, forming a densely packed cellular environment. In B, scar-border forming reactive astrocytes have overlapping processes that sequester damaged tissue and inflammation while preventing injured axons from growing through the border. These changes are hypothesized to be reducing the overall cellular density in the white matter.
Figure 2
Figure 2
GFAP immunoreactivity in specimens. Figure shows specimens without impact or blast exposure TBI, with impact TBI but without blast exposure, without impact TBI but with blast exposure and with both impact and blast exposure TBI cases, at different magnification levels (×2, ×20 and ×80, from top to bottom). A, E and I show minimal GFAP immunoreactivity (Case 1). B, F and J show limited GFAP immunoreactivity with mild reactive astrocytes (Case 3). C, G and K show dense scar-border forming astrogliosis at the grey–white matter junction (Case 11). D, H and L show a similar pattern of dense scar-border forming astrogliosis at the grey–white matter junction (Case 8).
Figure 3
Figure 3
Changes in the T2-MD multidimensional MR signature induced by confirmed astrogliosis. Maps of 2D spectra of subvoxel T2-MD values reconstructed on a 16 × 16 grid of a representative (A) control (Case 7) and (B) injured (Case 10) subjects, along with their respective GFAP histological image (top left of each panel). (C) Magnified spectral region from the control case shows the clear separation of white (yellow frame) and grey (teal frame) matter according to their diffusion and T2 values. (D) The same magnified spectral region as in C from the injured case shows that while the WM and GM spectral information content is still clearly separable (yellow and teal frames, respectively), distinct spectral components can be seen on the grey–white matter interface (purple frame), which is qualitatively similar to the GFAP staining pattern of the sample. (E) T2-MD spectra averaged across all subjects in WM, GM and GFAP-positive spatial regions of interest (left to right) and a superposition of the average spectra from the three regions of interest. It should be noted that the peak in normal-appearing WM was forced to align between subjects, but not in GM or in injured tissue.
Figure 4
Figure 4
Schematic representation of the proposed anomaly detection framework. (A) The original GFAP histological image is processed in two steps: (B) co-registration to the MRI data set and (C) subsequent deconvolution and downsampling to match the MRI resolution. (D) This GFAP density image is then thresholded, inverted and used as an image domain mask for normative brain voxels on the (E) multidimensional MRI data. A Monte Carlo cross-validation procedure is used to create Ncv = 1000 multiple random splits of 66% and 34% of the normal-appearing voxels into training and validation data, respectively, resulting in a 1000 (F) normative spectral signatures, each of which is binarized to obtain (G) spectral masks of normative brain. To detect anomalies, the normative spectral mask is inverted and is used on the full multidimensional data to directly obtain (H) Ncv = 1000 versions of abnormal signal component maps, which are then averaged to yield the final (I) neuropathology MRI biomarker map.
Figure 5
Figure 5
Multidimensional and voxel-averaged MRI maps. AC are subjects without severe astrogliosis (Cases 3, 4 and 7), while DF had substantial GFAP overexpression (Cases 10–12). The different rows correspond to the different MRI contrasts, including all the conventional relaxation and DTI parameters, and the proposed multidimensional astrogliosis maps. In addition, the co-registered histological GFAP images and density maps are shown. Multidimensional neuropathology maps overlaid onto proton density images show substantial injury along the grey–white matter interface, while conventional MRI maps of T1, T2, AD, RD and FA do not show visible abnormalities. Note that to facilitate visualization, the multidimensional neuropathology MRI biomarker maps were thresholded at 10% of the maximal intensity and overlaid on greyscale proton density images.
Figure 6
Figure 6
Radiological-pathological correlations between MRI metrics and GFAP density. GFAP density (% area) from 556 tissue regions from 14 subjects (colour-coded, see legend) and the corresponding MR parameter correlations. Individual data points represent the mean value from each post-mortem tissue sample. Scatterplots of the mean (with 95% CI error bars) % area GFAP and (A) T2-MD, (B) T1-MD and (C) T1–T2 injury MRI biomarkers show strong positive and significant correlation with GFAP density. The conventional MRI metrics in DG did not result in strong and significant correlations with % area GFAP, apart from weak yet significant correlation of (H) voxel-averaged T2.
Figure 7
Figure 7
Comparisons of normal-appearing grey–white matter interface and interface astrogliosis multidimensional signatures. Spectral signatures from all control cases were averaged, yielding a grey–white matter interface spectral signature control group average for each MR dataset (blue). Interface astrogliosis spectral signatures from each GFAP-positive case (purple) are individually compared with the control group average and the Jensen Distance between control group average and individual signatures are shown for each case. As a reference, the Jensen Distances between normal-appearing WM and GM across the entire study was 0.53, 0.13 and 0.21 for the T2-MD, T1-MD and T1–T2 spectral signatures, respectively.

Comment in

References

    1. Sofroniew MV, Vinters HV. Astrocytes: Biology and pathology. Acta Neuropathol. 2010;119:7–35. - PMC - PubMed
    1. Bush TG, Puvanachandra N, Horner CH, et al. . Leukocyte infiltration, neuronal degeneration, and neurite outgrowth after ablation of scar-forming, reactive astrocytes in adult transgenic mice. Neuron. 1999;23:297–308. - PubMed
    1. Wanner IB, Anderson MA, Song B, et al. . Glial scar borders are formed by newly proliferated, elongated astrocytes that interact to corral inflammatory and fibrotic cells via STAT3-dependent mechanisms after spinal cord injury. J Neurosci. 2013;33:12870–12886. - PMC - PubMed
    1. Voskuhl RR, Peterson RS, Song B, et al. . Reactive astrocytes form scar-like perivascular barriers to leukocytes during adaptive immune inflammation of the CNS. J Neurosci. 2009;29:11511–11522. - PMC - PubMed
    1. Pekny M, Pekna M. Astrocyte reactivity and reactive astrogliosis: Costs and benefits. Physiol Rev. 2014;94:1077–1098. - PubMed

Publication types

MeSH terms

Substances