. 2022 Aug 11;13(1):4528.
doi: 10.1038/s41467-022-31842-y.

PTEN inhibits AMPK to control collective migration

Affiliations

PTEN inhibits AMPK to control collective migration

Florent Peglion et al. Nat Commun. .

Abstract

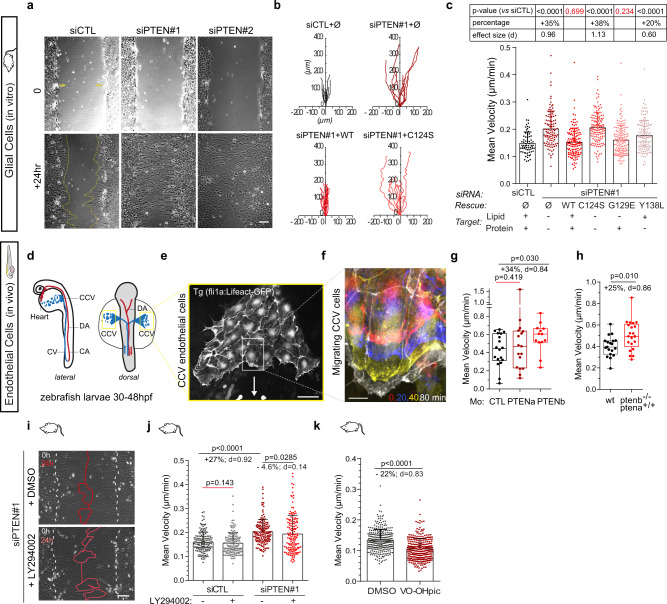
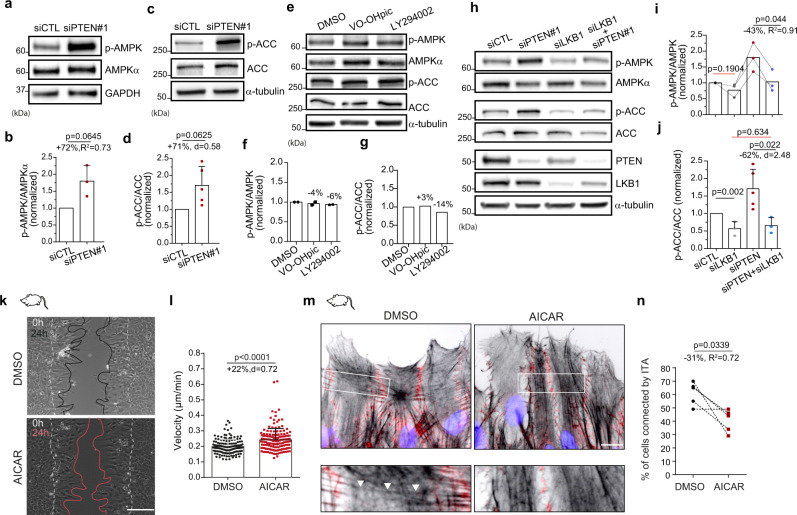
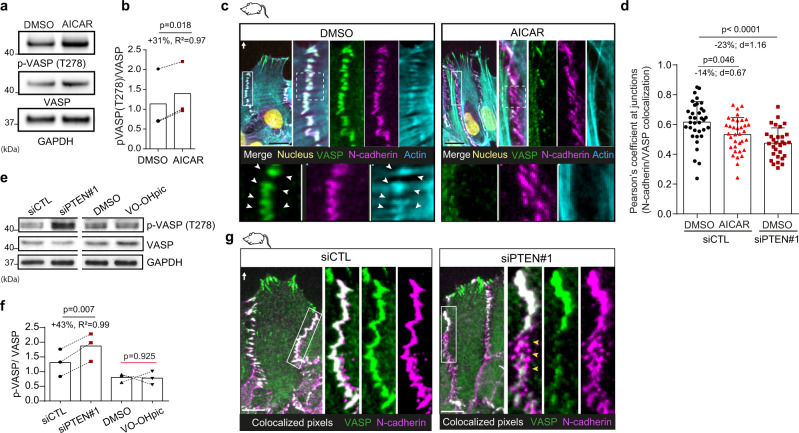
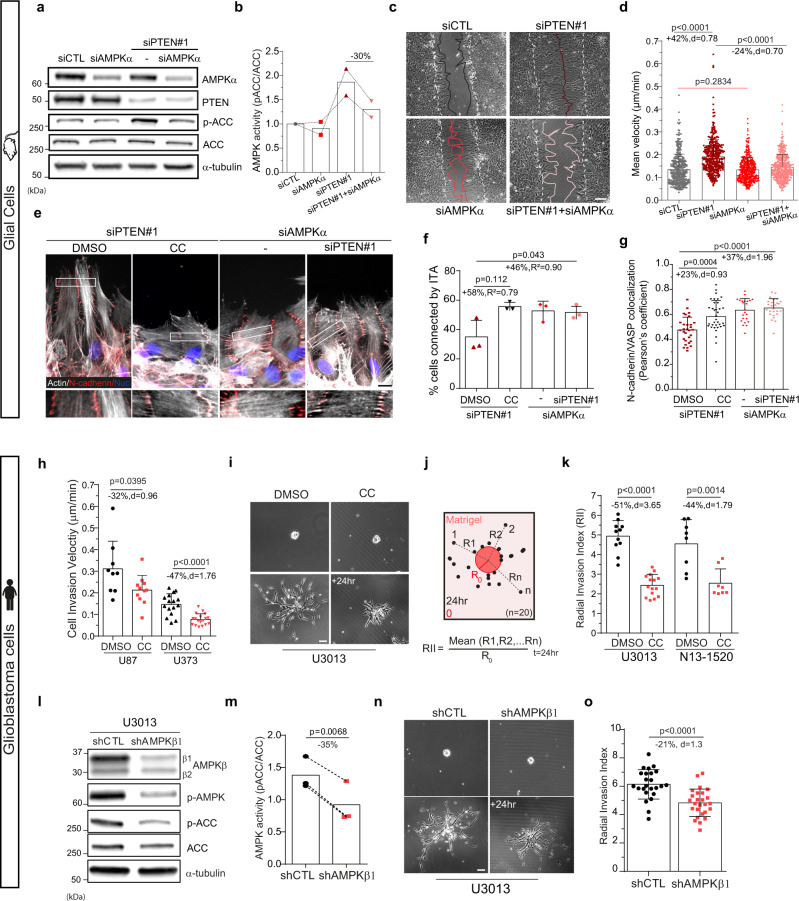
Pten is one of the most frequently mutated tumour suppressor gene in cancer. PTEN is generally altered in invasive cancers such as glioblastomas, but its function in collective cell migration and invasion is not fully characterised. Herein, we report that the loss of PTEN increases cell speed during collective migration of non-tumourous cells both in vitro and in vivo. We further show that loss of PTEN promotes LKB1-dependent phosphorylation and activation of the major metabolic regulator AMPK. In turn AMPK increases VASP phosphorylation, reduces VASP localisation at cell-cell junctions and decreases the interjunctional transverse actin arcs at the leading front, provoking a weakening of cell-cell contacts and increasing migration speed. Targeting AMPK activity not only slows down PTEN-depleted cells, it also limits PTEN-null glioblastoma cell invasion, opening new opportunities to treat glioblastoma lethal invasiveness.


Conflict of interest statement

The authors declare no competing interests.

Figures

Fig. 1
Fig. 1. PTEN loss enhances collective cell migration independently of PI3K/AKT signalling.
a Phase-contrast images of siCTL and PTEN-depleted (siPTEN#1,2) astrocytes migrating collectively in a wound-healing assay. Scale bar: 100 μm. b Diagrams showing 24 h-trajectories of 10 representative siCTL, and siPTEN#1 cells rescued with GFP alone (Ø), PTEN-WT(WT) and PTEN-C124S (C124S). c Mean astrocyte velocity. 69 siCTL cells, 107 siPTEN + Ø cells, 133 siPTEN+wt cells, 133 siPTEN+C124S cells, 145 siPTEN+G129E cells and 137 siPTEN + Y138L cells from three biologically independent experiments were examined. Statistics were drawn using two-tailed Mann–Whitney test. p values and effect sizes vs siCTL are given in the table above the graph. d Schemes representing lateral and dorsal view of a 24/30hpf zebrafish embryo with dorsal (DA) and caudal arteries (CA) in red and the caudal (CV) and common cardinal (CCV) veins. CCV endothelial cells (ECs) are delaminating from the midline, moving towards the heart (yellow box). e Representative fluorescent image of migrating ECs expressing Lifeact-eGFP. Scale bar: 50 μm. The micrograph is representative of at least 12 independent fish larvae. f Time-colored zoomed-in image of migrating ECs. Red is t = 0, blue is t = 20 min, yellow is t = 40 min and white is t = 180 min. Scale bar represents 10 µm. g, h Mean velocity of lifeact-eGFP expressing ECs in control zebrafish embryos (MoCTL), ptena morphant (MoPTENa) and ptenb morphant (MoPTENb) (g, n = 18, 17, 13 cells; N = 4 fish, two-tailed unpaired t-test) and in wild-type pten and in ptenb−/− mutant zebrafish embryos (h, n = 19, 21 cells; N = 6, 5 fish; two-tailed unpaired t-test). i Phase-contrast images of siPTEN#1 cells treated with DMSO or the PI3K inhibitor LY294002. White dashed lines delineate the border of the wound at t = 0. Red lines delineate the border of the monolayer 24 h later. Scale bar 100 μm. j, k Mean velocity of siCTL and siPTEN cells treated with or without LY294002 (j, n = 198 cells, N = 3, two-tailed Mann–Whitney test) and with DMSO or VO-OHpic (k, n = 300, N = 3, two-tailed Mann–Whitney). Error bars represent Standard Deviation (SD). Boxes for box-plot graphs (g, h) extend from the 25th to 75th percentiles and the line in the middle is plotted at the median. Whiskers delineate all data points from minimum to maximum. Source data are provided as a Source Data file.
Fig. 2
Fig. 2. PTEN controls first-row cell-cell cohesion.
a, d Normal (a) and super resolution (d) immunofluorescence images of actin filaments (phalloidin), cell-cell junctions (N-cadherin) in siCTL and siPTEN#1 migrating astrocytes. Black arrow: direction of migration. Boxed regions are zoomed in the panels below to highlight the presence of interjunctional transverse actin arcs (ITA) mostly in siCTL cells (black arrowheads). The micrographs in (a) are representative of the data shown in (b, c). The images in (d) are representative of six independent samples. b Angular distribution of actin filaments in front row siCTL and siPTEN#1 cells (n = 300). 0° is perpendicular to the direction of migration. Graph represents Kernel density estimates of probability density function. Dashed lines show quartiles. c, e Proportion of front row siCTL and siPTEN#1 cells with (e, n = 200) or without (c, n = 300) wt- and mutated-PTEN rescue, that are connected with ITA. f Fluorescence images of CCV ECs expressing LifeAct-GFP in CTL and ptenb morphant fish. White arrowheads point at ITA. g Percentage of front row CCV EC cells connected by ITA in MoCTL (n = 36 cells) and MoPTENb (n = 29 cells) fish larvae. Box extends from the 25th to 75th percentiles and the line in the middle of the box is plotted at the median. The whiskers delineate all data points from minimum to maximum. h Immunofluorescence image of N-cadherin in migrating astrocytes, where the linearity index of front row lateral cell-cell junction is defined. i Junctional linearity index in siCTL (n = 70) and siPTEN#1 (n = 65) cells, 8 h after migration. j Junctional linearity index in MoCTL (n = 12) and MoPTENb (n = 16) front row cells, 100 min after migration. k Schemes summarising PTEN loss phenotype in front row cells during collective cell migration. Scale bars: 10 µm. Number of independent experiments = 2 (e, i), =3 (b, c, j). Statistical tests: Kolmogorov-Smirnov (b), two-tailed paired t-test (c, g), two-tailed Mann–Whitney (i), two-tailed unpaired Student t test (j). p values, along with effect size coefficients are given on the graphs. Error bars represent SD. Source data are provided as a Source Data file.
Fig. 3
Fig. 3. PTEN inhibits AMPK activity to control collective cell migration.
a, c, e Western blot analysis of phosphorylated AMPK (T172), total AMPK, phosphorylated ACC (S79), ACC and GAPDH in siCTL and siPTEN#1 (a, c) and DMSO, VO-OHpic, LY294002-treated (e) astrocytes lysates. b, f Normalised ratio (over siCTL or DMSO) of T172 phosphorylation/total AMPK in siPTEN#1 (b, N = 3) and VO-OHpic- or LY294002-treated cells (f, N = 2). Two-sided paired t-test were realised on raw data to generate p values. d, g Normalised ratio (over siCTL or DMSO) of S79 phosphorylation/total ACC in siPTEN#1 (d, N = 5, Wilcoxon test) and VO-OHpic- or LY294002-treated cells (g, N = 1). h Representative western blot analysis of pAMPK (T172), total AMPK, ACC, pACC (S79), PTEN, LKB1 and α-tubulin in siCTL, siPTEN#1, si LKB1 and siPTEN#1 + siLKB1 astrocytes lysates. The analysis was repeated three times and analysed in (i, j). i Normalised ratio (over siCTL) of p-AMPK/AMPK (N = 3, two-tailed paired t-test on raw data). j Normalised ratio (over siCTL) of p-ACC/ACC (N = 3 for siLKB1 and siPTEN + siLKB1, N = 5 for siCTL and siPTEN, two-tailed unpaired t-test on raw data). Note that LKB1 depletion rescues basal AMPK activity in siPTEN#1 cells. k Representative phase-contrast images of DMSO and AICAR-treated astrocytes migrating in a wound-healing assay. White dashed lines delineate the border of the wound at t = 0. Black/Red lines delineate the border of the monolayer 24 h later. Scale bar: 100 µm. l Mean velocity of DMSO (n = 149) and AICAR-treated cells (n = 157). Data were acquired from three biologically independent experiments and analysed statistically using two-tailed Mann–Whitney test. m Immunofluorescence images of actin filaments (Phalloidin, black), cell-cell junctions (N-cadherin, red) and nucleus (DAPI, blue) in DMSO and AICAR-treated migrating astrocytes. Boxed regions are zoomed in the panels below to highlight the presence of ITA (white arrowheads) mostly in DMSO cells. Scale bar: 10 µm. n Proportion of front row DMSO and AICAR-treated cells connected by ITA. 300 cells over five biologically independent experiments were examined. Stasticial test: two-tailed paired t-test. Error bars represent SD. Full scan images of the blots and source data are provided as a Source Data file.
Fig. 4
Fig. 4. AMPK activation controls VASP phosphorylation and localisation at cell-cell junction.
a, e Western blot analysis of phosphorylated VASP (T278), total VASP and GAPDH in DMSO- and AICAR-treated astrocytes (a) and siCTL, siPTEN#1, DMSO- and VO-OHpic-treated cells (e). b, f Ratio of pVASP/VASP in DMSO- vs AICAR-treated cells (b, +31%, N = 3, two-tailed paired t-test), in siCTL vs siPTEN#1 cells (f,+43%, N = 3, two-tailed paired t-test) and in DMSO- vs VO-OHpic-treated cells (f, N = 3, two-tailed paired t-test). c Immunofluorescence images of VASP (green), N-cadherin (magenta), F-actin (cyan) and DAPA (yellow) in DMSO- and AICAR-treated cells. White rectangles area are zoomed in the top panel. Dotted-line squares in the zoomed area are further zoomed in the bottom panels. Cell-cell junctions enriched in VASP associate with ITA anchoring (white arrowheads). Note that the absence of VASP at cell-cell junctions in AICAR-treated cells is associated with the absence of ITA. d Pearson’s coefficient of colocalized junctional N-cadherin with VASP in DMSO- and AICAR-treated siCTL cells (n = 35 cells analysed from three biologically independent experiments) and in DMSO-treated siPTEN cells (n = 30 cells analysed from three biologically independent experiments). Two-tailed unpaired t-test was used to derive p values. The drop in Pearson’s coefficient highlights the loss of VASP colocalisation with junctional N-cadherin in AICAR-treated and PTEN depleted cells. g Immunofluorescence images of VASP (green), N-cadherin (magenta) and colocalized pixels between N-cadherin and VASP (white) in siCTL and siPTEN#1 cells. White rectangles area are zoomed-in. Scale bars: 10 µm. Note the disappearance of colocalized pixels in large part of cell-cell junctions in siPTEN#1 cells (yellow arrowheads). Error bars represent SD. Full scan images of the blots and source data are provided as a Source Data file.
Fig. 5
Fig. 5. AMPK inhibition reduces collective cell migration and invasion efficiency by restoring leader cell cohesion.
a Western blot analysis of siCTL, siPTEN#1, siAMPKα and siPTEN#1+siAMPKα astrocytes lysates. b Normalised ratio of pACC/ACC showing efficiency at reducing AMPK activity in double siPTEN+siAMPKα transfected astrocytes (−30%). c Phase-contrast images of same astrocytes as (a) migrating in a wound-healing assay. White dashed and coloured lines delineate the border of the wound respectively at t = 0 and t = 24 h. d Mean velocity of astrocytes shown in (c) during 24 h migration (siCTL: n = 374, siPTEN#1: n = 366, siAMPKa: n = 429, siPTEN#1+siAMPKa: n = 460 cells). e Immunofluorescence images of actin filaments (phalloidin, grey) and N-cadherin (red) in migrating astrocytes. f Proportion of leader cells connected by ITA in the same cells shown in (e). (siPTEN#1 + dmso: n = 481 cells, siPTEN#1 + CC: 456, siAMPKα: 392, siPTEN#1+siAMPKα: 508). Note that despite p value = 0.112, the effect size is important between DMSO- and CC-treated siPTEN#1 cells (+58%, R² = 0.79). g Pearson’s coefficient of N-cadherin/VASP colocalisation at lateral cell-cell junctions in cells shown in (e). (siPTEN#1+dmso: n = 30 cells, siPTEN#1+CC: 35, siAMPKα: 23, siPTEN#1+siAMPKα: 26). h Mean cell invasion velocity in a Matrigel® spheroid assay of U87 and U373 cells treated with CC (U87/U373: DMSO, n = 108/184 cells from 9/16 spheroids; CC, n = 136/162 cells from 11/18 spheroids). i Phase-contrast images of DMSO- and CC-treated U3013 GBM cells just after being included in Matrigel® and 24 h after (j). Scheme explaining calculation of the radial invasion index (RII). k RII of U3013 and N13-1520 cells treated with DMSO (n = 11 and 8 spheroids) or CC (n = 15 and 8 spheroids). l Western blot analysis of shCTL and shAMPKβ1 U3013 cell lysates. m pACC/ACC ratios showing −35% AMPK activity in shAMPKβ1 cells compared to shCTL. n Phase-contrast images of shCTL and shAMPKβ1 U3013 spheroids in Matrigel® at t = 0 and 24 h after and their RII (o), showing a 21% decrease in infiltration efficiency when AMPKβ1 is depleted (n = 24/26 spheroids). Scale bars: 100 µm, except in (e), 10 µm. Number of biologically independent experiments = 2 (b), =3 (d, fh, k, m, o). Statistical tests: two-tailed unpaired t-test (d, g, h, k, o), two-tailed paired t-test (m). Error bars represent SD. Full scan images of the blots and source data are provided as a Source Data file.

References

    1. Hollander MC, Blumenthal GM, Dennis PA. PTEN loss in the continuum of common cancers, rare syndromes and mouse models. Nat. Rev. Cancer. 2011;11:289–301. doi: 10.1038/nrc3037. - DOI - PMC - PubMed
    1. Lee YR, Chen M, Pandolfi PP. The functions and regulation of the PTEN tumour suppressor: new modes and prospects. Nat. Rev. Mol. Cell Biol. 2018;19:547–562. doi: 10.1038/s41580-018-0015-0. - DOI - PubMed
    1. Cancer Genome Atlas Research, N. Comprehensive genomic characterization defines human glioblastoma genes and core pathways. Nature. 2008;455:1061–1068. doi: 10.1038/nature07385. - DOI - PMC - PubMed
    1. Verhaak RG, et al. Integrated genomic analysis identifies clinically relevant subtypes of glioblastoma characterized by abnormalities in PDGFRA, IDH1, EGFR, and NF1. Cancer Cell. 2010;17:98–110. doi: 10.1016/j.ccr.2009.12.020. - DOI - PMC - PubMed
    1. Brennan CW, et al. The somatic genomic landscape of glioblastoma. Cell. 2013;155:462–477. doi: 10.1016/j.cell.2013.09.034. - DOI - PMC - PubMed

Publication types

Substances