. 2022 Aug 11;13(1):4720.
doi: 10.1038/s41467-022-32488-6.

Restructured membrane contacts rewire organelles for human cytomegalovirus infection

Affiliations

Restructured membrane contacts rewire organelles for human cytomegalovirus infection

Katelyn C Cook et al. Nat Commun. .

Abstract

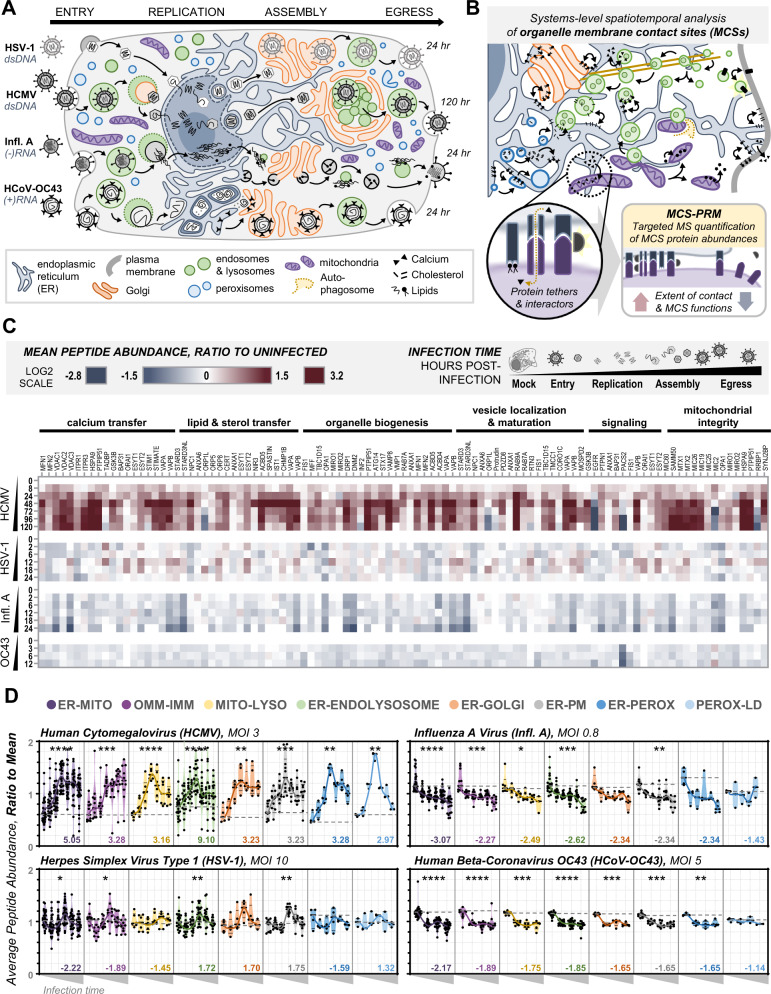
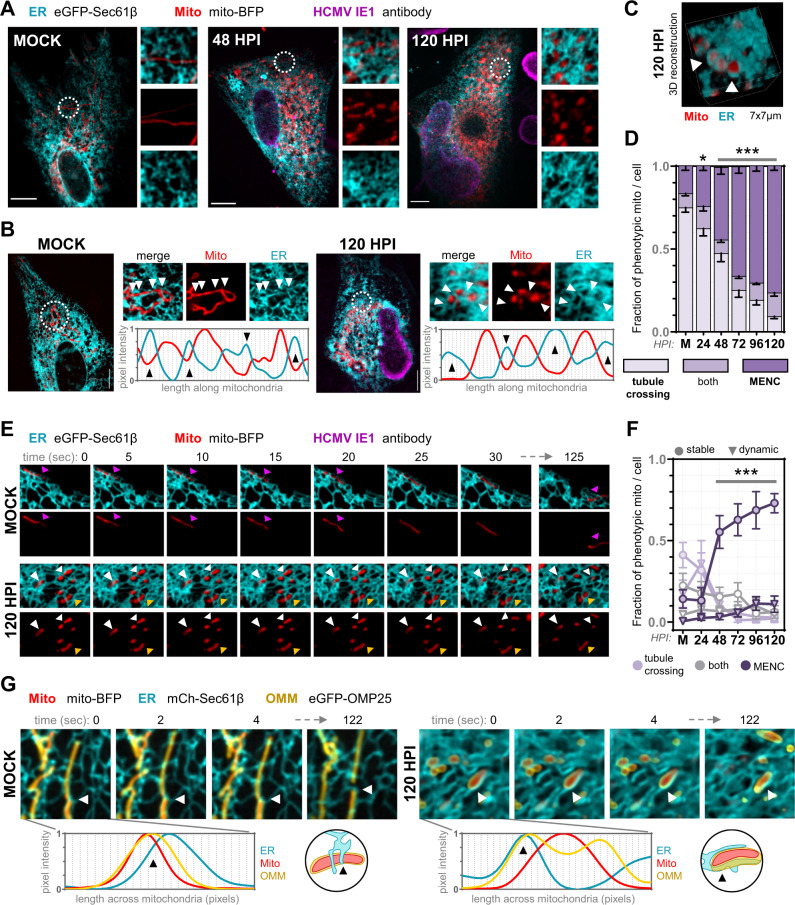
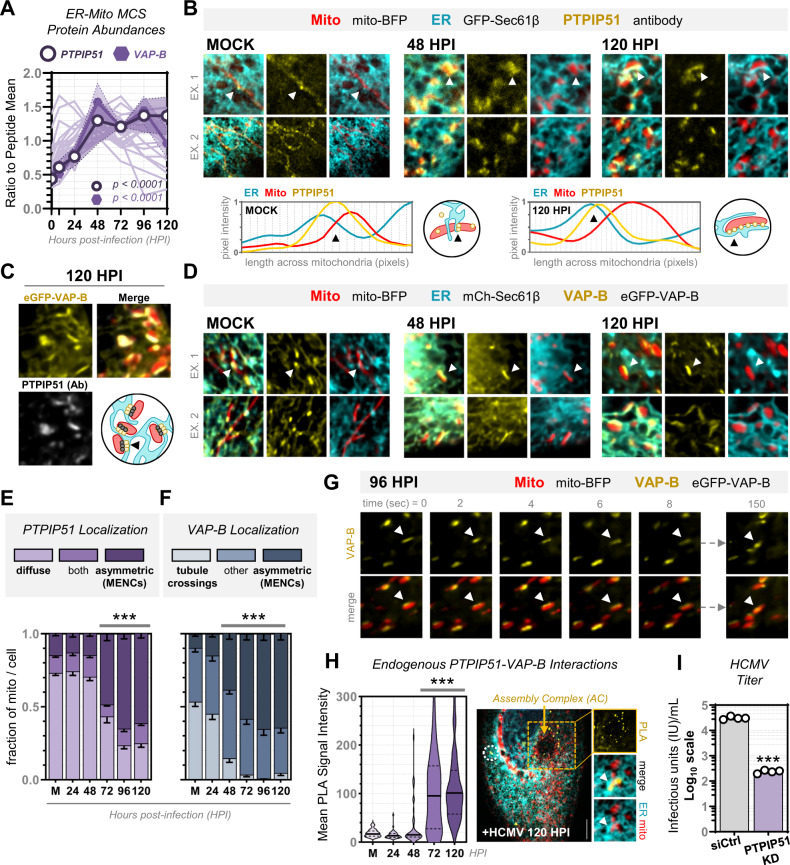
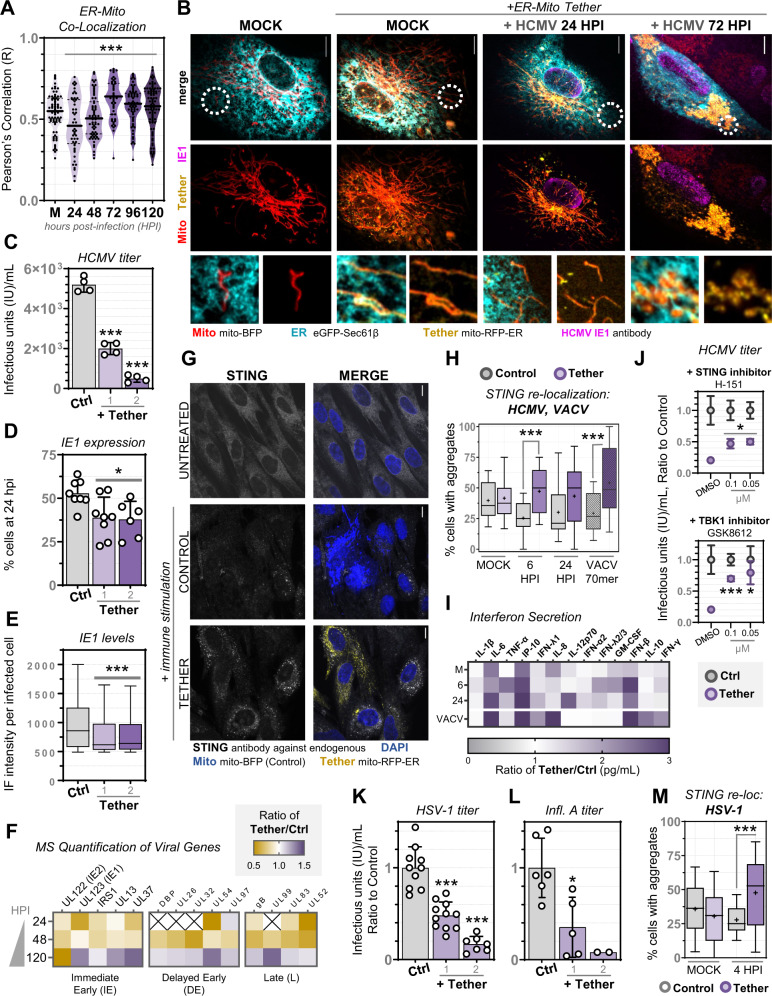
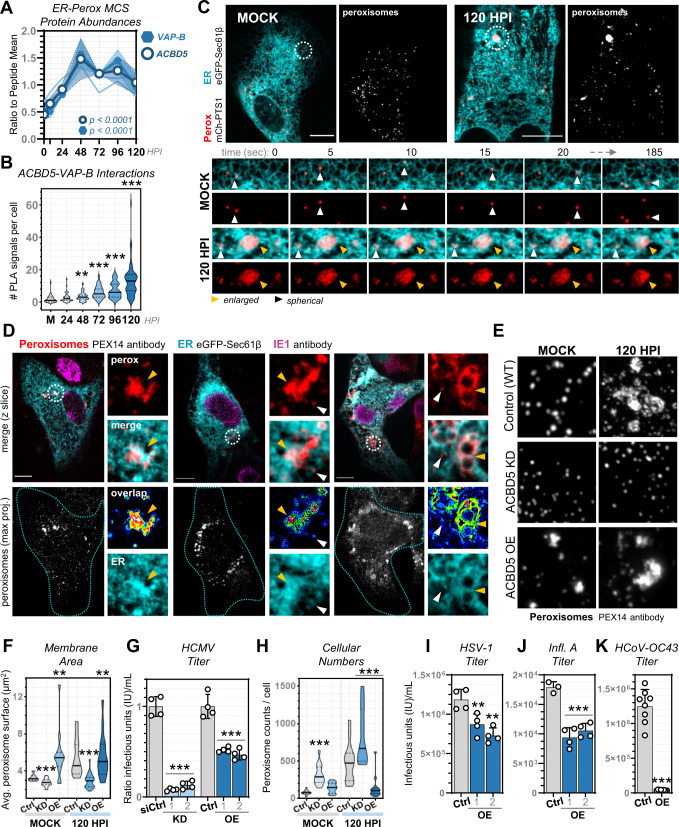
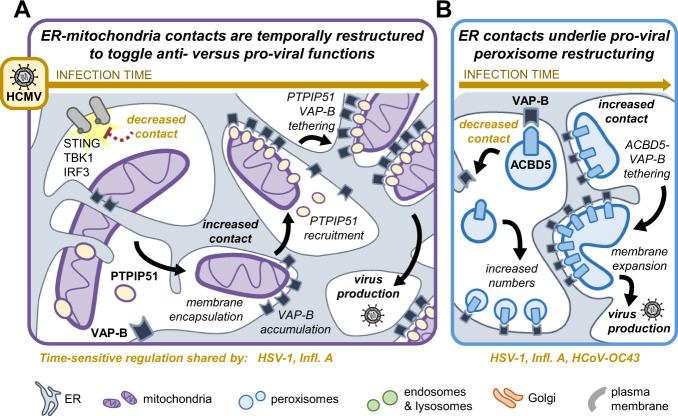
Membrane contact sites (MCSs) link organelles to coordinate cellular functions across space and time. Although viruses remodel organelles for their replication cycles, MCSs remain largely unexplored during infections. Here, we design a targeted proteomics platform for measuring MCS proteins at all organelles simultaneously and define functional virus-driven MCS alterations by the ancient beta-herpesvirus human cytomegalovirus (HCMV). Integration with super-resolution microscopy and comparisons to herpes simplex virus (HSV-1), Influenza A, and beta-coronavirus HCoV-OC43 infections reveals time-sensitive contact regulation that allows switching anti- to pro-viral organelle functions. We uncover a stabilized mitochondria-ER encapsulation structure (MENC). As HCMV infection progresses, MENCs become the predominant mitochondria-ER contact phenotype and sequentially recruit the tethering partners VAP-B and PTPIP51, supporting virus production. However, premature ER-mitochondria tethering activates STING and interferon response, priming cells against infection. At peroxisomes, ACBD5-mediated ER contacts balance peroxisome proliferation versus membrane expansion, with ACBD5 impacting the titers of each virus tested.


Conflict of interest statement

The authors declare no competing interests.

Figures

Fig. 1
Fig. 1. HCMV globally modulates organelle contact protein abundances in contrast to infections with HSV-1, Infl. A, and HCoV-OC43.
A Schematic highlighting the organelle remodeling events that underlie the unique infectious cycles of HCMV, HSV-1, Infl. A, and HCoV-OC43, which vary in structure (left), size, and replication timescale (right). B Membrane contact sites, facilitated by protein interactions, enable the direct transfer of biomolecules to coordinately regulate organelle structure and function. MCS-PRM simultaneously quantifies the abundances of MCS protein tethers, regulators, and functional interactors across organelles, identifying alterations to the extent and functions of organelle contacts. C MCS-PRM quantification of MCS protein abundances during infections (MOI: multiplicity of infection, i.e., number of viral particles per cell) with HCMV (MOI = 3, N = 6), HSV-1 (MOI = 10, N = 4), Infl. A (MOI = 0.8, N = 3), and HCoV-OC43 (MOI = 5, N = 3). Timepoints are indicated at left, proteins measured are top, grouped by primary function, and heatmap key is above (Log2 scale). The rationale for proteins included in MCS-PRM can be found in Supplementary Table 1. D. Average peptide abundances (scaled to mean = 1) of MCS proteins grouped by localization (color/order key at top) and plotted across infection time (x-axis, grey triangles). Black points are proteins, bold lines connect the median of each timepoint, dotted grey lines represent median abundance in the uninfected state, and numbers indicate the maximum fold-change observed for the given MCS (****p ≤ 0.0001, ***p ≤ 0.001, **p ≤ 0.01, *p ≤ 0.05, N.S. is p > 0.05 by two-way ANOVA across all timepoints and a Dunnett’s multiple comparisons test to Mock). Specific p-values are as follows, from left to right (ER-Mito to Perox-LD) for each infection: HCMV p ≤ 0.0001, p = 0.0004, p ≤ 0.0001, p ≤ 0.0001, p = 0.0024, p = 0.0002, p = 0.0026, p = 0.0018; HSV-1 p = 0.0269, p = 0.0373, N.S., p = 0.0086, N.S., p = 0.0025, N.S., N.S.; Influenza A p ≤ 0.0001, p = 0.0008, p = 0.0274, p = 0.0001, N.S., p = 0.0052, N.S., N.S.; HCoV-OC43 p ≤ 0.0001, p ≤ 0.0001, p = 0.0004, p ≤ 0.0001, p = 0.0003, p = 0.0002, p = 0.0046, N.S.
Fig. 2
Fig. 2. HCMV infection increases and rewires ER-mitochondria contacts into stable encapsulated structures (MENCs).
A Human fibroblasts infected with HCMV and fixed at the indicated timepoints, labeled for: ER (cyan), mitochondria (red), and the viral protein IE1 (magenta) to confirm infection progression. Shown are z-stack max. projections, with a 7×7 µm region (white circles) at right. Scale bars 10 µm. See additional examples in Supplementary Fig. 7. B Line-scans of fluorescence intensity along the length of one (Mock, ER tubule crossings) or several (120 hpi, ER encapsulations) mitochondria, with arrows marking ER crossings. C 3D reconstruction of a 7×7 µm region from a cell at 120 hpi as in A, with ER membranes encasing mitochondria (MENC). D Scoring ER-mitochondria contact phenotypes every 24 hpi from images in A. Key below, error bars are SEM (≥15 mitochondria/cell quantified in ≥33 cells/timepoint, specifically N = 41, 35, 33, 34, 47, and 37 cells for Mock, 24, 48, 72, 96, and 120 hpi, respectively, corresponding to three independent experiments; *p = 0.0107, ***p ≤ 0.0001 by two-way ANOVA to Mock). E Live-cell microscopy (5-sec intervals for 2-min) of ER-mitochondria interactions, shifting from dynamic ER crossings (magenta arrows, top) to stable encapsulations (white, below) or both (yellow, below). F Scoring dynamic (triangle) versus stable (circle, maintained for 2 min.) ER contacts on individual mitochondria from movies as in E, categorized as tubule crossings, encapsulations, or both. Key is below, error bars are SEM (≥20 mitochondria/cell for N = 22, 22, 28, 22, 20, 24 cells for Mock, 24, 48, 72 96, and 120 hpi, respectively, corresponding to three independent experiments; ***p ≤ 0.0001 by two-way ANOVA to Mock). G Super-resolution movies (2 s. intervals for 2 min., 7×7 µm region) of fibroblasts labeled for: ER (cyan), mitochondria (red), and OMM (yellow). Arrows mark an ER-marked constriction-to-fission event (Mock) or MENC (120 hpi). Line-scans (below) are from the first frame of each movie, across an ER-mitochondria junction.
Fig. 3
Fig. 3. The tethering partners VAP-B and PTPIP51 become enriched at MENCs to facilitate HCMV production.
A Average peptide abundances (scaled to the mean) of PTPIP51 (circle) and its ER tether VAP-B (hexagon) during HCMV infection, compared to all other ER-mitochondria MCS proteins (light purple). Shaded regions are standard error of the mean, and p-values are by one-way ANOVA to Mock (data is from MCS-PRM quantification as in Fig. 1, N = 6 biological replicates with ≥3 peptides/protein monitored in each replicate, see Supplementary Data 1 for complete list of peptides). B IF of endogenous PTPIP51 (yellow) during HCMV infection, showing regions from two different cells for each timepoint. Line-scans (below) are across ER (cyan) and mitochondria (red) junctions (arrows). Shown are 7×7 µm regions. C Fixed images (7×7 µm) from cells labeled for mitochondria (red), endogenous PTPIP51 (grey), and VAP-B (yellow) late in HCMV infection. Cartoon represents the observed co-localization of PTPIP51 and VAP-B at MENCs. D Images from live cells labeled for VAP-B (yellow), ER (cyan), and mitochondria (red). Top, 7×7 µm stills from two different cells for each timepoint; Lower, 2-second intervals from the region in C (2.5-minute movie, timepoints above). Arrows indicate points of VAP-B accumulation at ER-mitochondria contacts. E, F Scoring PTPIP51 and VAP-B localization from images in B and D (≥20 mitochondria/cell for PTPIP51 N = 59, 35, 43, 35, 21, 43 cells corresponding to three independently collected experiments and VAP-B N = 35, 18, 35, 33, 21, 31 cells corresponding to two independently collected experiments in Mock, 24, 48, 72, 96, and 120 hpi, respectively; error bars are SEM; ***p ≤ 0.0001 by two-way ANOVA to Mock). G Stills (7×7 µm) from live-cell images of cells labeled for mitochondria (red, mito-BFP) and VAP-B (yellow, eGFP-VAP-B) at 96 hours post-HCMV infection. Arrows indicate stable VAP-B fibers along the mitochondrial length. Timepoints are indicated above. H Proximity ligation assay (PLA) of endogenous PTPIP51-VAP-B interactions during HCMV infection. Left, Violin plots of PLA intensity (solid line is mean, dotted lines are quartiles, N ≥ 38 cells/timepoint, ***p ≤ 0.0001 by two-tailed student’s t-test to Mock). Right, Image of the PLA (yellow) analysis at 120 hpi, with regions near the viral AC (top) and ER-mitochondria co-localization (lower). More examples shown in Supplementary Fig. 9. I Virus titers of PTPIP51 KD versus siRNA control, collected at 120 hpi (Log10 scale, N = 4, ***p ≤ 0.0001 by two-tailed student’s t-test to siCtrl).
Fig. 4
Fig. 4. ER-mitochondria tethering enhances STING-TBK1-IRF3 immune activation upon HCMV infection.
A ER-mitochondria co-localization from images in Fig. 2A (line at median, N = 71, 51, 64, 49, 60, and 86 cells/timepoint in Mock, 24, 48, 72, 96, 120 hpi, respectively, corresponding to 3 independent experiments; ***p ≤ 0.0001 by one-way ANOVA to Mock). B Images of fibroblasts expressing mito-RFP-ER (Tether, yellow) and labeled for ER (cyan), mitochondria (red), and IE1 (magenta). White circles indicate zoomed regions below. Scale bars 10 µm. C HCMV titers from control versus Tether cells (1: 500 ng, 2: 750 ng) (N = 4, ***p ≤ 0.0001 by two-tailed student’s t-test to control). D IE1 expressing cells (immunofluorescent focus forming assay) at 24 hpi, comparing Tether (1: 500 ng, 2: 750 ng) to control (Ctrl, mito-BFP) (N = 8 biological replicates for Mock and 500 ng, N = 6 for 750 ng; *p = 0.014 by two-tailed student’s t-test to Mock). E IE1 levels (immunofluorescent intensity) per nuclei, comparing cell populations as in D (Tukey box-and-whisker plot with lines at median; N = 1342, 1628, 1247 cells in Ctrl, 500 ng, 750 ng, respectively; ***p ≤ 0.0001 by one-way ANOVA with Dunnett’s multiple comparisons test to Ctrl). F Targeted MS quantification of viral protein abundances from different temporal expression classes (IE, DE, L). Heatmap key at top, timepoints left. An ‘X’ indicates proteins not detected in either condition. G Immunofluorescence of endogenous STING localization, comparing non-transfected, control (mito-BFP), and mito-RFP-ER (tether) cells. DAPI and mito-BFP excite at 405 nm and are both shown in blue. Scale bars 10 µm. H Scoring STING aggregation during HCMV infection (Mock, 6, 24 hpi), and upon VACV 70mer transfection. Plotted are percent aggregate-positive cells per field of view (for Mock, 6 hpi, 24, hpi, VACV conditions, respectively: N = 167, 118, 100, 103 cells/condition for Ctrl, N = 160, 188, 80, 73 cells/condition for Tether; line at median, + at mean, whiskers min-max, ***p ≤ 0.001 by two-tailed student’s t-test to Ctrl). I Quantification of secreted interferon abundance comparing conditions as in H by fluorescent bead assay. Shown as a ratio of tether to control cells, key is below (N = 2). J HCMV titers from control (grey) and tether (purple) cells treated with STING inhibitor H-151 (top) and TBK1 inhibitor GSK8612 (lower). Shown as the average ratio to control for each condition (N = 4, error bars are standard deviation; *p ≤ 0.05, ***p ≤ 0.001 by two-tailed student’s t-test to DMSO). K, L HSV-1 (N ≥ 7) and Infl. A (N ≥ 2) titers from control versus tether cells (1: 500 ng, 2: 750 ng) (*p ≤ 0.05, ***p ≤ 0.001 by two-tailed student’s t-test to control). M Scoring STING aggregates during HSV-1 infection (N ≥ 252 cells/timepoint), box-and-whisker plot as in H (***p ≤ 0.001 by two-tailed student’s t-test to Ctrl).
Fig. 5
Fig. 5. ACBD5-mediated ER-peroxisome contacts underlie HCMV-driven changes to peroxisome size and numbers.
A Average peptide abundances (scaled to mean) of ACBD5 (circle) and its ER tether VAP-B (hexagon) during HCMV infection, compared to ACBD4 and VAP-A (light blue lines). Shaded regions are SEM, and p values are by one-way ANOVA to Mock (data is from MCS-PRM quantification as in Fig. 1, N = 6 biological replicates with ≥3 peptides/protein monitored in each replicate, see Supplementary Data 1 for complete list of peptides). B PLA quantification of endogenous ACBD5-VAP-B interactions. Plotted are PLA signal counts (solid line at mean, dotted lines at quartiles, N ≥ 40 cells/timepoint, **p ≤ 0.01, ***p ≤ 0.001 by two-tailed student’s t-test to Mock). C Movies of ER (cyan) and peroxisomes (white/red) before and 120 hpi, showing whole-cell and zoomed stills (white circles, lower). Scale bars 10 µm. D Fixed fibroblasts in late (72–120 hpi) stages of HCMV infection, labelled for: ER (cyan), peroxisome membranes (red), and HCMV IE1 (magenta). Each channel from a zoomed region (white circles) is shown at right, including an ER-peroxisome overlap mask heat-colored by increasing overlap. Arrows indicate enlarged (yellow) or small (white) peroxisomes, localizing with expanded or tubular ER, respectively. Scale bars 10 µm. E IF analysis of peroxisomes (PEX14 antibody) before and 120 hpi, comparing control to ACBD5 KD and OE (10×10 µm). See Supplementary Fig. 13 for more examples. F Quantification of peroxisome surface area in control (Ctrl, N = 8973 peroxisomes from 15 cells in Mock, N = 11,991 peroxisomes from 15 cells in 120 hpi), ACBD5 KD (N = 16,625 peroxisomes from 15 cells in Mock, N = 33,392 peroxisomes from 28 cells in 120 hpi), and ACBD5 OE (N = 3961 peroxisomes from 15 cells in Mock, N = 5174 peroxisomes from 15 cells in 120 hpi) cells before and 120 hpi (solid line at median, dotted lines at quartiles; **p ≤ 0.01, ***p ≤ 0.001 by two-tailed student’s t-test to Ctrl/timepoint). G. HCMV titers from ACBD5 KDs (two siRNAs) and OEs (1: 250 ng, 2: 500 ng) versus either siRNA or plasmid controls (N = 4, ***p ≤ 0.001 by two-tailed student’s t-test). H Peroxisome counts per cell in control (Ctrl, N = 70 cells in Mock, N = 20 cells in 120 hpi), ACBD5 KD (N = 28 cells in Mock, N = 23 cells in 120 hpi), and ACBD5 OE cells (N = 42 cells in Mock, N = 15 cells in 120 hpi) (solid line at median, dotted lines at quartiles; ***p ≤ 0.0001 by two-tailed student’s t-test to Ctrl/timepoint). IK. HSV-1 (N = 4 biological replicates, *p = 0.0151 and **p = 0.0014), Infl. A (N ≥ 3, ***p = 0.0005 and ***p = 0.0003), and HCoV-OC43 (N = 8, ***p ≤ 0.0001) titer measurements in control versus ACBD5 OE cells (1: 250 ng, 2: 500 ng, p-values by two-tailed student’s t-test to control).
Fig. 6
Fig. 6. ER-mitochondria and ER-peroxisome contacts are required for HCMV-driven organelle remodeling.
A Model for ER-mitochondria contact remodeling during the HCMV infectious cycle. Contact is decreased early to evade STING-TBK1-IRF3 signaling induced by increased ER-mitochondria tethering, a shared function with HSV-1 and likely Infl. A. Late in infection, contact is increased and restructured into ER-mitochondria encapsulations (MENCs) that recruit VAP-B and then PTPIP51, which increase in tethering interactions, and PTPIP51 is required for HCMV production. B Model for ER-peroxisome contact functions during HCMV infection. Early in infection, increased ACBD5-mediated contact prevents virus-induced peroxisome proliferation and restricts HCMV, HSV-1, Infl. A, and HCoV-OC43 production. As infection progresses, ER-peroxisome contact is increased and enriched at the enlarged peroxisomes formed by infection, which require ACBD5-VAP-B tethering to form.

Similar articles

Cited by

References

    1. Cook KC, Cristea IM. Location is everything: protein translocations as a viral infection strategy. Curr. Opin. Chem. Biol. 2019;48:34–43. doi: 10.1016/j.cbpa.2018.09.021. - DOI - PMC - PubMed
    1. Jean Beltran PM, et al. Exploring and Exploiting Proteome Organization during Viral Infection. J. Virol. 2017;91:JVI.00268–17. doi: 10.1128/JVI.00268-17. - DOI - PMC - PubMed
    1. Tyl MD, Betsinger CN, Cristea IM. Virus-host protein interactions as footprints of human cytomegalovirus replication. Curr. Opin. Virol. 2022;52:135–147. doi: 10.1016/j.coviro.2021.11.016. - DOI - PMC - PubMed
    1. Jean Beltran PM, et al. A Portrait of the Human Organelle Proteome In Space and Time during Cytomegalovirus Infection. Cell Syst. 2016;3:361–373.e6. doi: 10.1016/j.cels.2016.08.012. - DOI - PMC - PubMed
    1. Zeltzer S, et al. Virus control of trafficking from sorting endosomes. mBio. 2018;9:1–18. doi: 10.1128/mBio.00683-18. - DOI - PMC - PubMed

Publication types