. 2022 Aug 11;13(1):4710.
doi: 10.1038/s41467-022-32321-0.

Comparative immunogenicity and reactogenicity of heterologous ChAdOx1-nCoV-19-priming and BNT162b2 or mRNA-1273-boosting with homologous COVID-19 vaccine regimens

Affiliations

Comparative immunogenicity and reactogenicity of heterologous ChAdOx1-nCoV-19-priming and BNT162b2 or mRNA-1273-boosting with homologous COVID-19 vaccine regimens

Verena Klemis et al. Nat Commun. .

Abstract

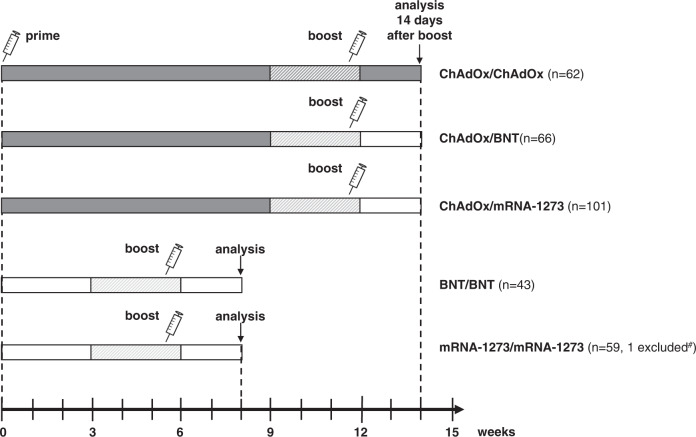
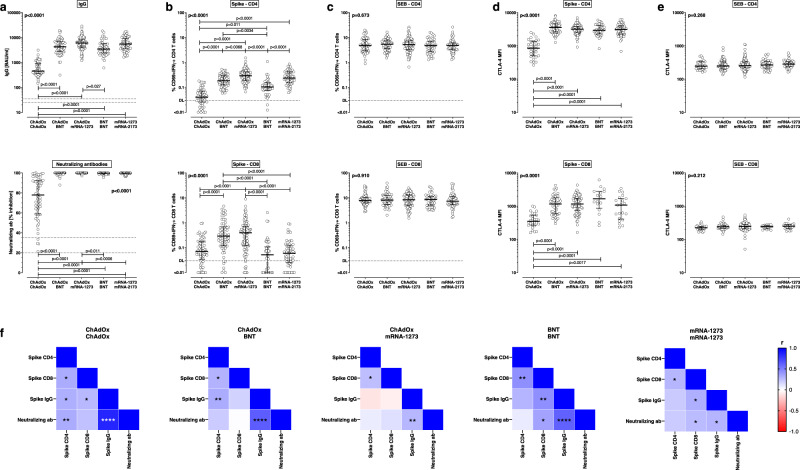
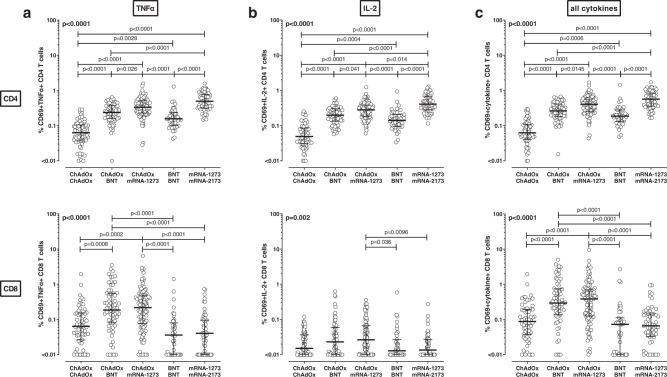
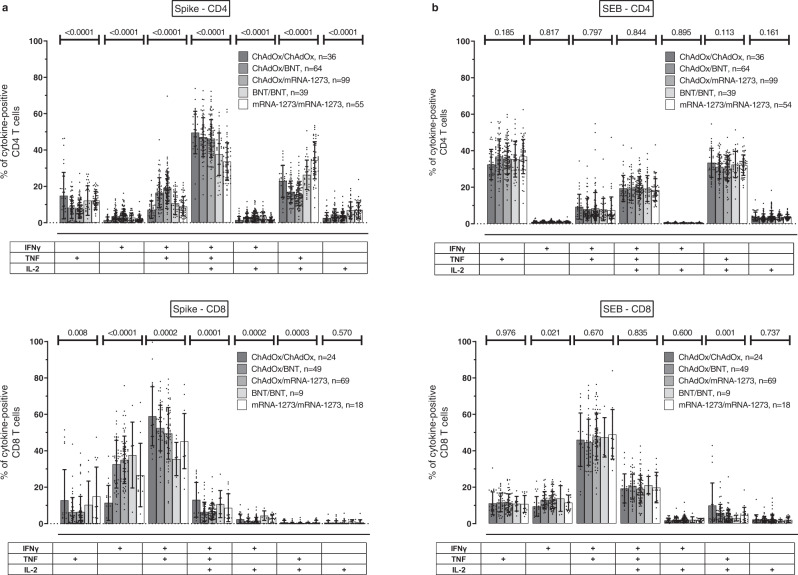
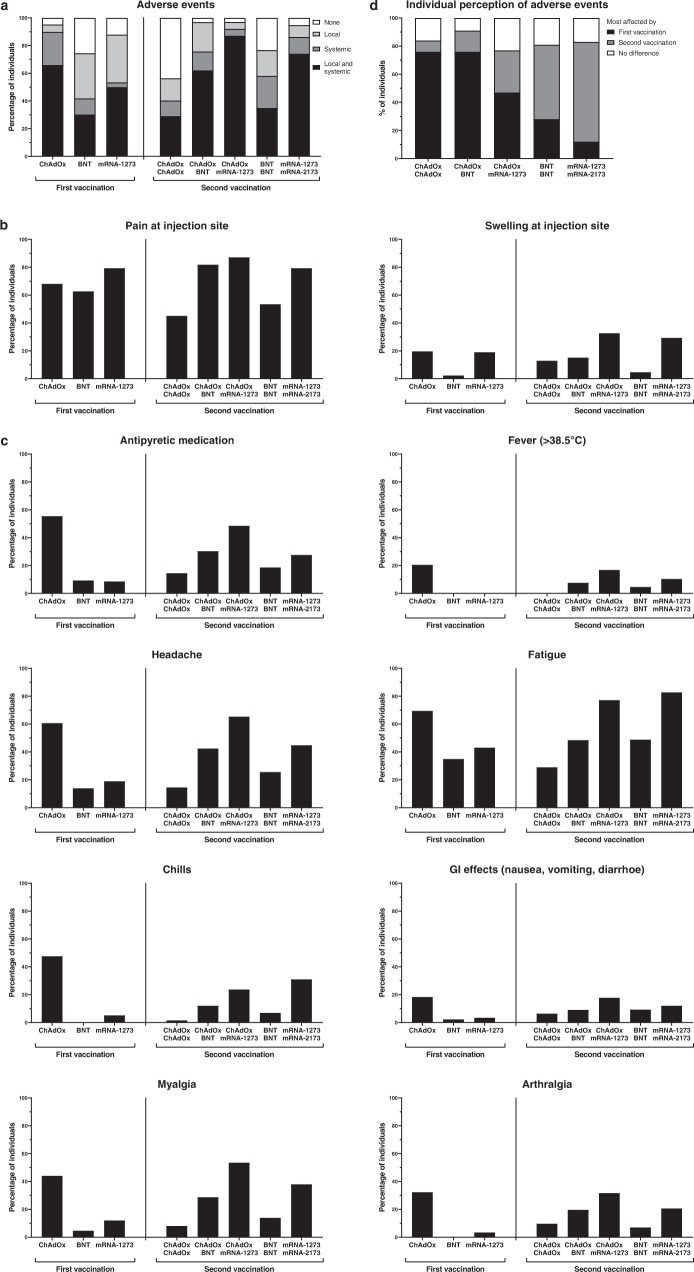
Comparative analyses of the immunogenicity and reactogenicity of homologous and heterologous SARS-CoV-2 vaccine-regimens will inform optimized vaccine strategies. Here we analyze the humoral and cellular immune response following heterologous and homologous vaccination strategies in a convenience cohort of 331 healthy individuals. All regimens induce immunity to the vaccine antigen. Immunity after vaccination with ChAdOx1-nCoV-19 followed by either BNT162b2 (n = 66) or mRNA-1273 (n = 101) is equivalent to or more pronounced than homologous mRNA-regimens (n = 43 BNT162b2, n = 59 mRNA-1273) or homologous ChAdOx1-nCoV-19 vaccination (n = 62). We note highest levels of spike-specific CD8 T-cells following both heterologous regimens. Among mRNA-containing combinations, spike-specific CD4 T-cell levels in regimens including mRNA-1273 are higher than respective combinations with BNT162b2. Polyfunctional T-cell levels are highest in regimens based on ChAdOx1-nCoV-19-priming. All five regimens are well tolerated with most pronounced reactogenicity upon ChAdOx1-nCoV-19-priming, and ChAdOx1-nCoV-19/mRNA-1273-boosting. In conclusion, we present comparative analyses of immunogenicity and reactogenicity for heterologous vector/mRNA-boosting and homologous mRNA-regimens.


Conflict of interest statement

M.S. has received grant support from Astellas and Biotest to the organization Saarland University outside the submitted work, and honoraria for lectures from Biotest and Novartis. All other authors of this manuscript have no conflicts of interest to disclose.

Figures

Fig. 1
Fig. 1. Design of the study.
Schematic representation of the five vaccine regimens (three homologous: ChAdOx/ChAdOx n = 62, BNT/BNT n = 43, mRNA-1273/mRNA-1273 n = 59; two heterologous: ChAdOx/BNT n = 66, ChAdOx/mRNA-1273 n = 101). Shown are the time frames between the first (prime) and the second (boost) vaccination, and between the boost vaccination and the day of blood analysis. #One individual of the mRNA-1273/mRNA-1273 group was excluded from further analysis due to detectable IgG towards the SARS-CoV-2 nucleocapsid.
Fig. 2
Fig. 2. Antibody and T-cell responses against the SARS-CoV-2 spike protein after homologous COVID-19 vaccine regimens or heterologous ChAdOx-priming and BNT- or mRNA-1273-boosting.
Cellular and humoral immune parameters were analyzed 13–18 days post vaccination and compared between individuals with different homologous or heterologous COVID-19 vaccine regimens: homologous ChAdOx vaccination (n = 62), heterologous ChAdOx/BNT vaccination (n = 66), heterologous ChAdOx/mRNA-1273-vaccination (n = 101), homologous BNT vaccination (n = 43) or homologous mRNA-1273-vaccination (n = 58). a ELISA and surrogate neutralization assays were performed to quantify levels of spike-specific IgG and neutralizing antibodies. Intracellular cytokine staining after antigen-specific stimulation of whole blood samples allowed for flow-cytometrical determination of SARS-CoV-2 spike-specific (b) and SEB-reactive (c) CD4 and CD8 T-cell levels. Reactive cells were identified by co-expression of CD69 and IFNγ among CD4 or CD8 T cells and subtraction of reactivity of respective negative control stimulations. CTLA-4 expression was determined on d spike-specific and e SEB-reactive CD4 and CD8 T cells in all samples with at least 20 cytokine-positive CD4 and CD8 T cells. f Correlation matrix of spike-specific T-cell and antibody responses among each group. Bars in ae represent medians with interquartile ranges. Differences between the groups were calculated using two-sided Kruskal–Wallis test with Dunn´s multiple comparisons post-test. Correlations in f were analyzed according to two-tailed Spearman (see also Supplementary Table 1). Dotted lines indicate detection limits for antibodies in a, indicating negative, intermediate, and positive levels or levels of inhibition, respectively as per manufacturer’s instructions, and detection limits for SARS-CoV-2-specific CD4 T cells in b and c. Source data are provided as a Source Data file. IFN Interferon, MFI median fluorescence intensitiy, SEB Staphylococcus aureus enterotoxin B.
Fig. 3
Fig. 3. SARS-CoV-2-specific cytokine expression after homologous or heterologous COVID-19 vaccination.
Levels of TNFα and IL-2-expressing T cells and combined expression of either of the cytokine IFNγ, TNFα and/or IL-2 were compared between individuals who either received homologous ChAdOx vaccination (n = 62), heterologous ChAdOx/BNT vaccination (n = 66), heterologous ChAdOx/mRNA-1273-vaccination (n = 101), homologous BNT vaccination (n = 43) or homologous mRNA-1273 vaccination (n = 58). Percentages of CD69+ TNFα+ (a), CD69+ IL-2+ b or CD69-positive cells co-expressing at least one of the cytokines TNFα, IL-2, or IFNγ (c) among total CD4 (upper panel) or CD8 T cells (lower panel) were determined after stimulation of whole blood samples with overlapping peptides of SARS-CoV-2 spike protein and subtraction of background reactivity from negative control stimulations. Bars represent medians with interquartile ranges and two-sided Kruskal–Wallis test with Dunn´s multiple comparisons post-test was used to calculate differences between the groups. Source data are provided as a Source Data file. IFN interferon, IL interleukin, SEB Staphylococcus aureus enterotoxin B, TNF tumor necrosis factor.
Fig. 4
Fig. 4. Antigen-specific cytokine-expression profiles of T cells in individuals with different homologous and heterologous COVID-19 vaccination regimens.
After antigen-specific stimulation (a) or polyclonal stimulation with Staphylococcus aureus enterotoxin B (SEB, b) of whole blood samples from individuals with different homologous or heterologous vaccination regimens, cytokine-expressing CD4 and CD8 T cells were subclassified into seven subpopulations according to single or combined expression of IFNγ, IL-2, and TNFα. Blood samples from all individuals were analyzed. To ensure robust statistics, only samples with at least 30 cytokine-expressing CD4 or CD8 T cells after normalization to the negative control stimulation were considered (with the number of samples in each vaccine group indicated in the figures). Bars in a and b represent means and standard deviations, and ordinary one-way ANOVA tests were performed. Source data are provided as a Source Data file. IFN interferon, IL interleukin, TNF tumor necrosis factor.
Fig. 5
Fig. 5. Reactogenicity after primary and secondary vaccination with homologous and heterologous COVID-19 vaccine regimens.
According to their COVID-19 vaccine regimens, individuals were classified into three groups after dose 1 (ChAdOx vector (n = 229), BNT (n = 43) or mRNA-1273 vaccine (n = 58)) and five groups after dose 2 (homologous: ChAdOx/ChAdOx, n = 62; BNT/BNT, n = 43; mRNA-1273/mRNA-1273, n = 58; heterologous: ChAdOx/BNT, n = 66; ChAdOx/mRNA-1273, n = 101). Self-reported reactogenicity within the first week after each vaccine dose was assessed using a standardized questionnaire. The presence of local or systemic adverse events in general (a), substantial local (b) or systemic adverse events (c), and individual perception of which of the two vaccinations affected more (d) are shown. Statistical analyses of differences between the groups after the first and the second vaccination are shown in Supplementary Tables 2 and 3. Source data are provided as a Source Data file.

Similar articles

Cited by

References

    1. Vygen-Bonnet S, et al. Beschluss der STIKO zur 5. Aktualisierung der COVID-19-Impfempfehlung und die dazugehörige wissenschaftliche Begründung. Epid. Bull. 2021;19:24–36.
    1. Koch J, et al. STIKO-Empfehlung zur COVID-19-Auffrischimpfung mit einem mRNA Impfstoff für Personen ≥70 Jahre und bestimmte Indikationsgruppen sowie Empfehlung zur Optimierung der Grundimmunisierung mit einem mRNA Impfstoff nach vorausgegangener Impfung mit der COVID-19 Vaccine Janssen und die dazugehörige wissenschaftliche Begründung. Epid. Bull. 2021;43:16–53.
    1. Schmidt T, et al. Immunogenicity and reactogenicity of heterologous ChAdOx1 nCoV-19/mRNA vaccination. Nat. Med. 2021;27:1530–1535. doi: 10.1038/s41591-021-01464-w. - DOI - PMC - PubMed
    1. Hillus D, et al. Safety, reactogenicity, and immunogenicity of homologous and heterologous prime-boost immunisation with ChAdOx1 nCoV-19 and BNT162b2: a prospective cohort study. Lancet Respir. Med. 2021;9:1255–1265. doi: 10.1016/S2213-2600(21)00357-X. - DOI - PMC - PubMed
    1. Barros-Martins, J. et al. Immune responses against SARS-CoV-2 variants after heterologous and homologous ChAdOx1 nCoV-19/BNT162b2 vaccination. Nat. Med.27, 1525–1529 (2021). - PMC - PubMed

Publication types