. 2022 Aug 11;12(1):13659.
doi: 10.1038/s41598-022-17696-w.

Discovery of anti-Formin-like 1 protein (FMNL1) antibodies in membranous nephropathy and other glomerular diseases

Affiliations

Discovery of anti-Formin-like 1 protein (FMNL1) antibodies in membranous nephropathy and other glomerular diseases

Maurizio Bruschi et al. Sci Rep. .

Abstract

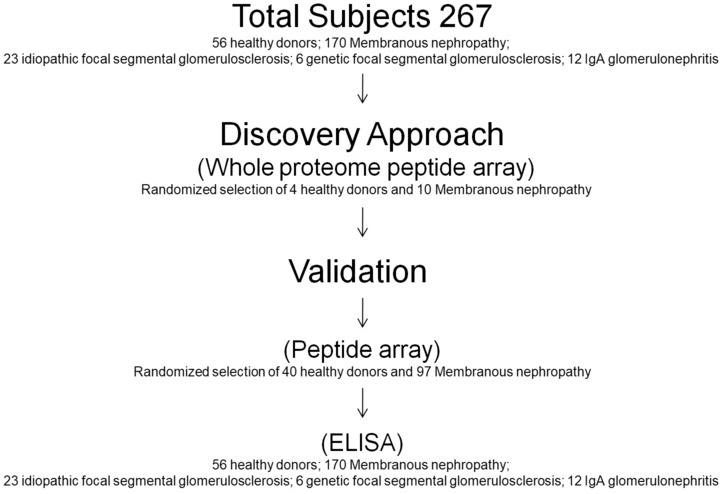
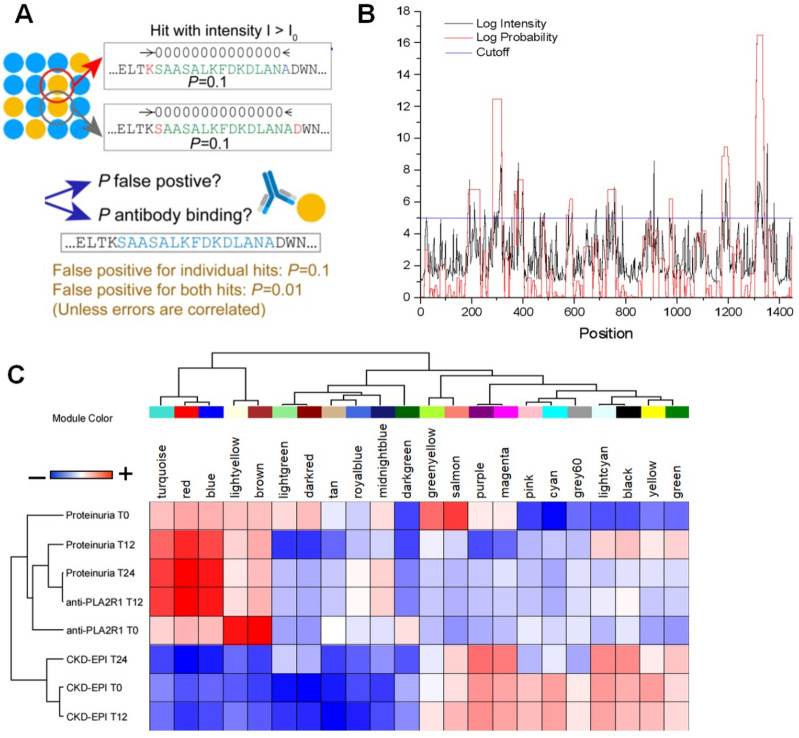
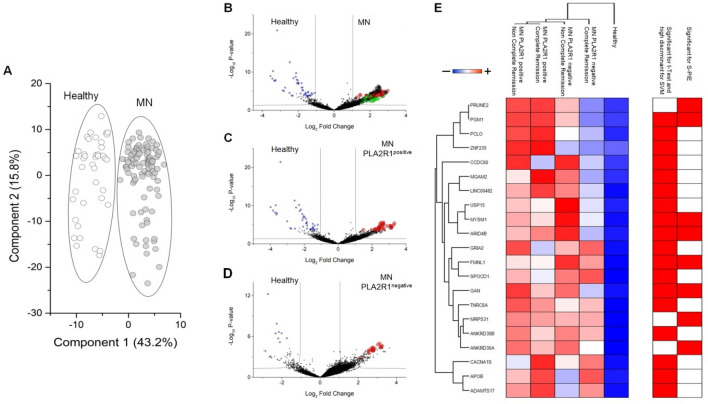
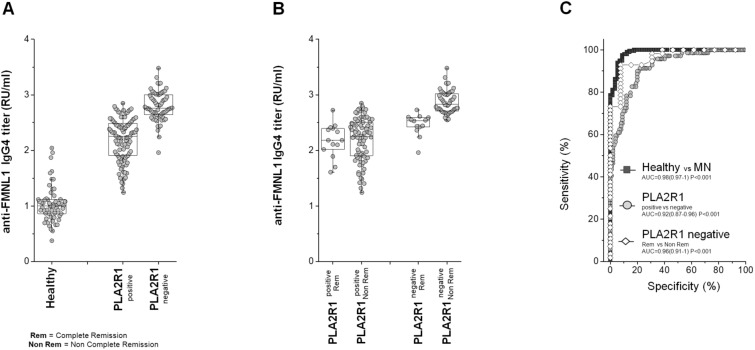
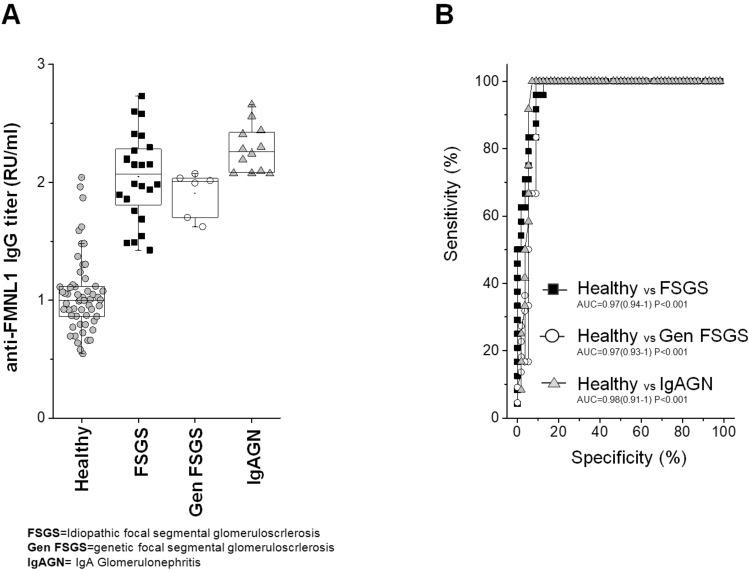
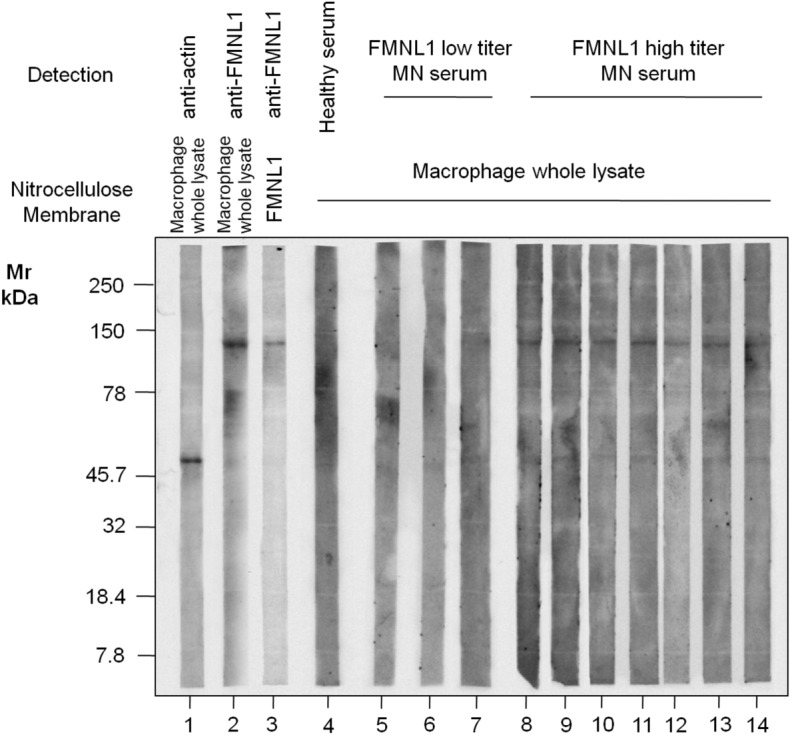
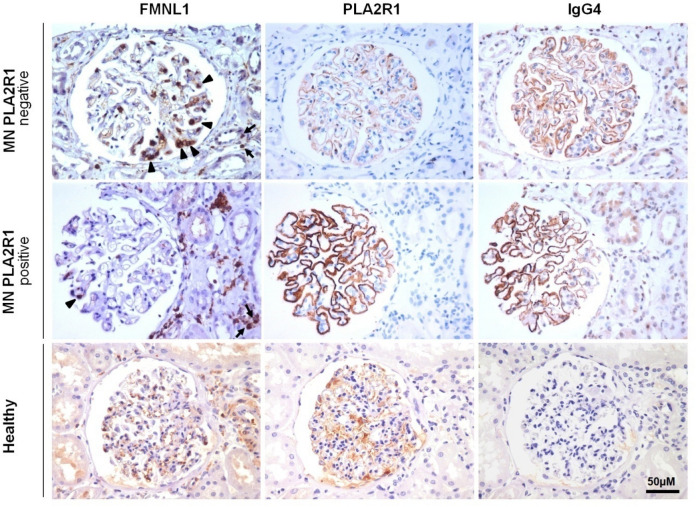
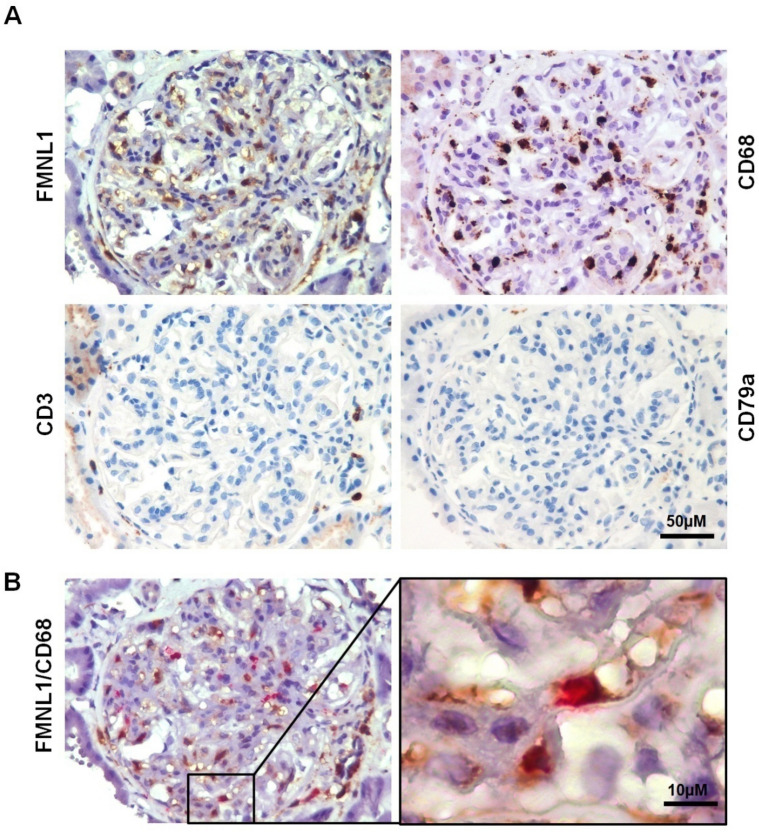
Evidence has shown that podocyte-directed autoantibodies can cause membranous nephropathy (MN). In the present work we investigated sera of MN patients using a high-density peptide array covering the whole coding sequences of the human genome encompassing 7,499,126 tiled peptides. A panel of 21 proteins reactive to MN sera were identified. We focused our attention on Formin-like 1 (FMNL1), a protein expressed by macrophages in MN patients tissues. High levels of anti-FMNL1 IgG4 were demonstrated in sera of MN patients with an orthogonal methodology (ELISA) contemporary demonstrating FMNL1 positive cells in kidney co-staining with CD68 in glomeruli. High levels of circulating anti-FMNL1 IgG4 were associated with lack of remission of proteinuria, potentially indicating that autoantibodies directed against cells other than podocytes, involved in tissue repair, might play a role in MN disease progression. High serum levels of anti-FMNL1 IgGs were also observed in other non-autoimmune glomerolonephrites, i.e. idiopathic and genetic FSGS, IgAGN. These findings are suggestive of a broader role of those autoantibodies in other glomerular disease conditions.


Conflict of interest statement

M.P., J.J.P, J.C.T, and K.C.L were Roche employees at the time of those researches. The other authors declare no competing interests.

Figures

Scheme 1
Scheme 1
Scheme of the numbers of subjects used in the different phases of the study. The discovery phase of novel autoantibodies was performed in a subset of 4 healthy donors and 10 MN patients randomly extracted from the whole sample dataset. Then, the validation of results deriving from the previous phase was carried out first using the validation peptide array in 40 healthy donors and 97 MN patients, and finally, the selected autoantibodies were validated using ELISA in all subjects of the study.
Figure 1
Figure 1
Method validation. (A) Illustration of the S-PIE underlying principle. Let P be the probability that a peptide with a fluorescence intensity larger than some threshold (I0) is a false positive. Then for two consecutive peptides the probability of both being false positive is equal to P^2. The same holds for longer stretches, which enable the identification of most probable epitopes. (B) Two-dimensional plot of peptides fluorescence intensity and their S-PIE analysis. (C) Heatmap showing the module-trait weighted relationships between the identified modules in Whole proteome peptide discovery array and the trait indicator of samples. The color scale on the top shows a module-trait relationship from − 1 (blue) to 1 (red), where blue represents a perfect negative correlation and red a perfect positive correlation.
Figure 2
Figure 2
Validation Peptides array. (A) Scatter plot of Multidimensional Scaling (MDS) analysis of validation peptide intensity profiles of healthy (open circles) and MN (grey circles) patients. Symbols and ellipses indicate respectively each sample and the 95% confidence interval of the two conditions. Visual inspection of the scatter plot demonstrates the ability of their intensity value to clearly discriminate between the healthy and MN patient conditions. (B–D) Volcano plot of statistically significant peptides in the comparison between healthy and all MN patients (B) or healthy and MN anti-PLA2R1 positive (C) or healthy and MN anti-PLA2R1 negative (D). Small Black, blue, red, green and large black circles show respectively not statistically significant peptides, statistically up-regulated in healthy or in MN patients (positive or negative for anti-PLA2R1), selected from S-PIE, WGCNA and t-test analyses. The black line shows the cut-off of statistical significance. (E) Heatmap of 21 core proteins identified through the combined use of WGCNA, univariate statistical analysis, support vector machine learning and S-PIE analysis. In the heatmap, each row represents a protein and each column corresponds to a clinical condition. Normalized Z-scores of protein abundance are depicted by a pseudocolor scale with red indicating positive expression, white equal expression and blue negative expression compared to each protein value, whereas the dendrogram (on the top and left) displays the outcome of unsupervised hierarchical clustering analysis, placing similar sample/proteome profile values near each other. Visual inspection of the dendrogram and heat map demonstrates the ability of these proteins to clear discriminate between the different conditions.
Figure 3
Figure 3
ELISA assay for anti-FMNL1 serum levels in patients with MN. (A) Box plot showing the median and interquartile range value of serum for anti-FMNL1 in all subjects of study. Anti-FMNL1 was statistically significant more abundant in MN patientsanti-PLA2R1 negative compared to healthy donors and MN anti-PLA2R1 positive (P < 0.0001). (B) Box plot of serum anti-FMNL1 in MN patients stratified in function of anti-PLA2R1 positivity and their range of proteinuria after one year from hospitalization (< 0.3 g/d complete remission; > 0.3 g/d no complete remission). Anti-FMNL1 was statistically significant more abundant in MN patients anti-PLA2R1 negative in no complete remission compared with all other MN patients (P < 0.0001). Moreover, no difference was present in anti-FMNL1 titer between MN patients anti-PLA2R1 positive in complete remission or not and anti-PLA2R1 negative in complete remission. (C) ROC curve analysis for FMNL1 assay.
Figure 4
Figure 4
ELISA assay for anti-FMNL1serum levels in other glomerulonephritis. (A) The same ELISA modified for detection of total IgGs was utilized to test serum levels of anti-FMNL1 antibodies in patients affected by other hystologic and genetic forms of glomerulonephritis: 23 with idiopathic FSGS, 6 with genetic FSGS and12 with IgA glomerulonephritis. Anti-FMNL1 levels were statistically significant more abundant in all these groups compared with normal subjects (P < 0.0001). (B) ROC curve analysis for anti-FMNL1IgGs in comparison with normal controls.
Figure 5
Figure 5
Characterization of macrophage antigens profile recognized by serum of healthy donors and MN patients. Representative western blot analysis of full length gel of macrophage antigen profile. Recombinant FMNL1 (lane 3) and macrophage whole lysate (lanes 1–2, and 4–12) were separated by SDS-PAGE in reducing conditions, transferred onto nitrocellulose membrane, and incubated with monoclonal anti-actin (lane 1), monoclonal anti-FMNL1 (lanes 2 and 3), a pool of healthy serum (lane 4) or MN patients low titer (lanes 5–7) or high titer (lanes 8–14) for anti-FMNL1 ELISA assay. Finally, membranes were developed, at the same time, with anti-Mouse IgG-HRP conjugated (lane 1–3) or anti-Human IgG4 HRP conjugated (4–14). IgG4 of MN patients with high titer for anti-FMNL1 in ELISA recognizes a band with the same molecular weight of recombinant FMNL1 protein. Besides, the same molecular weight band is recognized in macrophage whole lysate by monoclonal anti-FMNL1. In addition, IgG4 of MN patients recognizes a faint band with the same molecular weight of actin. Nitro cellulose membrane were cut perpendicular to the electrophoresis migration front to obtain a full length membrane strips of macrophage whole lysate and to allow the individually labeled and detection (at the same time) with anti-FMNL1, anti-actin and different healthy or patients sera.
Figure 6
Figure 6
FMNL1 expression in MN biopsies and normal renal tissue. Immunohistochemistry was performed using FMNL1, PLA2R1 and IgG4 antibodies on PLA2R1 negative and positive MN biopsies and on normal renal tissue. In MN, FMNL1 was detected in circulating cells within glomerular capillaries (arrow heads) and in some cells in the interstitial space (arrows). Glomerular FMNL1 staining was distinctly different from staining of PLA2R1 (PLA2R1 positive MN) and IgG4 (PLA2R1 positive and negative MN) and was particularly expressed in PLA2R1 negative MN (patient with secondary MN due to lymphoma, patient 10) compared with PLA2R1 positive MN (patient 6). Arrowheads indicate FMNL1 positive glomerular circulating cells, arrows FMNL1 positive interstitial cells. Original magnification 320×, scale bar: 50 µm.
Figure 7
Figure 7
Characterization of FMNL1 expressing cells in renal biopsies. (A) Serial sections of PLA2R1 negative MN were immunostained with FMNL1, CD68 (monocyte/macrophage marker), CD3 (lymphocyte T marker) and CD79a (lymphocyte B marker) antibodies. Glomerular circulating cells expressing FMNL1 were CD68 positive and CD3 and CD79a negative. Original magnification 320x, scale bar: 50 µm. (B) PLA2R1 negative MN section was double immunostained with FMNL1 and CD68 Representative micrographs of glomerular circulating cells positively stained with FMNL1 (brown) and CD68 (red). Boxed area is enlarged in the right side of the figure. Magnification 320x, scale bar: 50 µm; Boxed area magnification 1600 x, scale bar:10 µm.

Similar articles

Cited by

References

    1. Beck LH, Jr, et al. M-type phospholipase A2 receptor as target antigen in idiopathic membranous nephropathy. N. Engl. J. Med. 2009;361:11–21. doi: 10.1056/NEJMoa0810457. - DOI - PMC - PubMed
    1. Tomas NM, et al. Thrombospondin type-1 domain-containing 7A in idiopathic membranous nephropathy. N. Engl. J. Med. 2014;371:2277–2287. doi: 10.1056/NEJMoa1409354. - DOI - PMC - PubMed
    1. Prunotto M, et al. Autoimmunity in membranous nephropathy targets aldose reductase and SOD2. J. Am. Soc. Nephrol. 2010;21:507–519. doi: 10.1681/ASN.2008121259. - DOI - PMC - PubMed
    1. Sethi S, et al. Exostosin 1/exostosin 2-associated membranous nephropathy. J. Am. Soc. Nephrol. 2019;30:1123–1136. doi: 10.1681/ASN.2018080852. - DOI - PMC - PubMed
    1. Sethi S, et al. Neural epidermal growth factor-like 1 protein (NELL-1) associated membranous nephropathy. Kidney Int. 2020;97:163–174. doi: 10.1016/j.kint.2019.09.014. - DOI - PubMed

Publication types