. 2022 Sep;25(9):1149-1162.
doi: 10.1038/s41593-022-01131-4. Epub 2022 Aug 11.

A CRISPRi/a platform in human iPSC-derived microglia uncovers regulators of disease states

Affiliations

A CRISPRi/a platform in human iPSC-derived microglia uncovers regulators of disease states

Nina M Dräger et al. Nat Neurosci. 2022 Sep.

Abstract

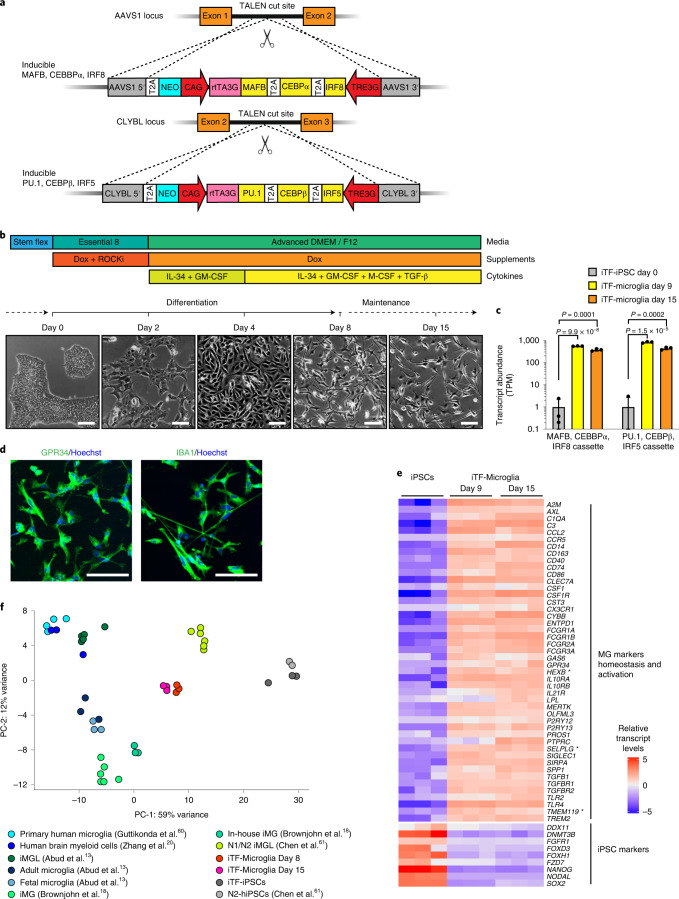
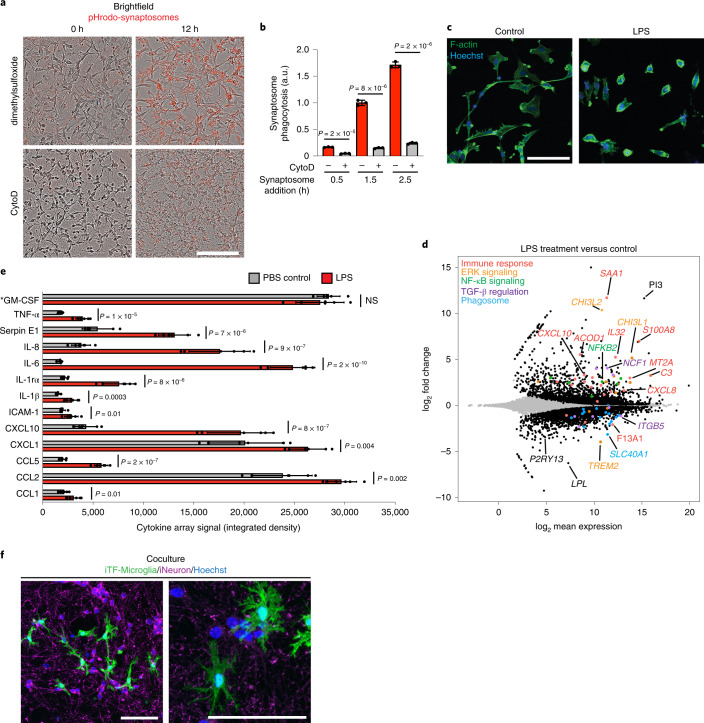
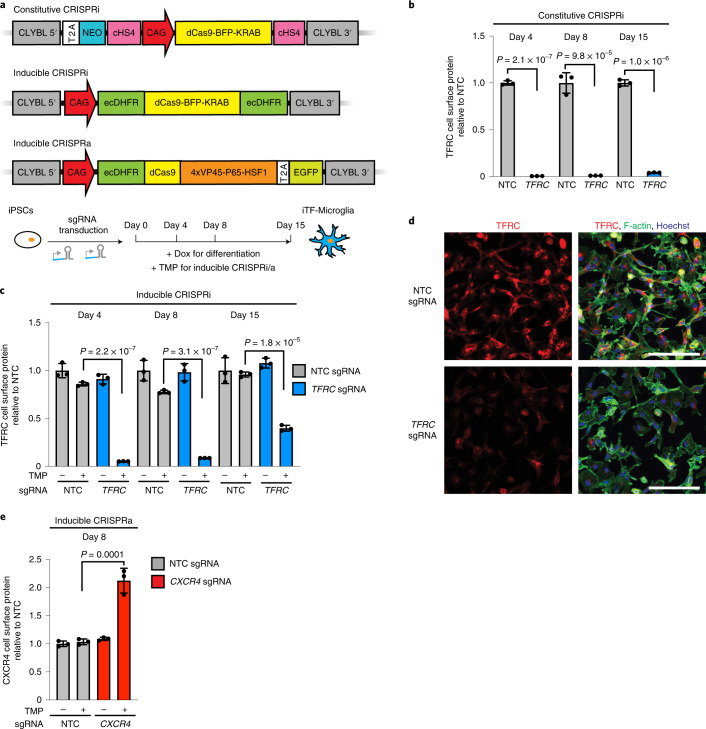
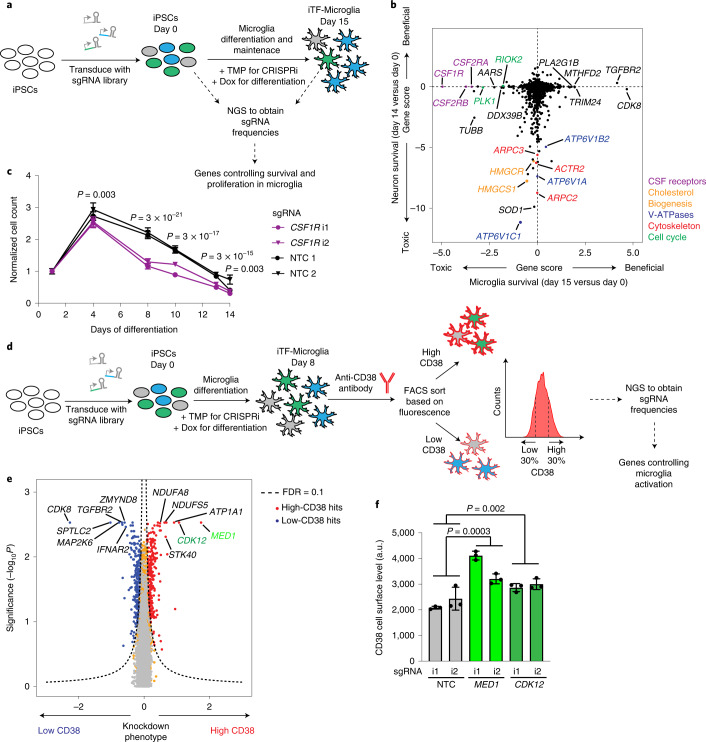
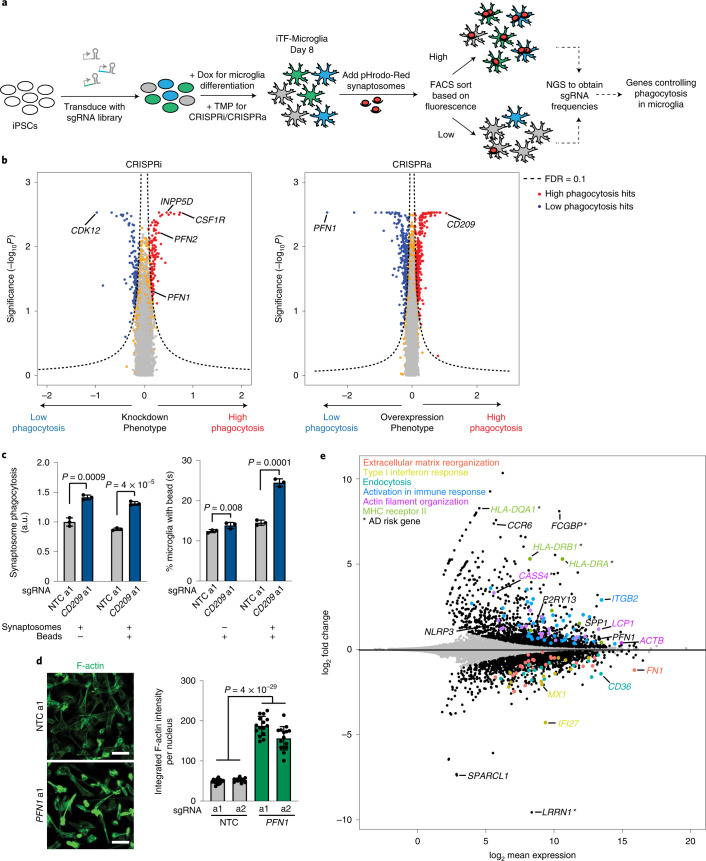
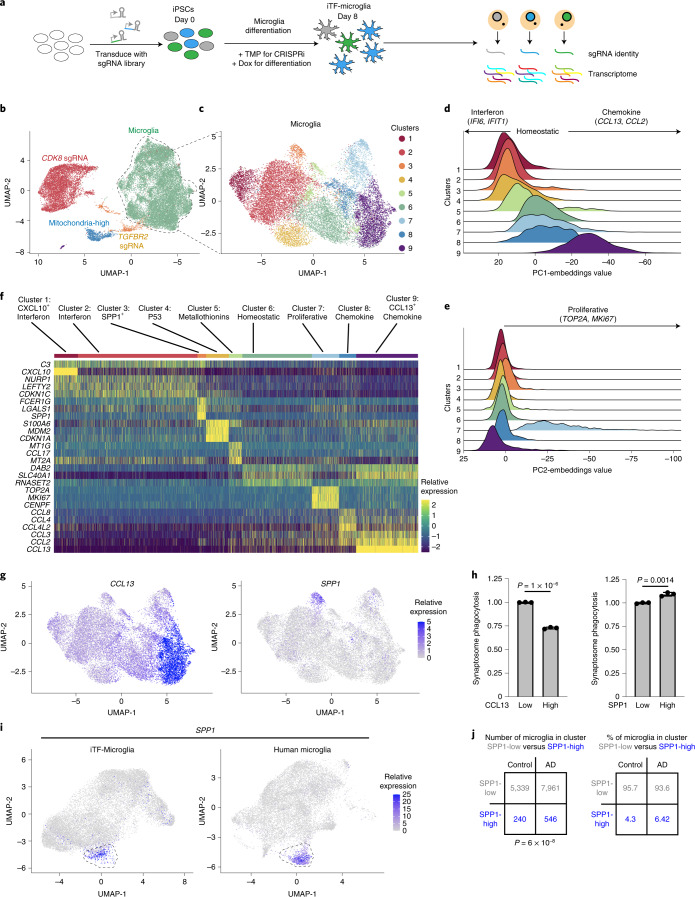
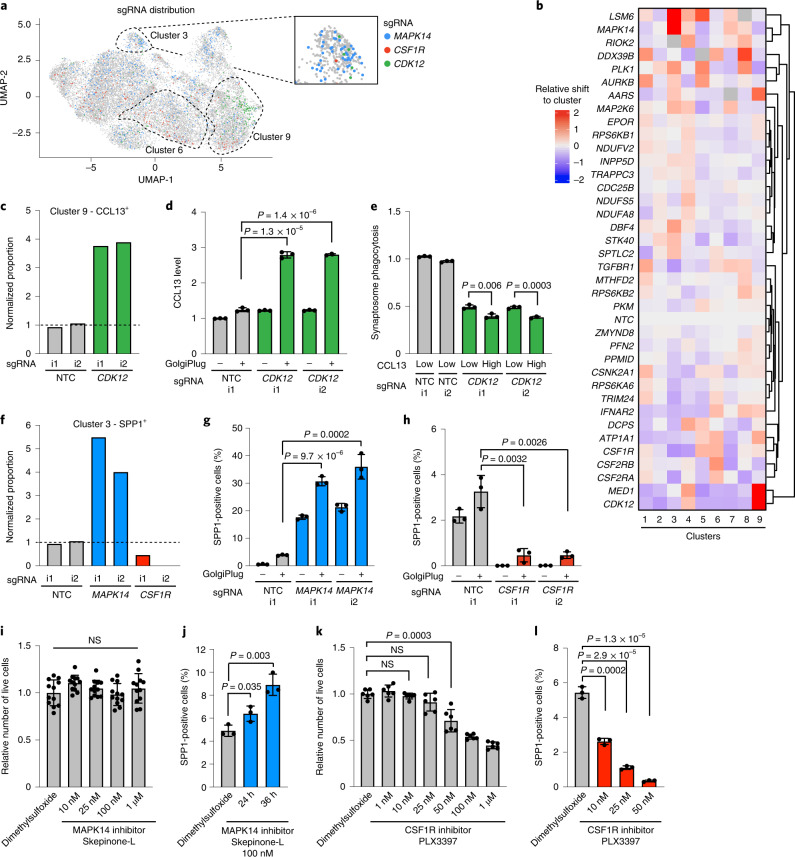
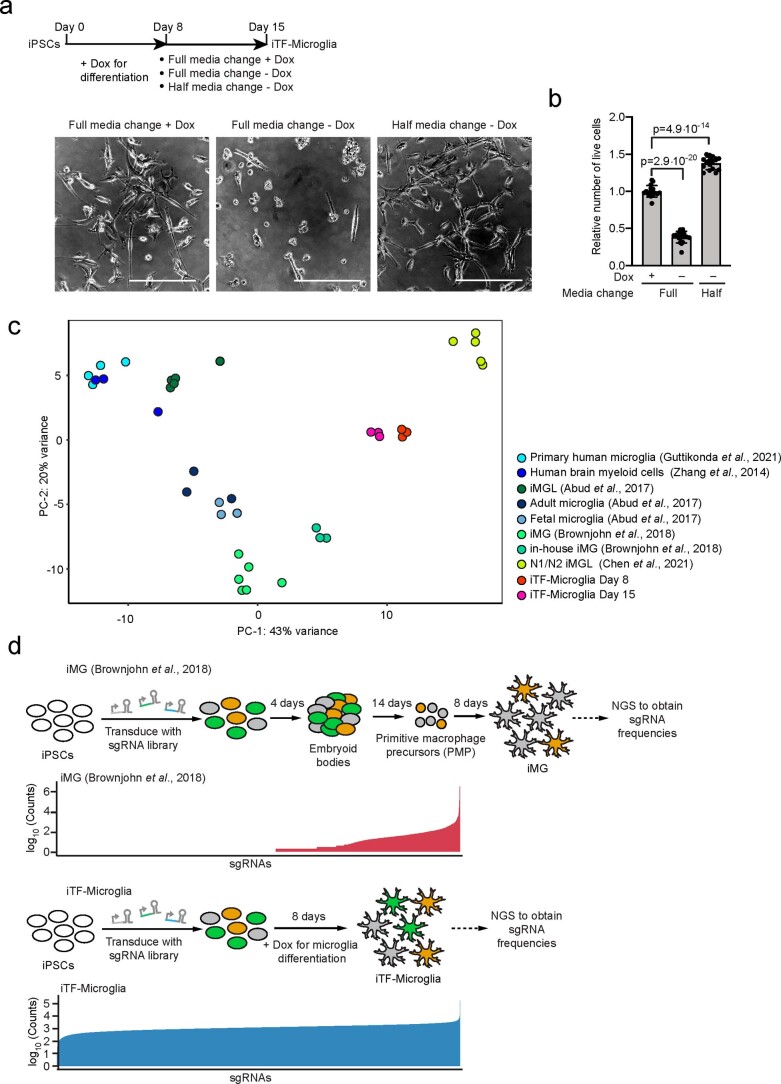
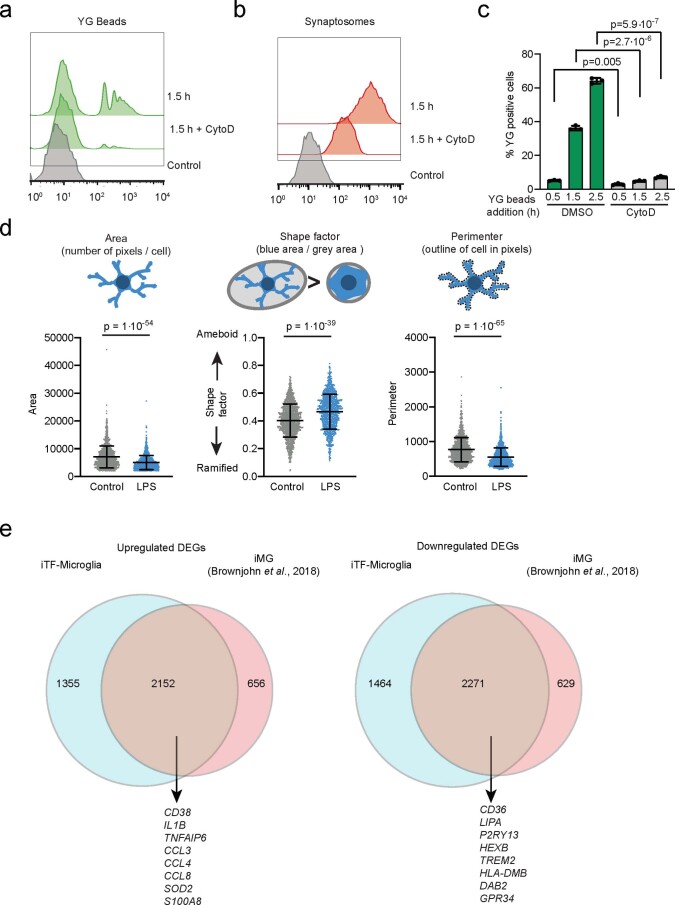
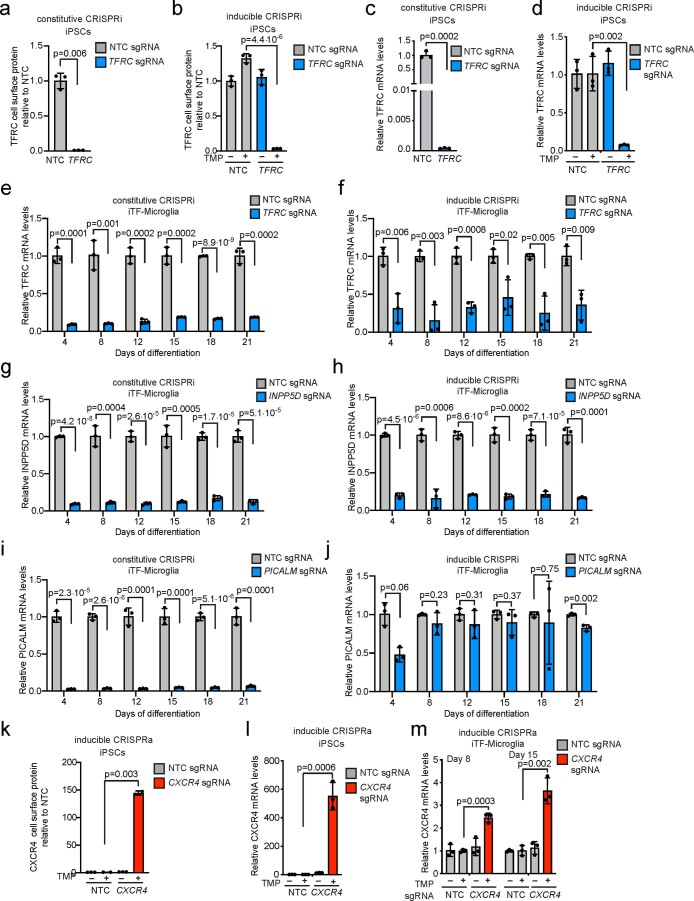
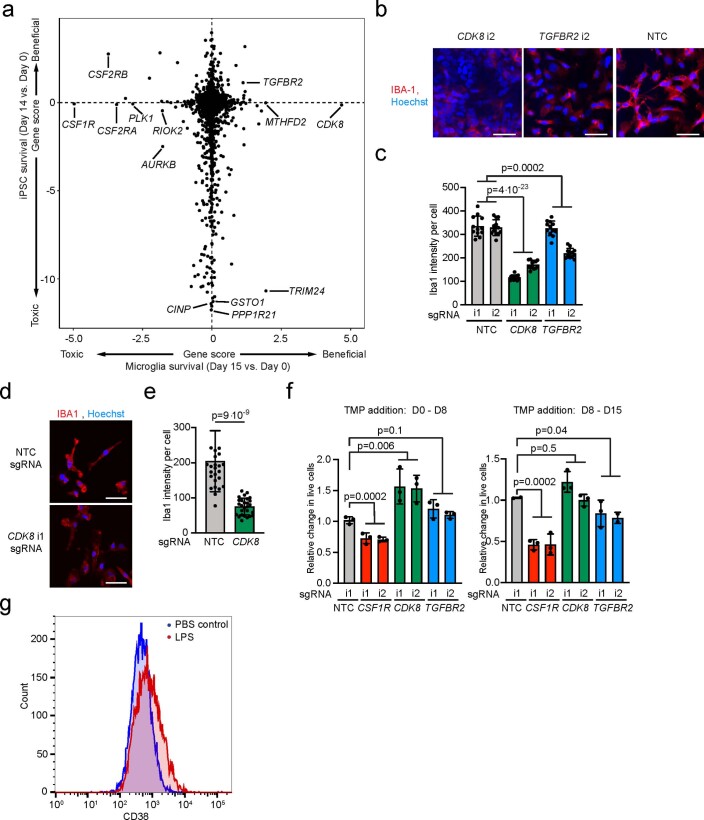
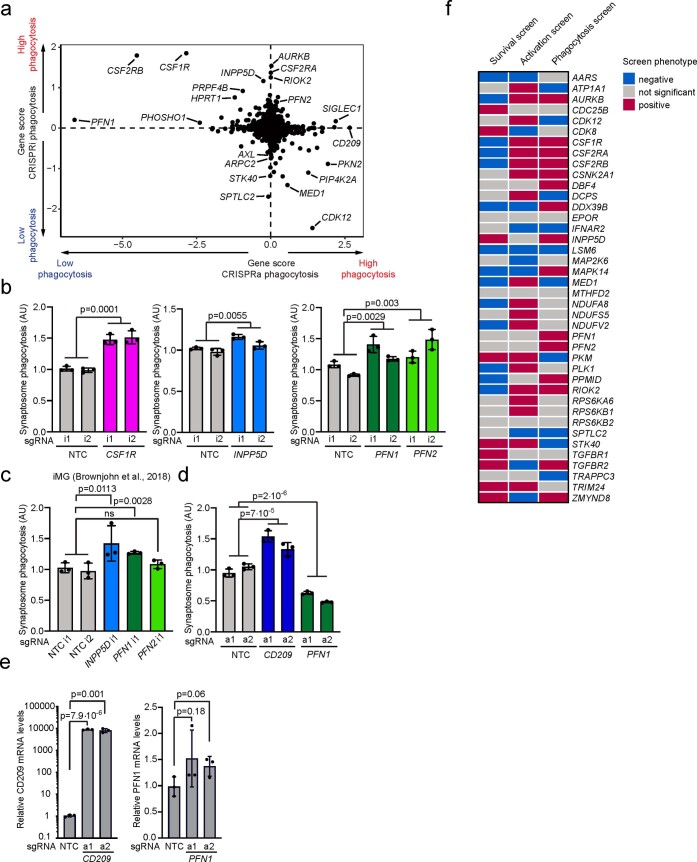
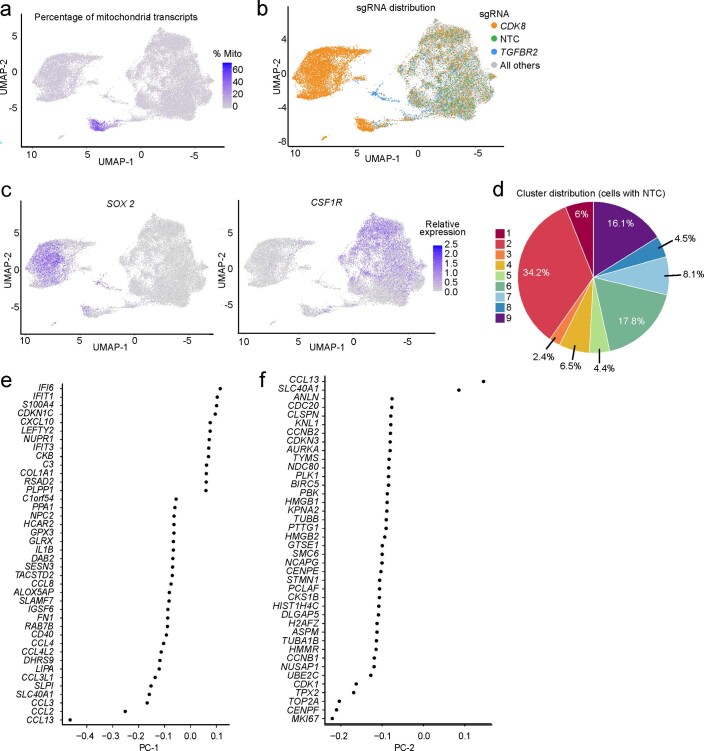
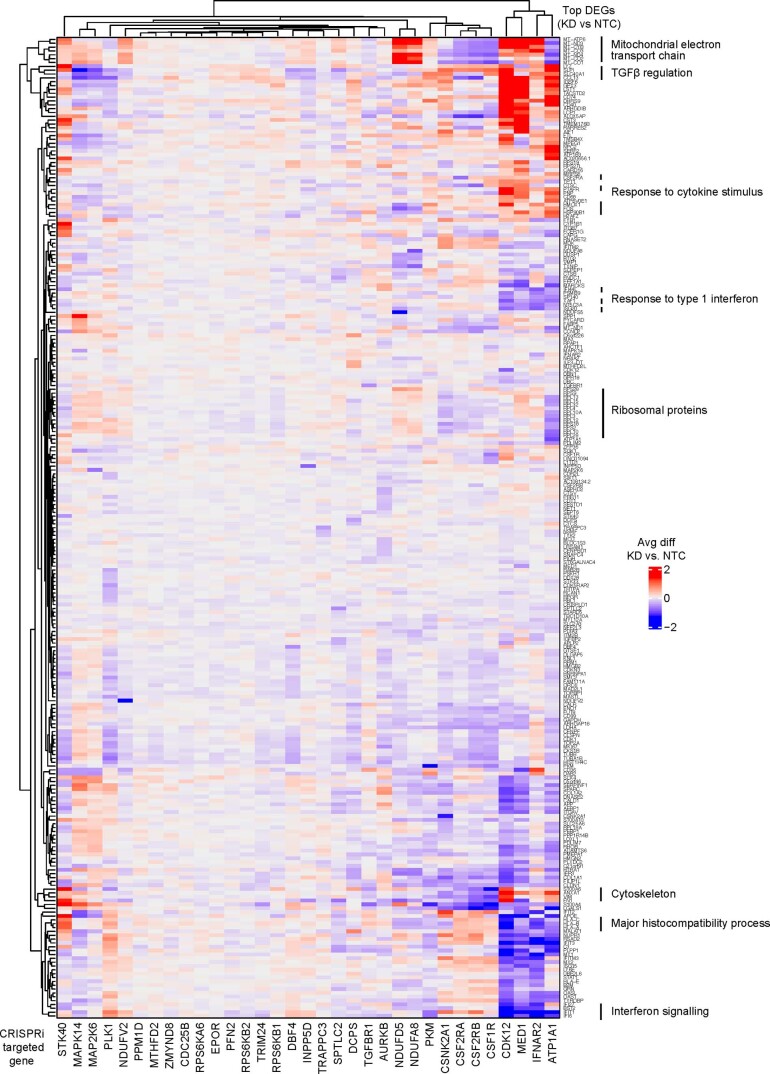
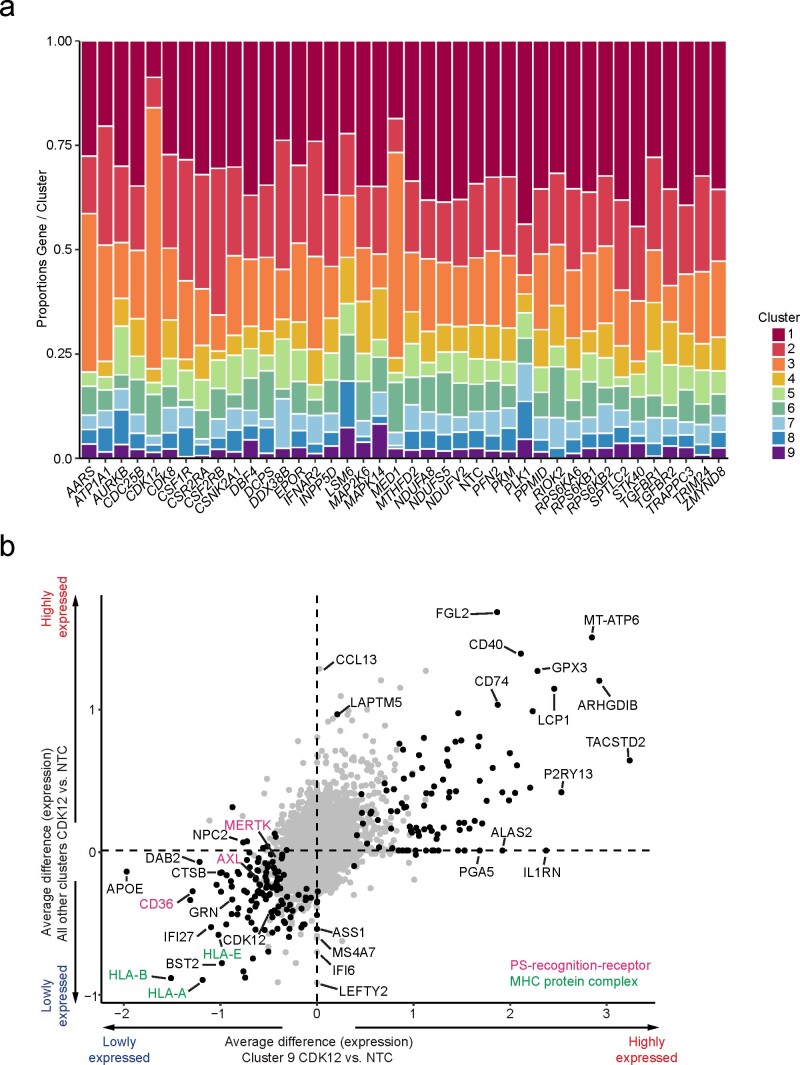
Microglia are emerging as key drivers of neurological diseases. However, we lack a systematic understanding of the underlying mechanisms. Here, we present a screening platform to systematically elucidate functional consequences of genetic perturbations in human induced pluripotent stem cell-derived microglia. We developed an efficient 8-day protocol for the generation of microglia-like cells based on the inducible expression of six transcription factors. We established inducible CRISPR interference and activation in this system and conducted three screens targeting the 'druggable genome'. These screens uncovered genes controlling microglia survival, activation and phagocytosis, including neurodegeneration-associated genes. A screen with single-cell RNA sequencing as the readout revealed that these microglia adopt a spectrum of states mirroring those observed in human brains and identified regulators of these states. A disease-associated state characterized by osteopontin (SPP1) expression was selectively depleted by colony-stimulating factor-1 (CSF1R) inhibition. Thus, our platform can systematically uncover regulators of microglial states, enabling their functional characterization and therapeutic targeting.


Conflict of interest statement

M.A.N. consults for Neuron23. M.A.N. and F.F. participated in this work in part due to a competitively awarded consulting contract between Data Tecnica International, LLC and the National Institutes of Health (USA). J.I. is a cofounder of AcuraStem, Inc. and Modulo Bio, and serves on the scientific advisory board of Spinogenix. L.G. is a founder of Aeton Therapeutics. M.K. is an inventor on US patent 11,254,933 related to CRISPRi and CRISPRa screening; serves on the scientific advisory boards of Engine Biosciences, Casma Therapeutics, Cajal Neuroscience and Alector; and is a consultant to Modulo Bio and Recursion Therapeutics. The remaining authors declare no competing interests.

Figures

Fig. 1
Fig. 1. Rapid differentiation of iPSCs into microglia-like cells (iTF-Microglia) by transcription factor induction.
a, Strategy for stable integration of six transcription factors in AAVS1 and CLYBL loci by TALEN-mediated integration: The doxycycline-inducible reverse transcriptional activator (rtTA3G) is driven by the constitutive CAG promoter. Human MAFB, CEBPα and IRF8 are driven by the tet response element (TRE3G) in the AAVS1 locus. Human PU.1, CEBPβ and IRF5 are driven by TRE3G in the CLYBL locus. All transcription factors are separated from each other via T2A ribosome skipping sequences. b, Overview of the differentiation process for generating iTF-Microglia. Top, timeline with media, cytokines and doxycycline (Dox); bottom, representative phase-contrast images of cells on the indicated days. Scale bar, 100 μm. c, Expression of six inducible transcription factors during iTF-Microglia differentiation. Transcript abundance (transcripts per million, TPM) of MAFB, CEBPα, IRF8 cassette and the PU.1, CEBPβ, IRF5 cassette at day 0, day 9 and day 15 of differentiation. Mean ± s.d., n = 3 biological replicates, P values from two-tailed Student’s t-test. d, Representative immunofluorescence micrographs of iTF-Microglia on day 8 of differentiation stained for microglia markers GPR34 and IBA1. Nuclei were labeled by Hoechst 33342. Scale bar, 100 μm. e, Expression of iPSC and microglia marker genes in iPSCs and derived iTF-Microglia on day 9 and day 15 of differentiation. The heatmap displays normalized and gene-centered TPM counts for selected genes (rows) for three biological replicates of timepoints (columns). iTF-Microglia express microglia homeostatic markers and activation markers, while losing their expression of iPSC markers. Asterisks highlight microglia-selective markers. f, Principal component analysis (PCA) on the expression of microglia marker genes of iTF-Microglia, human adult ex vivo microglia, fetal and adult microglia, human myeloid cells, other iPSC-microglia (iMG) / iPSC-microglia-like cells (iMGL),, and iPSCs (this study and ref. ). Each dot reflects an independent biological sample. Colors represent the different cell types.
Fig. 2
Fig. 2. Functional characterization of iTF-Microglia.
a, Phagocytosis of pHrodo-Red-labeled rat brain-derived synaptosomes by iTF-Microglia. Representative images at 0 h and 12 h after synaptosome addition are shown. Treatment with 5 μM actin polymerization inhibitor Cytochalasin D decreases phagocytosis. Scale bar, 100 μm. b, Phagocytosis of pHrodo-labeled rat brain-derived synaptosomes with or without Cytochalasin D treatment was quantified by flow cytometry at 0.5 h, 1.5 h and 2.5 h after synaptosome addition (mean ± s.d., n = 3 biological replicates; P values from two-tailed Student’s t-test). c, Morphological changes of iTF-Microglia after LPS treatment are visualized by fluorescence microscopy. Samples were treated for 24 h with 100 ng ml−1 LPS or buffer control and fixed samples were stained with Alexa Fluor 488-phalloidin for F-actin (green) and with Hoechst 33342 for nuclei (blue). Scale bar, 100 μm. d, Transcriptomic changes caused by 50 ng ml−1 LPS treatment in day 15 iTF-Microglia (n = 3 biological replicates). DEGs (Padj < 0.05, two-tailed Student’s t-test) are labeled in black (increase). Other colors label genes associated with specific pathways that are discussed in the main text. e, Cytokines secreted by iTF-Microglia. Analysis of cytokine array signal (integrated density of dot blots) from supernatants of cultures treated with LPS or buffer control (mean ± s.d., n = 6 biological replicates; P values from two-tailed Student’s t-test). *GM-CSF is a component of the culture medium. f, Coculture with iPSC-derived excitatory neurons promotes ramified morphology of iTF-Microglia. Representative fluorescence micrographs at low and high magnification of day 9 iTF-Microglia after 24 h in coculture. iTF- Microglia express membrane-localized Lck-mNeonGreen (green). Neurons are stained for the pre-synaptic marker synaptophysin (magenta). Nuclei are stained with Hoechst 33342 (blue). Scale bars, 100 µm. AU, arbitrary units; NS, not significant.
Fig. 3
Fig. 3. Gene knockdown and overexpression by CRISPRi and CRISPRa in iTF-Microglia.
a, Strategies for constitutive and inducible CRISPRi/CRISPRa in iTF-Microglia. Top, for constitutive CRISPRi, a dCas9-BFP-KRAB construct (catalytically dead Cas9 (dCas9) fused to BFP and the KRAB transcriptional repressor domain) is expressed from the constitutive CAG promotor integrated into the CLYBL safe-harbor locus. Middle, for inducible CRISPRi, dCas9-BFP-KRAB is tagged with ecDHFR degrons. Bottom, for inducible CRISPRa, CAG promotor-driven ecDHFR-dCas9-VPH was stably integrated into the CLYBL locus. VPH, activator domains containing 4× repeats of VP48, P65 and HSF1. Addition of TMP stabilizes the inducible CRISPRi/a machineries. b,c, Functional validation of constitutive (b) or inducible (c) CRISPRi activity via flow cytometry of TFRC surface protein level stained iTF-Microglia expressing a TFRC-targeting sgRNA or an NTC sgRNA at different days of differentiation (mean ± s.d., n = 3 biological replicates; P values from two-tailed Student’s t-test). c, TMP was added to induce CRISPRi activity where indicated. d, Functional validation of inducible CRISPRi activity via TFRC immunofluorescence (IF) microscopy on day 8. Top row, NTC sgRNA. Bottom row, sgRNA targeting TFRC. TFRC, red; F-actin, green; nuclei, blue. Scale bar, 100 μm. e, Functional validation of inducible CRISPRa activity via flow cytometry of CXCR4 surface protein level staining in iTF-Microglia expressing CXCR4 sgRNA or NTC sgRNA (mean ± s.d., n = 3 biological replicates; P values from two-tailed Student’s t-test). TMP was added to induce CRISPRa activity where indicated.
Fig. 4
Fig. 4. Identification of modifiers of survival and inflammation by CRISPRi screens.
a, Strategy. b, Comparison of Gene Scores from CRISPRi survival screens in iTF-Microglia (this study) versus iPSC-derived neurons. Each dot represents a gene; genes are color-coded by pathways. c, Validation of the phenotype of CSF1R knockdown. iTF-Microglia transduced with CSF1R-targeting or NTC sgRNAs were imaged on different days after differentiation, and live cells were quantified based on staining with Hoechst 33342. Data are shown as mean ± s.d., n = 3 wells per group; 7 fields were imaged for each well; P values from two-tailed Student’s t-test. d, Strategy for a CRISPRi screen to identify modifiers of the expression of CD38, a marker of reactive microglia. iPSCs expressing the inducible CRISPRi construct were transduced with the druggable genome sgRNA library. On day 0, doxycyline and cytokines were added to induce microglial differentiation, and TMP was added to induce CRISPRi activity. On day 8, iTF-Microglia were stained for cell-surface levels of CD38 and sorted by FACS into populations with low (bottom 30%) and high (top 30%) CD38 levels. Frequencies of iTF-Microglia expressing a given sgRNA were determined in each population by next-generation sequencing (NGS). e, Volcano plot indicating knockdown phenotype and statistical significance (two-sided Mann–Whitney U-test) for genes targeted in the CD38 level screen. Dashed line indicates the cut-off for hit genes (false discovery rate (FDR) = 0.1). Hit genes are shown in blue (knockdown decreases CD38 level) or red (knockdown increases CD38 level), nonhit genes are shown in orange and ‘quasi-genes’ generated from random samples of NTC sgRNAs are shown in gray. Hits of interest are labeled. f, Validation of the phenotype of MED1 and CDK12 knockdown. CD38 cell-surface levels measured by flow cytometry of day 8 iTF-Microglia targeting MED1, CDK12 compared with NTC sgRNA. Means ± s.d., n = 3 biological replicates; P values from two-tailed Student’s t-test. i1, i2 refer to independent CRISPRi sgRNAs targeting the indicated genes.
Fig. 5
Fig. 5. Identification of modifiers of phagocytosis by CRISPRi and CRISPRa screens.
a, Strategy for modifier screen based on the uptake of pHrodo-labeled rat synaptosomes. b, Volcano plots summarizing knockdown and overexpression phenotypes and statistical significance (two-sided Mann–Whitney U-test) for genes targeted in the pooled phagocytosis screens. Left, CRISPRi screen; right, CRISPRa screen. Dashed lines, Gene Score cut-off for hit genes (FDR = 0.1). Hit genes are shown in blue (knockdown decreases phagocytosis) or red (knockdown increases phagocytosis), nonhit genes are shown in orange and ‘quasi-genes’ generated from random samples of NTC sgRNAs are shown in gray. Hits of interest are labeled. c, Competitive phagocytosis assay to test substrate specificity of CD209 overexpression. Flow cytometry measurement of phagocytosis of pHrodo-Red-labeled synaptosomes (left, either synaptosomes alone or together with beads) and green, fluorescent beads (right, either beads alone or together with synaptosomes) by iTF-Microglia expressing either NTC sgRNAs or sgRNAs targeting CD209. Values represent mean ± s.d. of n = 3 biological replicates. Data were analyzed using two-tailed Student’s t-test. d, Representative fluorescent images demonstrating higher F-actin staining in CRISPRa iTF-Microglia at day 8 with PFN1 sgRNAs compared with NTC sgRNAs (left). Scale bar, 50 µm. Right, integrated F-actin intensity per cell of CRISPRa iTF-Microglia at day 8 with PFN1 sgRNAs or NTC sgRNAs. Mean ± s.d., n = 5 fields of view from 3 different wells per sgRNA. P values from two-tailed Student’s t-test. e, Transcriptomic changes caused by PFN1 overexpression in day 8 iTF-Microglia (n = 3 biological replicates). DEGs (Padj < 0.05, two-tailed Student’s t-test) are labeled in black. Other colors label genes associated with specific pathways that are discussed in the main text. *AD risk genes. a1, a2 refer to independent CRISPRa sgRNAs targeting the indicated genes.
Fig. 6
Fig. 6. scRNA-seq reveals distinct and disease-related microglia subclusters.
a, Strategy for the CROP-seq screen. IPSCs expressing inducible CRISPRi machinery were transduced with a pooled library of 81 sgRNAs and CROP-seq vector pMK1334. iPSCs are differentiated to iTF-Microglia and subjected to scRNA-seq to obtain single-cell transcriptomes and to identify expressed sgRNAs. b, UMAP of the 28,905 cells in the post-quality control CROP-seq dataset. Cells are colored by sgRNA (CDK8, red; TGFBR2, orange) and cells with a high percentage of mitochondrial transcripts (blue). Microglia are labeled in green. Each dot represents a cell. c, UMAP depicting the 9 different clusters within the 19,834 microglia. Each dot represents a cell. The cells are color-coded based on their cluster membership. d,e, Ridge plots depicting iTF-Microglia clusters along PC1 (d) and PC2 (e). PC1 spans inflammation status (interferon activated–homeostatic–chemokine activated) while PC2 spans proliferation status. f, Heatmap of iTF-Microglia clusters 1–9 and the relative expression of the top three DEGs (based on log2 fold differences in expression) of each cluster. g, UMAP of distinct marker expression of CCL13 (left) and SPP1 (right). CCL13 is a marker for cluster 9 and SPP1 is a marker for cluster 3. Cells are colored by the expression levels of the indicated gene. h, Phagocytic activity of iTF-Microglia in different states. Flow cytometry measurement of phagocytosis of pHrodo-Red-labeled synaptosomes (left, phagocytosis in CCL13high and CCL13low iTF-Microglia; right, phagocytosis in SPP1high and SPP1low iTF-Microglia). Values represent mean ± s.d. of n = 3 biological replicates; P values from two-tailed Student’s t-test. i, Integration of single-cell transcriptomes of iTF-Microglia and microglia from post-mortem human brains. In the integrated UMAP, iTF-Microglia (left) with high SPP1 expression and human brain-derived microglia with high SPP1 expression (right) form a cluster (dashed outline). j, In brains from patients with AD, a higher fraction of microglia is in the SPP1high cluster compared with control brains (data from Olah et al.; P value from two-sided Fisher’s exact test).
Fig. 7
Fig. 7. CROP-seq reveals changes in cluster occupancy induced by gene knockdown.
a, UMAP depicts cells with sgRNAs targeting MAPK14 (blue), CSF1R (red) and CDK12 (green), which are enriched in clusters 3, 6 and 9, respectively. Insert shows cluster 3. b, Changes in cluster distribution after CRISPRi knockdown of targeted genes in iTF-Microglia. Heatmap with hierarchical clustering of 37 target genes and NTC and their distribution in clusters 1–9. c, Proportion of cells in cluster 9 (CCL13+) expressing either sgRNAs targeting CDK12 or NTC. d, Validation of increased CCL13 in iTF-Microglia expressing sgRNAs targeting CDK12 compared with NTC. CCL13 levels were measured via flow cytometry ±5 h of GolgiPlug treatment. e, Decreased synaptosome phagocytosis of iTF-Microglia expressing sgRNAs targeting CDK12 compared with NTC. Phagocytosis is further reduced in the CCL13-high population of cells expressing sgRNAs targeting CDK12. Phagocytosis was measured via flow cytometry with additional staining for CCL13. f, Proportion of cells in cluster 3 (SPP1+) expressing either sgRNAs targeting MAPK14 or CSF1R, or NTC. g,h, Functional validation of altered percentage of SPP1+ cells in iTF-Microglia expressing sgRNAs targeting MAPK14 (g) or CSF1R (h) compared with NTC. SPP1 was measured via flow cytometry after treating cells for 5 h with GolgiPlug. i, Survival of iTF-Microglia after 24-h treatment with various concentrations of MAPK14 inhibitor Skepinone-L quantified by CellTiter-Glo assay. Mean ± s.d. of n = 12 biological replicates, analyzed by one-way analysis of variance (ANOVA). j, Percentage of SPP1-positive cells after 100 nM Skepinone-L treatment for 24 h or 36 h. SPP1 was measured via flow cytometry after an additional 5 h of GolgiPlug treatment. k, Survival of iTF-Microglia after 24-h treatment with various concentrations of CSF1R inhibitor PLX3397 quantified by CellTiter-Glo assay. Mean ± s.d. of n = 6 biological replicates. l, Percentage of SPP1+ cells after 24 h of PLX3397 treatment measured via flow cytometry after an additional 5 h of GolgiPlug treatment. In panels d, e, g, h and j, values represent mean ± s.d. of n = 3 biological replicates; in all panels except i, P values are from the two-tailed Student’s t-test. i1, i2 refer to independent CRISPRi sgRNAs targeting the indicated genes.
Extended Data Fig. 1
Extended Data Fig. 1. Impact of Doxycycline removal on iTF-Microglia survival and sgRNA recovery in iPSC-derived microglia generated with different protocols.
a, Comparison of iTF-Microglia viability after Day 8 with different protocols. Top: timeline with different doxycycline supplementation paradigms, bottom: representative phase-contrast images at Day 15 with the indicated doxyccycline supplementation. Scale bar: 50 μm. b, Survival of iTF-Microglia at Day 15 after different doxycycline treatments indicated in a. Viable cells were quantified using the CellTiter-Glo assay. Values represent mean + /− sd of n = 12 biological replicates; p values from two-tailed Student’s t-test. c, Principal component analysis (PCA) on the expression of microglia marker genes of iTF-Microglia, human adult ex-vivo microglia, fetal and adult microglia, human myeloid cells, other iPSC-microglia,,. No iPSC samples were included. Each dot reflects an independent biological sample. Colors represent the different cell types. d, sgRNA recovery after transduction with a pooled sgRNA library in iPSCs and differentiation with two different iPSC-Microglia protocols. Strategy for the infection of iPSCs with an sgRNA library with 13,025 elements and timepoint of sgRNA recovery in iPSC-Microglia with the actual recovered counts of sgRNAs after next-generation-sequencing (NGS) from the protocol from Brownjohn et al. (Top) and iTF-Microglia (Bottom).
Extended Data Fig. 2
Extended Data Fig. 2. Phagocytosis capacity of iTF-Microglia and morphological changes after LPS treatment.
a, b, Phagocytosis of yellow-green (YG) beads (a) or pHRodo-Red labeled synaptosomes (b) measured by flow cytometry. Histograms of YG-beads-FITC (a) and Synaptosome-PE (b) after 1.5 h of substrate exposure + /− 5 μM Cytochalasin D (CytoD) treatment. Controls are iTG-Microglia without substrate exposure. c, Phagocytosis of yellow-green (YG) beads at different timepoints. Flow cytometric quantification of the percentage of YG bead-positive cells at after 0.5 h, 1.5 h and 2.5 h of incubation with beads. Addition of 5 μM CytoD decreases the percentage of YG bead-positive cells. Means + /− sd, n = three individual biological replicates; p values from two-tailed Student’s t-test. d, Morphological changes of iTF-Microglia after LPS treatment. Swarm plots showing the automated quantification of microglia F-actin staining in area, shape factor and perimeter with explanation of the three parameters. Means + /− sd, n = 16 wells from 3 individual differentiations; p values from two-tailed Mann-Whitney test. e, Comparison of differentially expressed genes in response to LPS treatment in iTF-Microglia versus iPSC-derived microglia (iMG) differentiated following a previously published protocol by Brownjohn et al..
Extended Data Fig. 3
Extended Data Fig. 3. Karyotyping of the monoclonal iTF-iPSC lines.
A normal karyotype was confirmed for monoclonal lines a, iTF-iPSCs, b, constitutive CRISPRi iTF-iPSC, c, inducible CRISPRi iTF-iPSC, d, inducible CRISPRa iTF-iPSC lines.
Extended Data Fig. 4
Extended Data Fig. 4. Functional validation of CRISPRi/a activity in iPSCs and iTF-Microglia.
a, b, Functional validation of constitutive (a) or inducible (b) CRISPRi activity via flow cytometry of TFRC surface protein level stained iPSCs expressing a TFRC-targeting sgRNA or a non-targeting control (NTC) sgRNA (mean + /− sd, n = 3 biological replicates; p values from two-tailed Student’s t-test). TMP was added to induce CRISPRi activity where indicated. c-d, Knockdown of TFRC in iPSCs with (a) the constitutive and (b) the inducible CRISPRi system. qPCR quantification of the relative fold change of TFRC mRNA levels in CRISPRi-iPSCs expressing a TFRC sgRNA as compared to a non-targeting control sgRNA in the presence or absence of trimethoprim (TMP). (mean + /− sd, n = 3 biological replicates; p values from two-tailed Student’s t-test). TFRC levels were normalized to the housekeeping gene GAPDH. e-j Knockdown of three different genes in iTF-Microglia with (e,g,i) constitutive CRISPRi and (f,h,j) inducible CRISPRi. qPCR quantification of the relative fold change of TFRC mRNA levels (e,f), INPP5D mRNA levels (g,h) or PICALM mRNA levels (I,j) in CRISPRi-iTF-Microglia expressing a TFRC sgRNA (e,f), INPP5D sgRNA (g,h) or PICALM sgRNA (I,j) compared to a non- targeting control sgRNA at different days of differentiation in the presence of TMP (mean + /− sd, n = 3 biological replicates, P values from two-sided Student’s t test). k, Functional validation of inducible CRISPRa activity via flow cytometry of CXCR4 surface protein level stained iPSCs expressing a CXCR4-targeting sgRNA or a non-targeting control (NTC) sgRNA (mean + /− sd, n = 3 biological replicates; p values from two-tailed Student’s t-test). TMP was added to induce CRISPRi activity where indicated. l-m, qPCR quantification of the relative fold change of CXCR4 mRNA levels in inducible CRISPRa-iPSCs expressing a CXCR4 sgRNA as compared to a non-targeting control sgRNA in the presence or absence of trimethoprim (TMP), which stabilizes the DHFR degron. (mean + /− sd, n = 3 biological replicates; p values from two-tailed Student’s t-test). CXCR4 levels were normalized to the housekeeping gene GAPDH.
Extended Data Fig. 5
Extended Data Fig. 5. Knockdown of CDK8 and TGFBR2 induces proliferation and decreases microglia markers in iPSC-derived microglia generated with different protocols.
a, Comparison of Gene Scores from CRISPRi survival/proliferation screens in iTF-Microglia (this study) vs. iPSCs. Each dot represents a gene. b-c, IBA1 staining in Day 8 CRISPRi iTF-Microglia containing sgRNAs targeting CDK8 or TGFBR2 compared to non-targeting control (NTC) sgRNAs. b, Representative images. Scale bar = 50 μm. c, Quantification. Mean + /-sd, n = 6 fields of view from 2 different wells per sgRNA; p values from two-tailed Student’s t-test. d-e, IBA1 staining in Day 8 iMGs generated by the protocol from Brownjohn et al., 2018 expressing sgRNAs targeting CDK8 compared to non-targeting control (NTC) sgRNAs. d, Representative images. Scale bar = 50 μm. e, Quantification. Mean + /-sd, n = 9 fields of view from 3 different wells per sgRNA; p values from two-tailed Student’s t-test. f, Relative change in live cells of iTF-Microglia at Day 8 (left) and Day 15 (right) containing sgRNAs targeting CDK8, CSF1R or TGFBR2 compared to non-targeting control sgRNAs. The inducible CRISPRi system was stabilized with TMP from Day 0 – Day 8 (left) or Day 8 – Day 15 (right). (mean + /-sd, n = 3 biological replicates; p values from two-tailed Student’s t-test. g, CD38 cell surface levels measured by flow cytometry in iTF-Microglia 24 h treatement with 100 ng/mL LPS or PBS control.
Extended Data Fig. 6
Extended Data Fig. 6. Validation of phagocytosis hits and overview of genes selected for the CROP-seq screen based on primary screens.
a, Comparing Gene Scores for hits from phagocytosis CRISPRi and CRISPRa screens. Each dot represents a gene. b-d, Validation of (b,c) CRISPRi hits and (d) CRISPRa hits in (b,d) iTF-Microglia or (c) iPSC-derived microglia differentiated using an alternative protocol by Brownjohn et al. Phagocytosis of pHrodo-labelled synaptosomes by cells expressing either non-targeting control (NTC) sgRNAs or sgRNAs targeting CSF1R, INPP5D, PFN1 and PFN2 was quantified by flow cytometry. Values represent mean + /− sd of n = 3 biological replicates; p values from two-tailed Student’s t-test. e, Overexpression of CD209 (left) and PFN1 (right) with the inducible CRISPRa system in iTF-Microglia. QPCR quantification of the relative fold change of CD209 and PFN1 mRNA levels in iTF-Microglia expressing CD209 and PFN1 sgRNA as compared to a non-targeting control sgRNA in the presence of TMP (mean + /− sd, n = 3 biological replicates; p values from two-tailed Student’s t-test). CD209 and PFN1 levels were normalized to the housekeeping gene GAPDH. f, Binary heatmap of genes selected for the CROP-seq screen and their knockdown phenotype in the CRISPRi survival, phagocytosis and inflammation screens. Red: KD increases phenotype (positive hit). Blue: KD decreases phenotype (negative hit). Grey: not a significant hit, p > 0.1.
Extended Data Fig. 7
Extended Data Fig. 7. Characterization of microglia cluster signatures.
a-c, UMAP projection representing single-cell transcriptomes, with cells colored based on (a) the percentage of mitochondrial transcripts, (b) the expressed sgRNAs, with sgRNAs targeting CDK8 in orange, sgRNAs targeting TGFBR2 in blue, non-targeting control sgRNAs (NTC) in green, and all other sgRNAs in grey, or (c) expression levels of SOX2 (Left) or CSF1R (Right). d, Distribution of iTF-Microglia expressing non-targeting (NTC) sgRNAs across the 9 clusters described in Fig. 6. e, f,the top 40 genes with the highest embedding values for (e) the first principal component (PC-1) and (f) the second principal component (PC-2), displayed in ranking order.
Extended Data Fig. 8
Extended Data Fig. 8. CROP-seq reveals transcriptomic changes in iTF-Microglia induced by gene knockdown.
Changes in gene expression in response to CRISPRi knockdown of genes of interest in iTF-Microglia. Each column represents one CRISPRi-targeted gene. For each CRISPRi-targeted gene, cells with the strongest knockdown were selected and the top 20 differentially expressed genes in comparison to non-targeting control (NTC) sgRNA containing cells were selected. The merged set of these genes is represented by the rows. Rows and columns were clustered hierarchically based on Pearson correlation. Functionally related clusters of differentially expressed genes are labeled.
Extended Data Fig. 9
Extended Data Fig. 9. Transcriptomic changes in iTF-Microglia induced by CDK12 knockdown in cluster 9 and in all other clusters.
a, Changes in cluster distribution after CRISPRi knockdown of targeted genes in iTF-Microglia. Distribution of cells according to the 37 targeted genes and non-targeting control (NTC) in clusters 1–9. b, Average differences of gene expression induced by CDK12 knockdown in cluster 9 compared to those in all other clusters. Genes encoding phosphatidylserine (PS) recognition receptors are labeled in magenta and Genes encoding MHC complex components are labeled in green.

References

    1. Butovsky O, Weiner HL. Microglial signatures and their role in health and disease. Nat. Rev. Neurosci. 2018;19:622–635. doi: 10.1038/s41583-018-0057-5. - DOI - PMC - PubMed
    1. Efthymiou AG, Goate AM. Late onset Alzheimer’s disease genetics implicates microglial pathways in disease risk. Mol. Neurodegener. 2017;12:43. doi: 10.1186/s13024-017-0184-x. - DOI - PMC - PubMed
    1. Olah M, et al. Single cell RNA sequencing of human microglia uncovers a subset associated with Alzheimer’s disease. Nat. Commun. 2020;11:6129. doi: 10.1038/s41467-020-19737-2. - DOI - PMC - PubMed
    1. Mathys H, et al. Temporal tracking of microglia activation in neurodegeneration at single-cell resolution. Cell Rep. 2017;21:366–380. doi: 10.1016/j.celrep.2017.09.039. - DOI - PMC - PubMed
    1. Keren-Shaul H, et al. A unique microglia type associated with restricting development of Alzheimer’s disease. Cell. 2017;169:1276–1290.e17. doi: 10.1016/j.cell.2017.05.018. - DOI - PubMed

Publication types

MeSH terms