. 2022 Aug 11;12(1):13657.
doi: 10.1038/s41598-022-17851-3.

3D Paper-based milk adulteration detection device

Affiliations

3D Paper-based milk adulteration detection device

Subhashis Patari et al. Sci Rep. .

Abstract

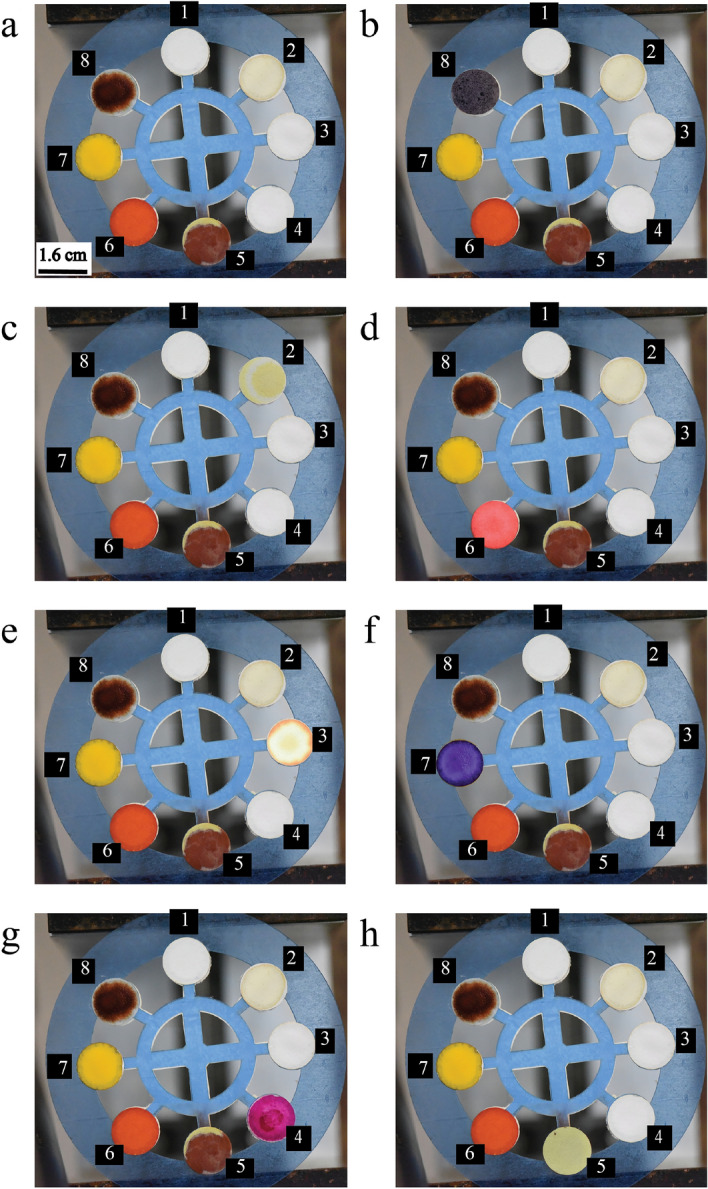
Milk adulteration is a common problem in developing countries, and it can lead to fatal diseases in humans. Despite several studies to identify different adulterants in milk samples, the effects of multiple adulterants remain unexplored. In this work, a three-dimensional (3D) paper-based microfluidic device is designed and fabricated to simultaneously detect multiple chemical adulterants in milk. This device comprises a top cover, a bottom cover, and a middle layer composed of transportation and a detection zone. By making cuts on the middle layer's support, the device's flow path is characterised by optimum and uniform velocity. For the first time, seven adulterants (urea, detergents, soap, starch, hydrogen peroxide, sodium-hydrogen-carbonate, and salt) are detected in the milk sample simultaneously with specificity evaluation and detailed color interference analysis. Only 1-2 mL of sample volume is required to detect 7 adulterants at one time. We have used only 10 [Formula: see text]L of the reagent's volume for the colorimetric reaction and found the results within a few seconds. Observation reveals that the limit of detection (LOD) of the adulterants lies in the range between [Formula: see text] (vol./vol.) to [Formula: see text] (vol./vol.) using the colorimetric detection technique. The unknown quantity of the added adulterants is measured using the calibration curves obtained from the experiments results. The repeatability and reproducibility of the process, sensitivity, and the linear range of detection of the calibration curves and the statistical study of the color intensity data are thoroughly analysed herein. In any resource-limited setting, this simple, portable, and user-friendly 3D microfluidic device is expected to be used for testing liquid foods before consumption.


Conflict of interest statement

The authors declare no competing interests.

Figures

Figure 1
Figure 1
The change in color after the colorimetric reaction for different concentration of adulterants has been shown for all the adulterants.
Figure 2
Figure 2
Color intensity curves are shown for eight different adulterants with varying concentration from 0.05% to 1% (v/v) added in milk for (a) urea, (b) starch, (c) salt, (d) detergent, (e) hydrogen peroxide, (f) soap, and (g) sodium-hydrogen-carbonate. From the figure it is clear that with increasing concentration the color intensity is also increasing.
Figure 3
Figure 3
The color intensity values of the detection zones are shown here for 1 min and 30 min.
Figure 4
Figure 4
The schematic representation of (a) the compact device. Sample is added to the device through the hole in the top cover, for testing. (b) Device’s detailed view. Three layers have been shown here as the top cover (L1), 3D paper-based microfluidic device, and the bottom cover (L2). (c) The double layers 3D paper-based microfluidic device is shown here. This is a sandwich structure where solid support is sandwiched between two layers of filter paper. L3 represents the transportation zone, L4 represents the solid plastic layer, and L5 represents the detection zone. (d) Design on the backside of the bottom cover. Adulterants name and a color band are given for qualitative and quantitative identification. (e) Image of simultaneous detection of the seven adulterants using the 3D paper-based microfluidic device is shown (only the middle layer).
Figure 5
Figure 5
Experimental results of specificity test. (a) Only the reagents are showing in the different detection zones where the number represents the detection zones for urea (2), H2O2 (3), soap (4), salt (5), NaHCO3 (6), detergent (7), starch (8) and control (1). Specificity of the reagents have been shown for (b) starch, (c) urea, (d) NaHCO3, (e) H2O2, (f) detergent, (g) soap, and (h) salt.
Figure 6
Figure 6
The difference in color intensity of the adulterant mixture and the single adulterant is shown here. The maximum interference is found at about 30% for hydrogen peroxide but for all other cases it is less than 10%.
Figure 7
Figure 7
Schematic representation of the colorimetric reactions of (a) urea, (b) Starch, (c) salt, (d) detergent, (e) H2O2, (f) Soap, and (g) NaHCO3.
Figure 8
Figure 8
The schematical representation of the supporting layer is shown here, (a) for the three cases, Type 1, Type 2, Type 3. (b) Comparison of the experiments of distance travel by the liquid in all the three different cases.
Figure 9
Figure 9
The graphical schematic of the statistical analysis is shown here. (a) The ±σ range under the Gaussian distribution curve is shown here. (b) Q–Q plot of a particular set of experiments is shown here to verify the normal distribution trend of the color intensity values.

References

    1. Handford CE, Campbell K, Elliott CT. Impacts of milk fraud on food safety and nutrition with special emphasis on developing countries. Comprehensive Rev. Food Sci. Food Saf. 2016;15:130–142. doi: 10.1111/1541-4337.12181. - DOI - PubMed
    1. Jha SN, Jaiswal P, Borah A, Gautam AK, Srivastava N. Detection and quantification of urea in milk using attenuated total reflectance-fourier transform infrared spectroscopy. Food Bioprocess Technol. 2015;8:926–933. doi: 10.1007/s11947-014-1455-y. - DOI - PubMed
    1. Trivedi U, et al. Potentiometric biosensor for urea determination in milk. Sens. Actuators B Chem. 2009;140:260–266. doi: 10.1016/j.snb.2009.04.022. - DOI
    1. Kumar V, Dash S. Evaporation-based low-cost method for the detection of adulterant in milk. ACS Omega. 2021;6:27200–27207. doi: 10.1021/acsomega.1c03887. - DOI - PMC - PubMed
    1. Lu Y, et al. A review of methods for detecting melamine in food samples. Crit. Rev. Anal. Chem. 2017;47:51–66. doi: 10.1080/10408347.2016.1176889. - DOI - PubMed

Publication types