. 2022 Sep;54(9):1438-1447.
doi: 10.1038/s41588-022-01153-5. Epub 2022 Aug 11.

A multi-tissue atlas of regulatory variants in cattle

Affiliations

A multi-tissue atlas of regulatory variants in cattle

Shuli Liu et al. Nat Genet. 2022 Sep.

Abstract

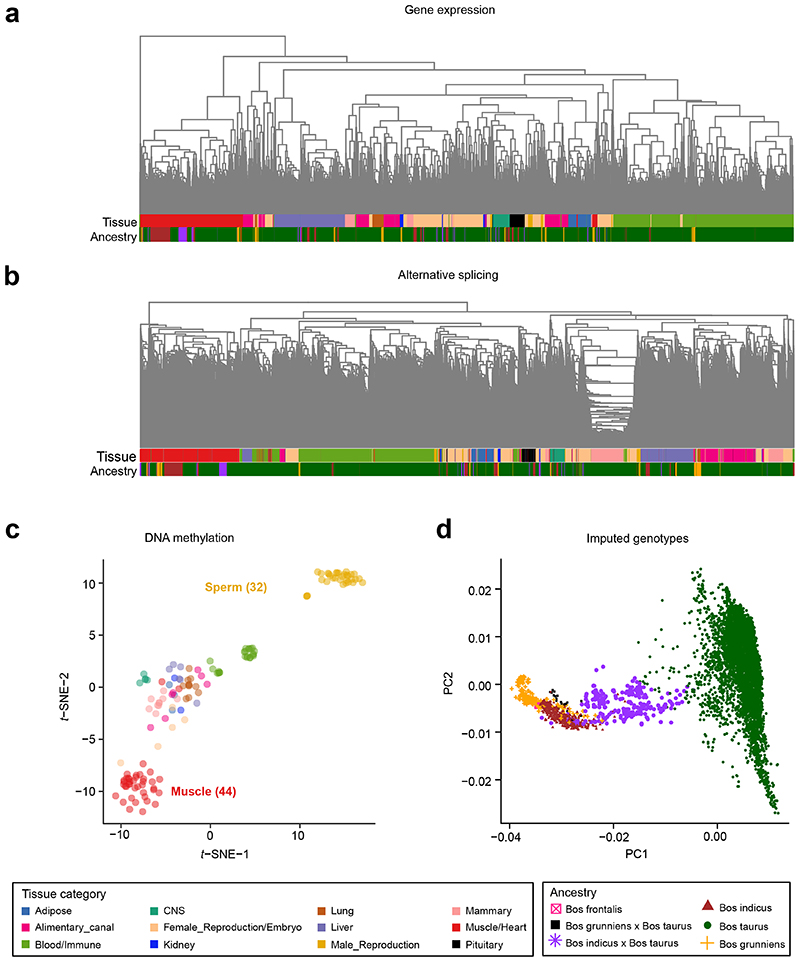
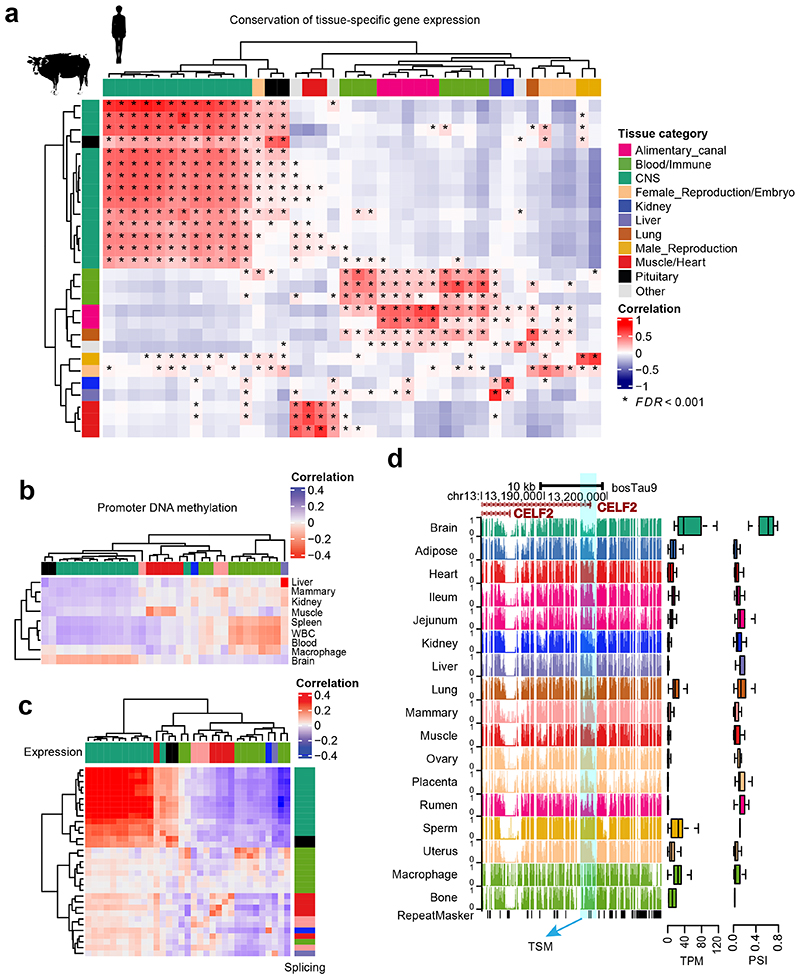
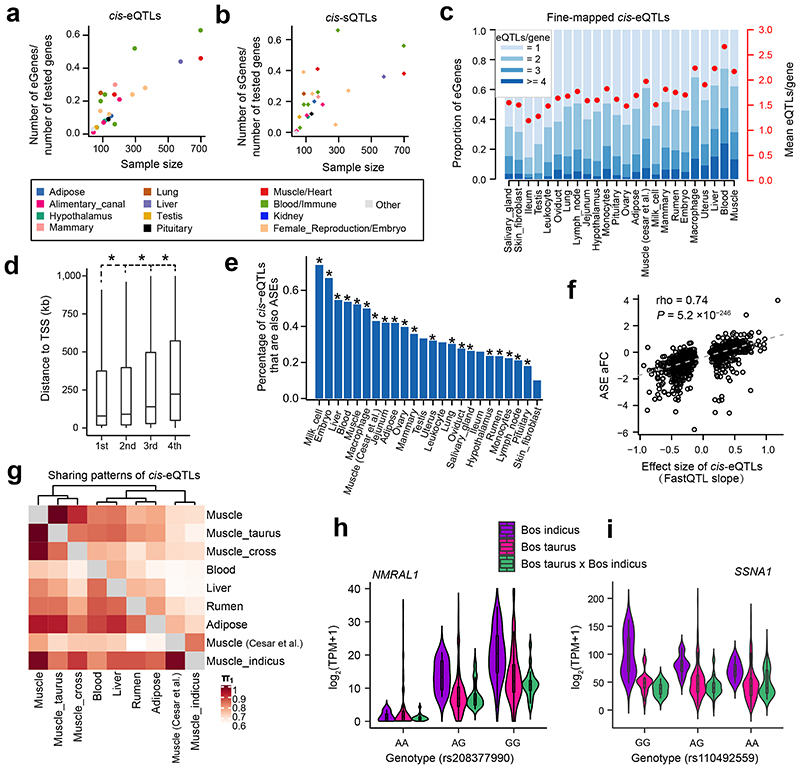
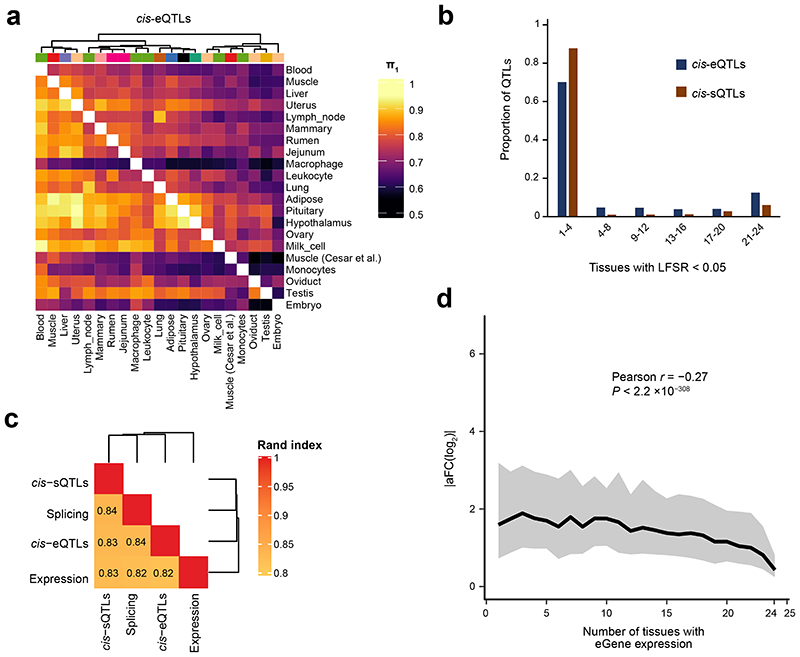
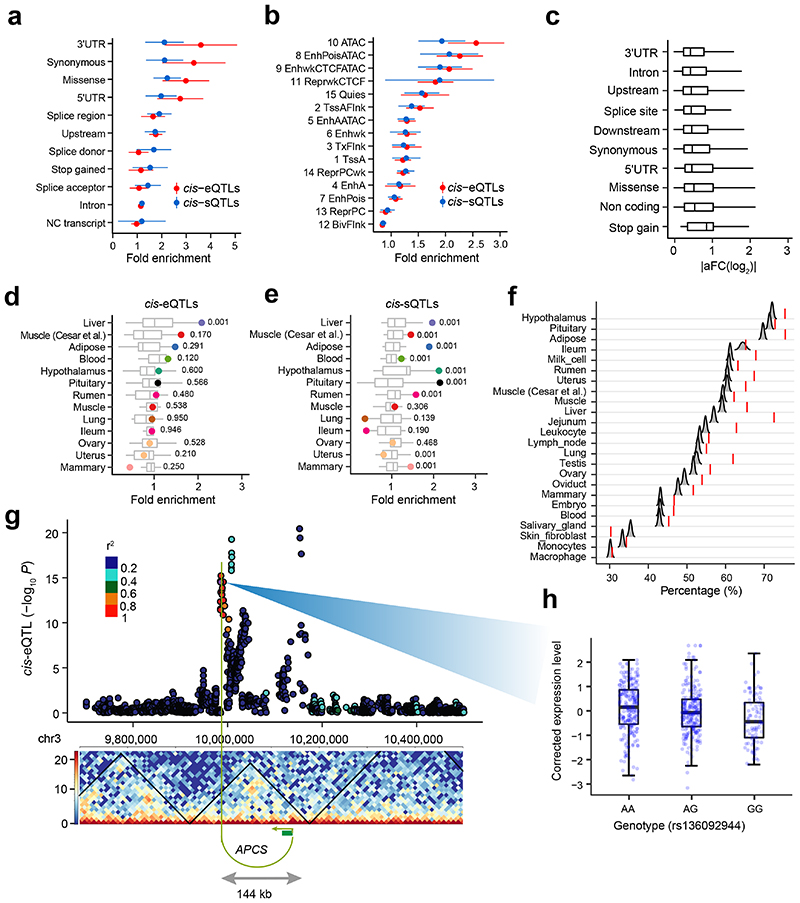
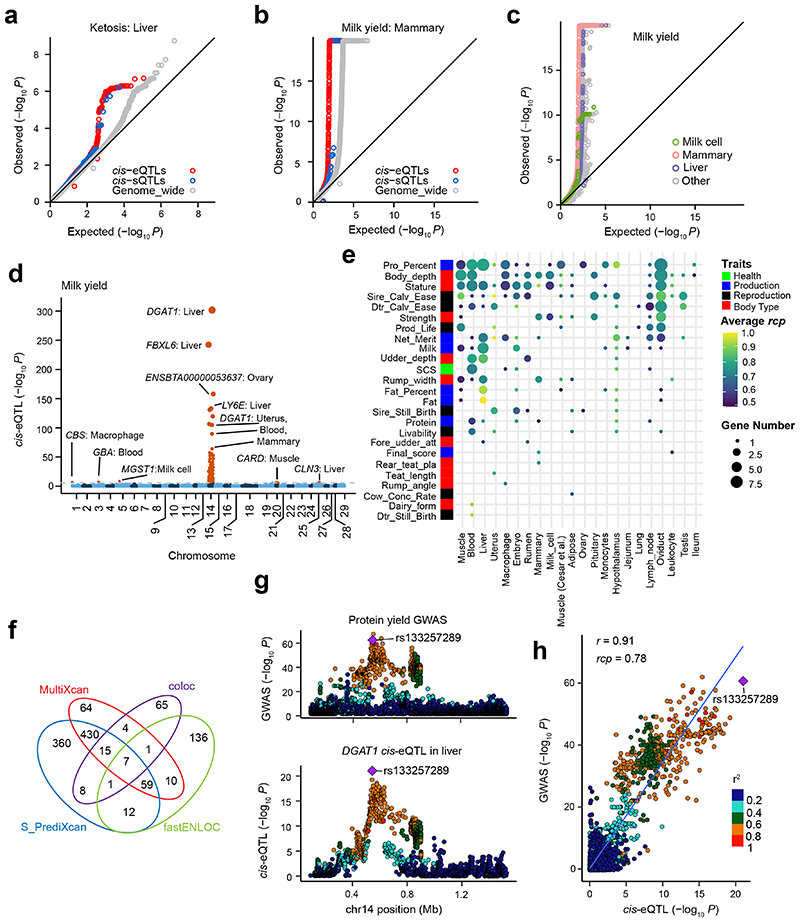
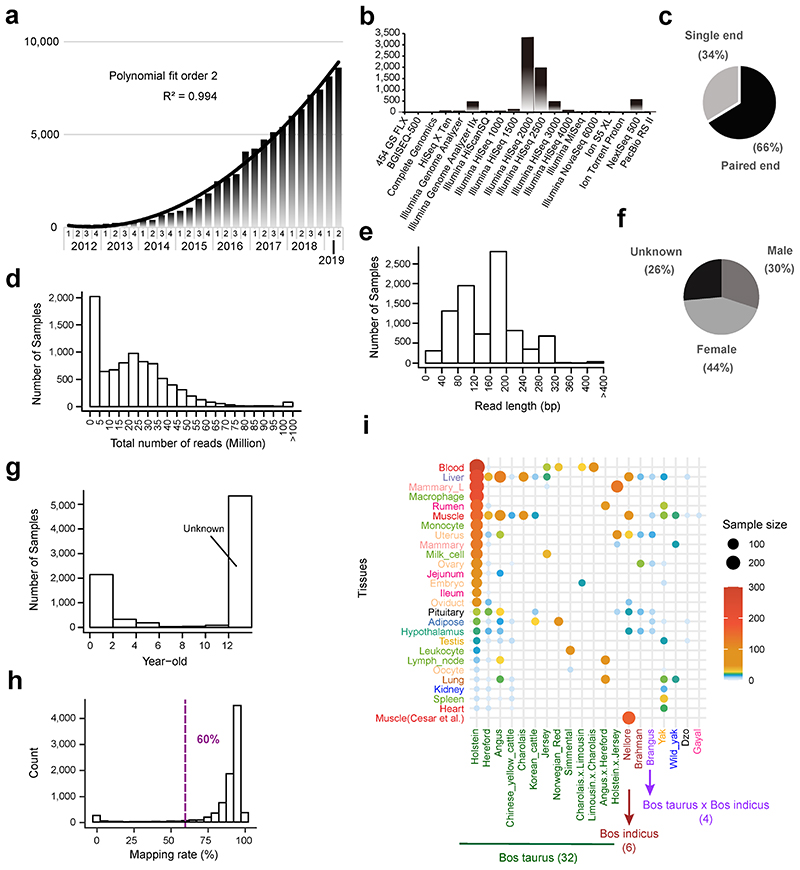
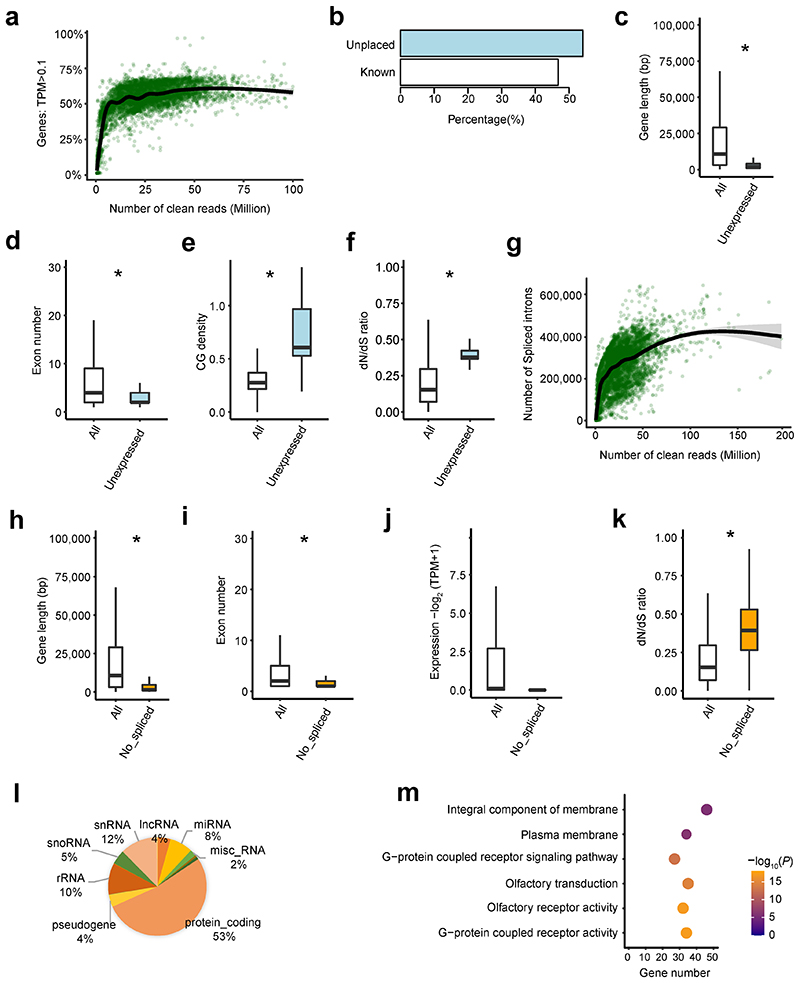
Characterization of genetic regulatory variants acting on livestock gene expression is essential for interpreting the molecular mechanisms underlying traits of economic value and for increasing the rate of genetic gain through artificial selection. Here we build a Cattle Genotype-Tissue Expression atlas (CattleGTEx) as part of the pilot phase of the Farm animal GTEx (FarmGTEx) project for the research community based on 7,180 publicly available RNA-sequencing (RNA-seq) samples. We describe the transcriptomic landscape of more than 100 tissues/cell types and report hundreds of thousands of genetic associations with gene expression and alternative splicing for 23 distinct tissues. We evaluate the tissue-sharing patterns of these genetic regulatory effects, and functionally annotate them using multiomics data. Finally, we link gene expression in different tissues to 43 economically important traits using both transcriptome-wide association and colocalization analyses to decipher the molecular regulatory mechanisms underpinning such agronomic traits in cattle.


Conflict of interest statement

Competing Interests Statement

The authors declare no competing interests.

Figures

Figure 1
Figure 1. Hierarchical clustering and principal component analysis of samples.
(a) Sample (n = 7,180) hierarchical clustering based on expression levels of all transcribed genes (Transcripts Per Million, TPM > 0.1). (b) Sample (n = 7,180) hierarchical clustering based on alternative splicing value (Percent Spliced-In, PSI) of spliced introns. (c) Sample (n = 144) clustering using t-distributed SNE coordinates based on DNA methylation levels of CpG sites (coverage ≥ 5×). (d) Principal component analysis of samples (n = 7,180) based on imputed genotypes.
Figure 2
Figure 2. Tissue-specificity of gene expression, alternative splicing and DNA methylation.
(a) Pearson correlation of tissue-specificity (measured as t-statistics) of 22,752 orthologous genes between cattle and human tissues (GTEx v8). The multiple testing is corrected for using Benjamini-Hochberg method (i.e., FDR). * denotes FDR < 0.001. (b) Pearson correlation of tissue-specificity between gene expression (x-axis) and promoter DNA methylation levels (y-axis). WBC is for white blood cells. The color code of tissues in x-axis is the same as that in (a). (c) Pearson correlation of tissue-specificity between gene expression (Transcripts per Million, TPM, x-axis) and alternative splicing (Percent Spliced-In, PSI, y-axis). The color code of tissues is the same as that in (a). (d) CELF2 shows lower DNA methylation levels in splice sites (right), higher gene expression (middle), and higher PSI value of spliced introns (left) in brain tissue (n = 15) compared to the rest of tissues. TSM is for tissue-specific methylation.
Figure 3
Figure 3. Discovery and characterization of cis-eQTLs and cis-sQTLs.
(a) Relationship between the percentages of eGenes over all tested genes and sample size (Pearson r = 0.85; the two-sided Student’s t-test: P = 1.30×10⁻⁷) across 23 distinct tissues. (b) Relationship between the percentage of sGenes over all tested genes and sample size (Pearson r = 0.63; the two-sided Student’s t-test: P = 1.06×10⁻³) across 23 distinct tissues. Tissues are colored according to their tissue categories. (c) Distribution and average number of conditionally independent eQTLs per gene across tissues. Tissues are ordered by sample size. (d) The distance to Transcription Start Site (TSS) increases from the 1st to 4th independent eQTLs. Only 7276 gene-tissue pairs with at least 4 independent eQTLs were chosen. Significant differences (denoted as *) were observed between 1st vs. 2nd (P = 2.4×10⁻³), 2nd vs. 3rd (P = 3.0 ×10⁻²⁶) and 3rd vs. 4th (P = 1.9×10⁻²⁷) independent eQTLs based on the two-sided paired sample t-test. (e) cis-eQTLs are significantly (P < 1.0×10⁻¹⁴, denoted as *, Fisher Exact test) overrepresented in the loci with allelic specific expression (ASE). The y-axis indicates the percentage of cis-eQTLs that are also ASEs over all tested SNPs in the ASE analysis. (f) Correlation of effect sizes (FastQTL slope) of cis-eQTLs and allelic fold change (aFC) of ASEs (Spearman’s rho = 0.74, the two-sided Student’s t-test: P = 5.2×10-246) in liver. (g) Pairwise cis-eQTL sharing patterns (π1 value) of muscle tissue across three breeds (Bos indicus, Bos taurus and their crosses) and other tissues. Rows are discovery tissues, and columns are validation tissues. Muscle (Cesar et al.) is for 160 skeletal muscle samples of Bos indicus downloaded from Cesar et al. 2018. (h) A cis-eQTL (rs208377990) of NMRAL1 in muscle is shared across Bos indicus (n = 51), Bos taurus (n = 505) and their crosses (n = 108). (i) A cis-eQTL (rs110492559) of SSNA1 in muscle is specific in Bos indicus (MAF = 0.25 and 0.37 in Bos taurus and Bos indicus, respectively), and has a significant (the two-sided t-test, P = 5.61×10⁻³) genotype × breed interaction. The samples are the same as in (h).
Figure 4
Figure 4. Tissue-sharing patterns of cis-QTLs.
(a) Pairwise cis-eQTL sharing patterns (π1 value) across 23 distinct tissues. (b) Tissue activity of cis-eQTLs and cis-sQTLs, where a cis-QTL is considered active in a tissue if it has a mashr local false sign rate (LFSR, equivalent to FDR) of < 5%. (c) The similarity of tissue clustering across four data types (cis-eQTL, cis-sQTL, gene expression and splicing) based on the π1 values,. The k-means clustering is performed based on 2-22 clusters with 100,000 iterations. For each pairwise data types, we report the median Pairwise Rand index across all clusters. (d) Median (line) and 95% confidence interval (shading) of cis-eQTL effect size (y-axis, measured as the absolute log2 transformed allele Fold Change, |aFC(log2)|), as a function of the number of tissues in which the eGene is expressed (x-axis; TPM > 0.1). Pearson correlation between |aFC(log2)| and number of tissues with eGene expression is -0.27 (the two-sided Student’s t-test: df = 43,721; P < 2.2×10-308).
Figure 5
Figure 5. Functional annotation of cis-QTLs.
(a) Enrichment (fold change, the two-sided permutation test with 1,000 times) of cis-eQTLs and cis-sQTLs of 23 distinct tissues in sequence ontology. The data are presented as Mean ± SD. (b) Enrichment (fold change, the two-sided permutation test with 1,000 times) of cis-eQTLs and cis-sQTLs of 23 distinct tissues in 15 chromatin states predicted from cattle rumen epithelial primary cells in Holstein animals. The data are presented as Mean ± SD. (c) Effect sizes (measured as |aFC(log2|) of cis-eQTLs of 23 distinct tissues across sequence ontology. (d) and (e) Enrichment of cis-eQTLs and cis-sQTLs of 13 tissues in tissue-specific hypomethylated regions, respectively. These 13 tissues have both DNA methylation and cis-QTL data. The numbers are P-values for enrichments of matched tissues (highlighted dots) based on the permutation test (the two sided, 1,000 times). (f) Percentages of eGene-eVariant pairs that are located within topologically associating domains (TADs) are significantly (FDR < 0.01, one-sided) higher than those of random eGene-SNP pairs with matched distances, except for ileum, macrophage and skin fibroblast. The null distributions of percentages of eGene-SNP pairs within TADs are obtained by doing 5,000 bootstraps. The TADs are obtained from the lung Hi-C data. (g) An eGene (APCS) and its eVariant (rs136092944) are located within a TAD, and linked by a significant Hi-C contact (10kb bins, position 9985,000 is linked to 10,135,000 in chr3 with Benjamini-Hochberg corrected P = 1.4×10⁻⁶. The P-value is obtained based on the binominal distribution model. The Manhattan plot shows the P-values of all tested SNPs in the cis-eQTL mapping analysis of APCS. The linkage disequilibrium (LD, r) values between eVariant (rs136092944) and surrounding SNPs are shown in colors. (h) The boxplot shows the PEER-corrected expression levels of APCS across the three genotypes of eVariant (rs136092944), i.e., AA (n = 237), AG (n = 245), and GG (n = 94), respectively.
Figure 6
Figure 6. Relationship between complex traits and cis-QTLs.
(a) cis-eQTLs (P = 0.001) and cis-sQTLs (P = 0.02) in liver show significantly higher enrichments for top SNPs associated with ketosis compared to genome-wide SNPs (shown in grey). (b) cis-eQTLs (P = 0.001) and cis-sQTLs (P = 0.03) in mammary gland show higher enrichments for top SNPs associated with milk yield compared to genome-wide SNPs (shown in grey). All the P values above are obtained by the two-sided permutation test with 1,000 times. (c) Enrichment of cis-eQTLs for genetic associations with milk yield is tissue-dependent. The cis-eQTLs in mammary gland, milk cells and liver exhibit higher enrichments for genetic associations with milk yield compared to those in other tissues. (d) Manhattan plots of transcriptome-wide association study (TWAS) for milk yield across all 23 distinct tissues. (e) The number of genes that were colocalized (regional colocalization probability, rcp > 0.5 in fastENLOC) between GWAS significant loci of complex traits and cis-eQTLs across tissues. The size of point indicates the number of genes, while the color of point indicates the average rcp of each trait-tissue pair. The abbreviations of GWAS traits are explained in Supplementary Table 10. (f) The overlaps of significant gene-trait pairs from TWAS with S-PrediXcan (Bonferroni corrected P < 0.05) and S-MultiXcan (Bonferroni corrected P < 0.05) and colocalization with fastENLOC (rcp > 0.5) and Coloc (posterior probability of the shared single causal variant hypothesis H4 (PP.H4) > 0.8). (g) An example of a colocalization (rcp = 0.78) of cis-eQTLs of DGAT1 gene in liver and GWAS loci of protein yield in cattle on chromosome 14. The top colocalized SNP (rs133257289) is the top cis-eQTL of DGAT1 and the second top GWAS signal of protein yield. (h) A high Pearson correlation (r = 0.91, the two-sided Student’s t-test: df = 2,933; P < 2.2×10-308) between P-values from cis-eQTLs of DGAT1 in liver and GWAS of protein yield.
None
None
None
None
None
None
None
None
None
None

References

    1. Buniello A, et al. The NHGRI-EBI GWAS Catalog of published genome-wide association studies, targeted arrays and summary statistics 2019. Nucleic Acids Research. 2019;47:D1005–D1012. - PMC - PubMed
    1. Hu ZL, Park CA, Reecy JM. Building a livestock genetic and genomic information knowledgebase through integrative developments of Animal QTLdb and CorrDB. Nucleic Acids Research. 2019;47:D701–D710. - PMC - PubMed
    1. Consortium, G. T. The GTEx Consortium atlas of genetic regulatory effects across human tissues. Science. 2020;369:1318–1330. - PMC - PubMed
    1. Fang L, et al. Comprehensive analyses of 723 transcriptomes enhance genetic and biological interpretations for complex traits in cattle. Genome Res. 2020;30:790–801. - PMC - PubMed
    1. Xiang R, et al. Quantifying the contribution of sequence variants with regulatory and evolutionary significance to 34 bovine complex traits. Proc Natl Acad Sci U S A. 2019;116:19398–19408. - PMC - PubMed

Publication types