

Humanistic and economic burden associated with depression in the United States: a cross-sectional survey analysis
- PMID: 35953786
- PMCID: PMC9367058
- DOI: 10.1186/s12888-022-04165-x
Humanistic and economic burden associated with depression in the United States: a cross-sectional survey analysis
Abstract
Background: Depression (major depressive disorder [MDD]) affects the functioning of patients in many facets of life. Very few large-scale studies to date have compared health and economic related outcomes of those with versus without depression, and across various depression severity groups. We aimed to evaluate humanistic and economic burden in respondents with and without depression diagnosis, and across symptom severity groups.
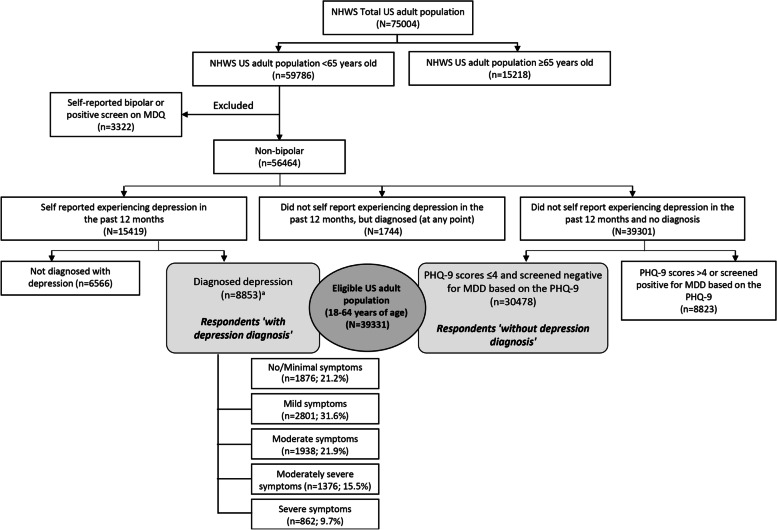
Methods: Data from the 2017 US National Health and Wellness Survey (NHWS) were utilized. Of the adult respondents (N = 75,004), 59,786 were < 65 years old. Respondents not meeting eligibility criteria were excluded (e.g., those self-reporting bipolar disorder or experiencing depression in past 12 months but no depression diagnosis). Overall, data from 39,331 eligible respondents (aged 18-64 years) were analyzed; and comprised respondents 'with depression diagnosis' (n = 8853; self-reporting physician diagnosis of depression and experiencing depression in past 12 months) and respondents 'without depression diagnosis' (n = 30,478; no self-reported physician diagnosis of depression and not experiencing depression). Respondents with depression were further examined across depression severity based on Patient Health Questionnaire-9 (PHQ-9). Outcome measures included health-related quality-of-life (HRQoL; Medical Outcomes Study 36-item Short Form [SF-36v2]: mental and physical component summary [MCS and PCS]; Short-Form 6 Dimensions [SF-6D]; and EuroQol 5 Dimensions [EQ-5D]), work productivity and activity impairment (WPAI), and health resource utilization (HRU). Multivariate analysis was performed to examine group differences after adjusting covariates.
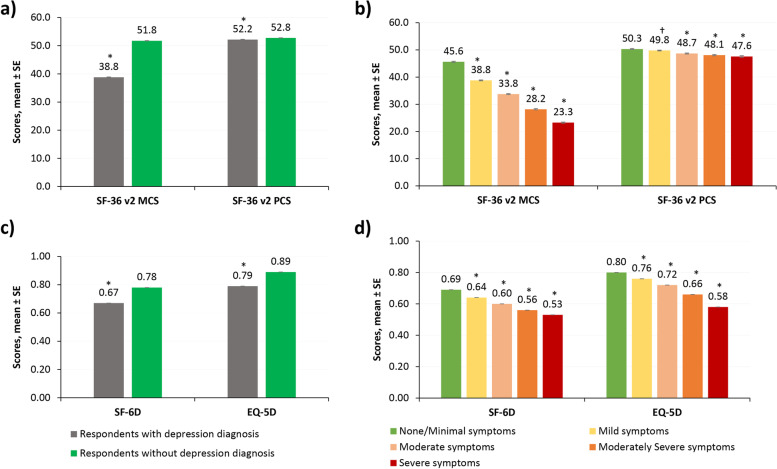
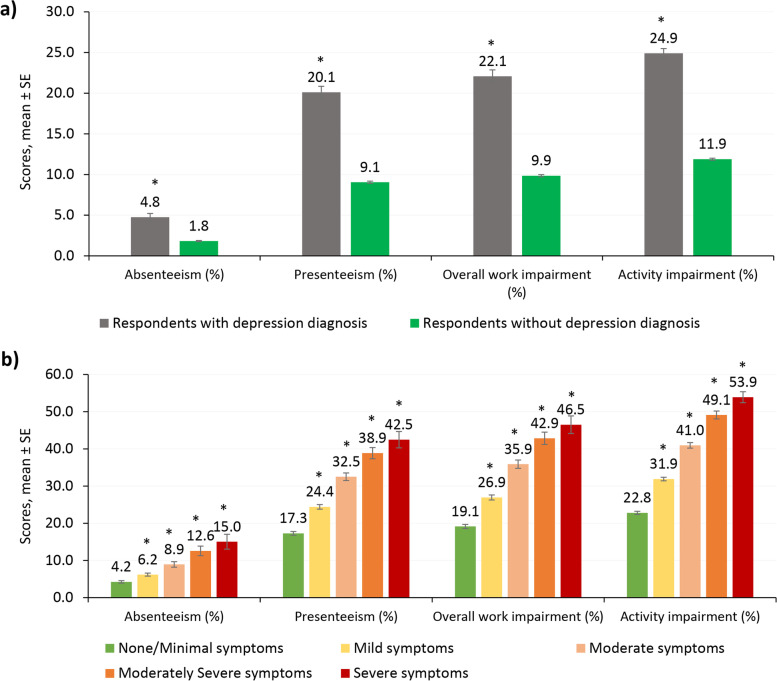
Results: Respondents with depression diagnosis reported significantly higher rates of diagnosed anxiety and sleep problems versus those without depression (for both; P < 0.001). Adjusted MCS, PCS, SF-6D, and EQ-5D scores were significantly lower in respondents with depression versus those without depression (all P < 0.001). Consistently, respondents with depression reported higher absenteeism, presenteeism, and overall WPAI, as well as greater number of provider visits, emergency room visits, and hospitalizations compared with those without depression (all P < 0.001). Further, burden of each outcome increased with an increase in disease severity.
Conclusions: Diagnosed depression was associated with lower health-related quality-of-life and work productivity, and higher healthcare utilization than those without depression, and burden increased with an increase in symptom severity. The results show the burden of depression remains high even among those experiencing minimal symptoms.
Keywords: Anxiety; Depression; Healthcare resource utilization; Quality of life; Sleep disorder; Work productivity.
© 2022. The Author(s).
Conflict of interest statement
SJ is an adjunct Clinical Affiliate, School of Nursing at University of Texas, Austin. SG and VWL are employees of Cerner Enviza. ES is an employee of Sage Therapeutics, Inc. AA is a former employee of Sage Therapeutics, Inc.
Figures
References
-
- National Institue of Mental Health. Depression. https://www.nimh.nih.gov/health/topics/depression. Accessed 27 Jan 2022.
-
- American Psychiatric Association. Diagnostic and statistical manual of mental disorders. 5th ed. Arlington: American Psychiatric Association; 2013. https://dsm.psychiatryonline.org/doi/book/10.1176/appi.books.9780890425596. - DOI
-
- Liu Q, He H, Yang J, Feng X, Zhao F, Lyu J. Changes in the global burden of depression from 1990 to 2017: Findings from the Global Burden of Disease study. J Psychiatr Res. 2020;126:134–140. - PubMed
-
- National Survey on Drug Use and Health. 2020 NSDUH detailed tables. 2020. https://www.samhsa.gov/data/report/2020-nsduh-detailed-tables. Accessed 07 June 2022.
Publication types
MeSH terms
LinkOut - more resources
Full Text Sources
Miscellaneous
