. 2022 Aug 11;41(1):242.
doi: 10.1186/s13046-022-02419-w.

Ryanodine receptor 1-mediated Ca2+ signaling and mitochondrial reprogramming modulate uterine serous cancer malignant phenotypes

Affiliations

Ryanodine receptor 1-mediated Ca2+ signaling and mitochondrial reprogramming modulate uterine serous cancer malignant phenotypes

Li Zhang et al. J Exp Clin Cancer Res. .

Abstract

Background: Uterine serous cancer (USC) is the most common non-endometrioid subtype of uterine cancer, and is also the most aggressive. Most patients will die of progressively chemotherapy-resistant disease, and the development of new therapies that can target USC remains a major unmet clinical need. This study sought to determine the molecular mechanism by which a novel unfavorable prognostic biomarker ryanodine receptor 1 (RYR1) identified in advanced USC confers their malignant phenotypes, and demonstrated the efficacy of targeting RYR1 by repositioned FDA-approved compounds in USC treatment.

Methods: TCGA USC dataset was analyzed to identify top genes that are associated with patient survival or disease stage, and can be targeted by FDA-approved compounds. The top gene RYR1 was selected and the functional role of RYR1 in USC progression was determined by silencing and over-expressing RYR1 in USC cells in vitro and in vivo. The molecular mechanism and signaling networks associated with the functional role of RYR1 in USC progression were determined by reverse phase protein arrays (RPPA), Western blot, and transcriptomic profiling analyses. The efficacy of the repositioned compound dantrolene on USC progression was determined using both in vitro and in vivo models.

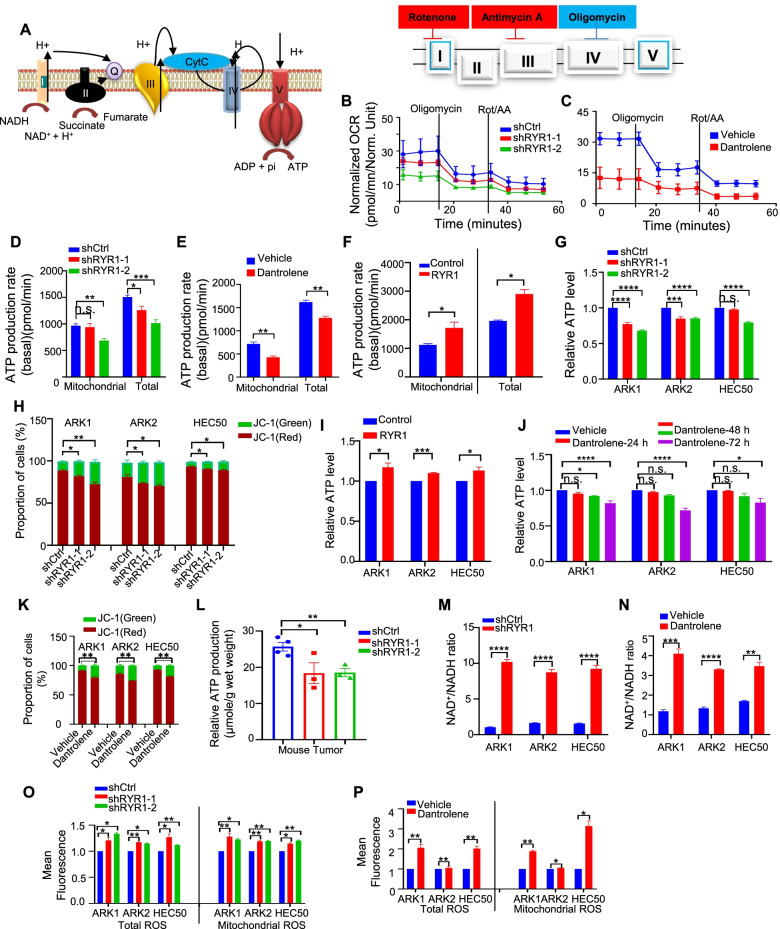
Results: High expression level of RYR1 in the tumors is associated with advanced stage of the disease. Inhibition of RYR1 suppressed proliferation, migration and enhanced apoptosis through Ca2+-dependent activation of AKT/CREB/PGC-1α and AKT/HK1/2 signaling pathways, which modulate mitochondrial bioenergetics properties, including oxidative phosphorylation, ATP production, mitochondrial membrane potential, ROS production and TCA metabolites, and glycolytic activities in USC cells. Repositioned compound dantrolene suppressed USC progression and survival in mouse models.

Conclusions: These findings provided insight into the mechanism by which RYR1 modulates the malignant phenotypes of USC and could aid in the development of dantrolene as a repurposed therapeutic agent for the treatment of USC to improve patient survival.

Keywords: AKT/CREB/PGC-1α signaling pathway and AKT/HK1/2 signaling pathway; RYR1; USC.


Conflict of interest statement

The authors declare no competing interests.

Figures

Fig. 1
Fig. 1
RYR1 is significantly upregulated in USC. A Flow chart for identifying differential expressed genes from TCGA dataset that are associated with. USC development including normal control (n = 35), EEC (n = 409) and USC (n = 115). FC=Fold Change, HR = Hazard Ratio, OS=Overall Survival, N = number of sample, n = number of gene. B Relative RYR1 mRNA levels in USC, EEC, and UE cells detected by ddPCR. C Western blot of RYR1 protein in the indicated USC and UE cells
Fig. 2
Fig. 2
RYR1 enhances cell proliferation and metastasis and suppresses cell apoptosis. A, B Growth curves showing the effect of (A) RYR1 silencing using stably expressed shRNAs (shRYR1–1 and shRYR1–2) and control shRNA (shCtrl) and (B) RYR1 overexpression using stably expressed RYR1 construct and empty vector control in USC cells ARK1, ARK2, and HEC50. *p < 0.05, **p < 0.01, ***p < 0.001, ****p < 0.0001 (2-way ANOVA). C, F Relative number of (C) USC shRYR1 or shCtrl cells and (F) USC treated with dantrolene (20 or 50 μM) or vehicle migrating through the transwell membrane. D, G Relative frequencies of apoptotic cells in (D) USC shRYR1 or shCtrl cells, and (G) USC treated with dantrolene or vehicle. E Growth curves showing the effect of dantrolene (30 μM) on USC cells ARK1, ARK2 and HEC50. H, I Representative bioluminescence images (H) and bar charts showing relative bioluminescence intensities (I) in nude mice at week 10 after injection with luciferase-labelled ARK1-shRYR1 or shCtrl cells. J Kaplan-Meier analysis for overall survival in mice injected with ARK1-shRYR1 or shCtrl. Log rank test. p = 0.0009. K, L Representative bioluminescence images (K) and bar charts showing relative bioluminescence intensities (L) at week 9 in luciferase-labelled ARK1-bearing mice injected intraperitoneally with dantrolene. N = 10 mice per group. M, N. Representative immunohistochemical staining images (M) and bar charts (N) of numbers of Ki-67-, CD31-, CCP3-positive cells in tumor tissues from mice treated with 50 μM dantrolene or vehicle. Scale bar, 100 μm. In C, D, E, F, G, I, L, N, *p < 0.05, ***p < 0.001, ****p < 0.0001, n.s., no significance (Student t-test). In A-G, N, graphs represent mean ± SEM of 3 independent experiments
Fig. 3
Fig. 3
RYR1 modulates intracellular calcium levels. A Cytosolic Ca2+ concentration (nM) monitored by Fura-2 in ARK1-shRYR1 (n = 87) or -shCtrl (n = 58) (left) and -RYR1 (n = 271) or -Control (n = 171) (right) cells. ****p < 0.0001 (Student t-test). B Mean normalized RYR1- mediated Ca2+ transient activated by 4-CMC (25 μM) in ARK1 (blue, n = 116), ARK1-shRYR1 (red, n = 70), and ARK1-RYR1 (green, n = 55) cells. C Mitochondrial Ca2+ detected by CEPIA2mt in ARK1 (blue, n = 21), ARK1- RYR1 (red, n = 16), and ARK1-shRYR1 (green, n = 13) cells activated by 4-CMC (25 μM). D Representative image of 2 ARK1 cells, indicating 4 different ROIs at which photorelease of cADPR was activated, and ER and mitochondrial Ca2+ transient was recorded. The time course of change in ER (blue) and mitochondrial (red) Ca2+ signals (F/F0) recorded in the 4 ROIs depicted in the image. E Mean normalized ER [Ca2+] and mitochondrial [Ca2+] activated by photorelease of caged cADPR at subcellular ROIs in ARK1 cells (n = 12 ROIs in 9 cells)
Fig. 4
Fig. 4
RYR1 depletion suppresses mETC gene expression. A Heatmaps showing relative expression levels of mitochondrial proteins measured by RPPA in ARK1-shCtrl and shRYR1 cells (left); or cells treated with vehicle or dantrolene (right). Signal intensities were normalized to the control groups. B Graphic illustration of components in the 4 complexes of mitochondrial respiration chain. C, D. Relative mRNA (C) and protein (D) expressions of mETC genes determined by qPCR and Western blot, respectively, in USC cells transfected with RYR1-specific shRNAs or shCtrl. β-actin was used as a loading control. Data are shown as the mean ± SEM of 3 independent experiments. E Relative mRNA expression of mETC genes determined by qPCR in USC cells treated with 50 μM dantrolene or vehicle. Data are shown as the mean ± SEM of 3 independent experiments. *p < 0.05, **p < 0.01, ***p < 0.001, ****p < 0.0001, n.s., no significance (Student t-test). F Relative expressions of NDUFB4, SDHA, COXIV and ATP5a in TCGA dataset (Student t-test). G Correlation of NDUFB4, SDHA, COXIV and ATP5a with RYR1 in GSE24537
Fig. 5
Fig. 5
RYR1 modulates mitochondrial bioenergetics properties. A Graphic illustration of ETC functions in mitochondrial membrane. B-C Representative pattern of OCR as a function over time in ARK1-shRYR1 vs shCtrl cells (B) or dantrolene- vs vehicle-treated cells (C). D-F Mitochondrial ATP and total ATP production rate (basic, pmol/min) in ARK1- shRYR1 or -shCtrl cells (D), cells treated with dantrolene or the vehicle (E), and ARK1-RYR1 or -Control cells (F). G, I, J Relative ATP levels in ARK1-shRYR1 vs shCtrl cells (G), USC RYR1 vs control cells (I), indicated cells incubated with dantrolene or vehicle (J). H, K Mitochondrial membrane potential of USC cells transfected with shRYR1 or shCtrl (H), treated with 50 μM dantrolene or vehicle (K) examined by JC-1 distribution. Green: JC-1 monomer, Red: JC-1 aggregates. L Bar charts showing relative ATP production (μmol/g) in mouse tumor tissues derived from ARK1-shRYR1 or -shCtrl cells. M-N, Relative NAD+/NADH ratios in USC cells transfected with shRYR1 or shCtrl (M) and treated with dantrolene or the vehicle (N). O-P Relative total and mitochondrial ROS in USC cells transfected with shRYR1 or shCtrl (O) and treated with dantrolene or vehicle (P) In B-P, N = 3 independent experiments. Data represent mean ± SEM. *p < 0.05, **p < 0.01, ***p < 0.001, ****p < 0.0001, n.s., no significance (Student t-test)
Fig. 6
Fig. 6
RYR1 silencing suppresses TCA cycle and glycolysis. A-B Heatmaps showing relative levels (-log2) of differential metabolites in glycolysis and TCA cycle in cell lysates. ARK1-shCtrl vs ARK1-shRYR1 (A) and ARK1-vehice vs ARK1-dantrolene (B), subjected to LC-MS for metabolite measurement. C Graphic illustration of intermediate metabolites involved in glycolysis and TCA cycle. Green- labeled indicate the decreased ones in RYR1-silenced or dantrolene-treated cells than controls. D Representative patterns of ECAR from ARK1 cells transfected with shRYR1 or shCtrl. E-F Relative glutamine levels in USC cells transfected with RYR1- shRNAs or shCtrl (E) and treated with 50 μM dantrolene or vehicle (F). G Relative glutamine levels in USC cells transfected with RYR1 full-length cDNA or control vector. In D-G, data represent the mean ± SEM of 3 independent experiments. *p < 0.05, **p < 0.01, ***p < 0.001, ****p < 0.0001 (Student t-test)
Fig. 7
Fig. 7
Ca2+ /AKT/CREB/PGC-1α axis is essential for tumor progression. A-B PGC-1α mRNA expression in the indicated cells with shCtrl or shRYR1 (A) or incubated with dantrolene or vehicle (B). C F Western blot of PGC-1α (C) proteins in AKT/CREB pathway (F) in control- or RYR1-silenced and vehicle- or dantrolene-treated ARK1 cells. D mETC genes mRNA expression in PGC-1α-silenced (siPGC-1α) or control (siCtrl) ARK1 cells transfected with RYR1 or control. E Western blot of HK1 and HK2 in control- or RYR1- silenced ARK1 cells. G Western blot of PGC-1α in ARK1-Control and ARK1-RYR1 cells treated with of AKT or CREP inhibitor vs vehicle. H Relative ATP level in control and RYR1-overexpressing cells transfected with siCtrl or siPGC-1α. *p < 0.05, **p < 0.01, ****p < 0.0001 (Student t-test). I mETC genes mRNA expression in ARK1- Control and ARK1-RYR1 cells in the presence of siPGC-1α, AKT (0.1 μM) or CREB inhibitor (0.1 nM) or controls. J Cell growth of ARK1-Control and ARK1-RYR1 incubated with AKT or CREB inhibitor. *p < 0.05, **p < 0.01, n.s., no significance (2-way ANOVA). K Western blot of phosphorylated AKT (S473), phosphorylated CREB (S133), and total AKT and CREB in ARK1-shCtrl and ARK1-shRYR1 cells treated with BAPTA or vehicle. L Graphic illustration of the molecular mechanism. In A, B, D, I, N = 3 independent experiments. HPRT was internal control. *p < 0.05, **p < 0.01, ****p < 0.0001, n.s., no significance (Student t-test). In C, E, F, G, K, N = 3 independent experiments. Data are shown as mean ± SEM. ImageJ software was applied to quantify signals. β-actin was used as loading control

Similar articles

Cited by

References

    1. Fader AN, Boruta D, Olawaiye AB, Gehrig PA. Uterine papillary serous carcinoma: epidemiology, pathogenesis and management. Curr Opin Obstet Gynecol. 2010;22:21–29. doi: 10.1097/GCO.0b013e328334d8a3. - DOI - PubMed
    1. Boruta DM, 2nd, Gehrig PA, Fader AN, Olawaiye AB. Management of women with uterine papillary serous cancer: a Society of Gynecologic Oncology (SGO) review. Gynecol Oncol. 2009;115:142–153. doi: 10.1016/j.ygyno.2009.06.011. - DOI - PubMed
    1. Black JD, English DP, Roque DM, Santin AD. Targeted therapy in uterine serous carcinoma: an aggressive variant of endometrial cancer. Womens Health. 2014;10:45–57. - PMC - PubMed
    1. Lisio MA, Fu L, Goyeneche A, Gao ZH, Telleria C. High-grade serous ovarian Cancer: basic sciences, clinical and therapeutic standpoints. Int J Mol Sci. 2019;20(4):952. - PMC - PubMed
    1. Wallbillich JJ, Morris RT, Ali-Fehmi R. Comparing mutation frequencies for homologous recombination genes in uterine serous and high-grade serous ovarian carcinomas: a case for homologous recombination deficiency testing in uterine serous carcinoma. Gynecol Oncol. 2020;159(2):381-386. - PubMed

MeSH terms

Substances