. 2022 Aug 11;20(1):178.
doi: 10.1186/s12915-022-01376-2.

Griottes: a generalist tool for network generation from segmented tissue images

Affiliations

Griottes: a generalist tool for network generation from segmented tissue images

Gustave Ronteix et al. BMC Biol. .

Abstract

Background: Microscopy techniques and image segmentation algorithms have improved dramatically this decade, leading to an ever increasing amount of biological images and a greater reliance on imaging to investigate biological questions. This has created a need for methods to extract the relevant information on the behaviors of cells and their interactions, while reducing the amount of computing power required to organize this information.

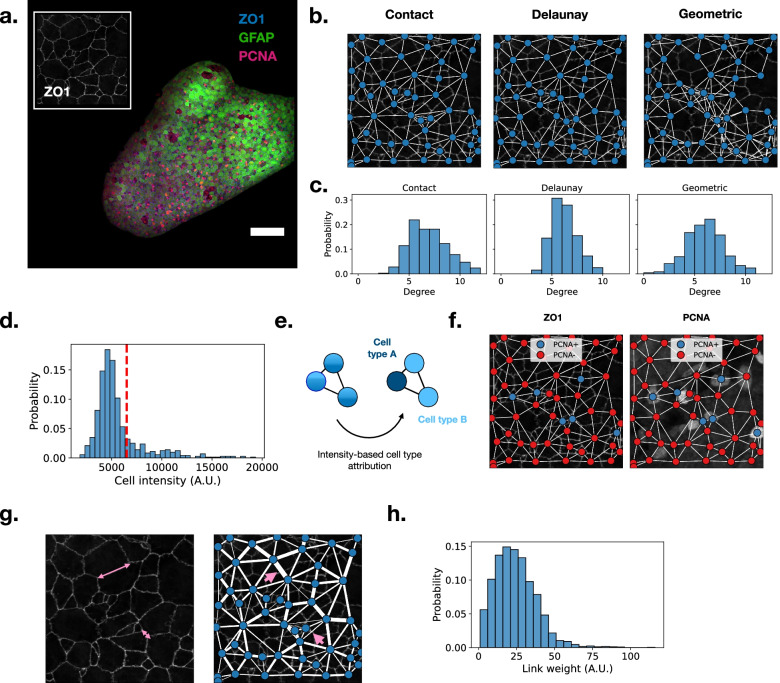
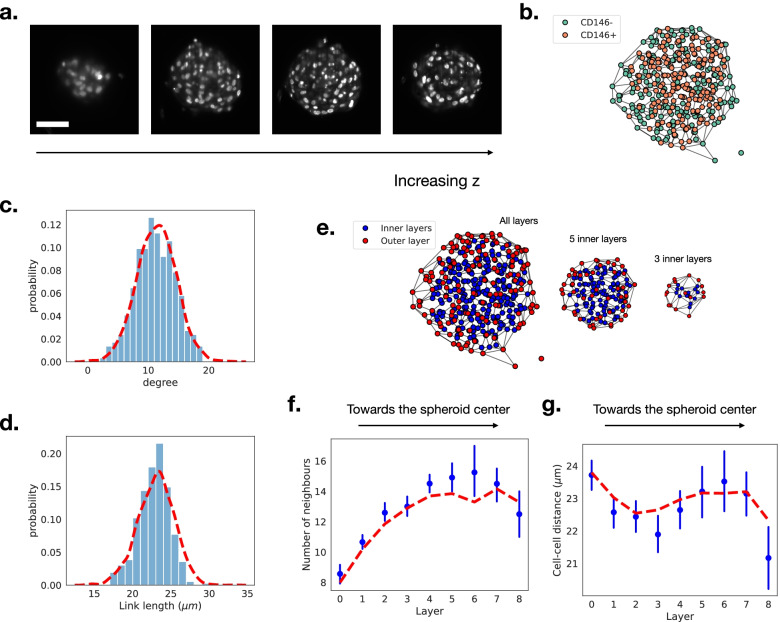
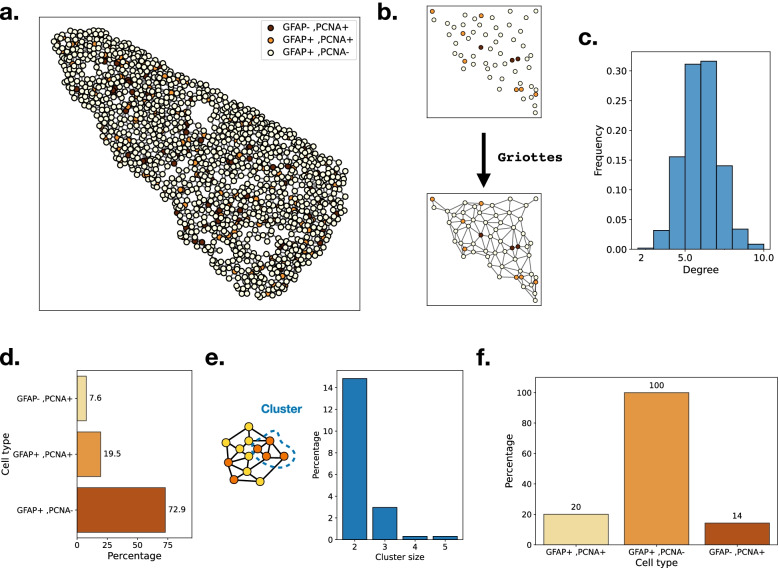
Results: This task can be performed by using a network representation in which the cells and their properties are encoded in the nodes, while the neighborhood interactions are encoded by the links. Here, we introduce Griottes, an open-source tool to build the "network twin" of 2D and 3D tissues from segmented microscopy images. We show how the library can provide a wide range of biologically relevant metrics on individual cells and their neighborhoods, with the objective of providing multi-scale biological insights. The library's capacities are demonstrated on different image and data types.

Conclusions: This library is provided as an open-source tool that can be integrated into common image analysis workflows to increase their capacities.

Keywords: Graphs; Image analysis; Napari; Python; Single-cell imaging; Spatial analysis; Tissue imaging.


Conflict of interest statement

The authors declare that they have no competing interests.

Figures

Fig. 1
Fig. 1
Schematic representation of the Griottes workflow: the program takes multiple data formats as input to generate a graph in a single command. The red boxes contain objects, the green boxes processes
Fig. 2
Fig. 2
a Confocal dorsal view of the zebrafish adult pallium. Glial fibrillary acidic protein (GFAP) in green, Proliferating cell nuclear antigen (PCNA) in magenta and Zonula occludens-1 (ZO1) in white or blue. ZO1 is highlighting the apical domain of the cells allowing the identification of their apical area. Inset: spotlight on a limited tissue area, the ZO1 membrane staining allows for the exact localization of cell membranes. Scale bar is 100 μm. Griottes incorporates different network construction methods. The contact-based method connects cells sharing a common membrane, the Delaunay and Geometric graphs are commonly used graph-generation methods. c The graphs generated from a same set of nodes with different construction rules have different properties. For instance, the degree distribution of a Geometric graph is broader than that of the Contact and Delaunay graph. d Mean PCNA signal within the cells in the example tissue. Cells with an average intensity above 6500 (red line) are considered PCNA+, the other cells are PCNA−. e Thresholding intensity signals converts a network populated with continuous fluorescence signals to a network populated with categorical cell types. f. Representation of the example network (panel b) where node colors represent cell type. Left: the network is projected on the ZO1 signal. Right: the network is projected on the PCNA signal. This method reliably incorporates cell type information into the network representation of the tissue. g Left: connected cells can have widely varying contact surfaces. Right: this information can be encoded into the network by weighting the links between cells. Two differing cell-cell interfaces (pink lines) have different link weights in the network representation of the tissue (pink arrows). h The connection between cells can be quantified at scale: the histogram of link weights in the tissue shown in panel a
Fig. 3
Fig. 3
a Sections of a MSC spheroid imaged with a light-sheet microscope. The technique allows in-depth imaging of tissue structures. Scale bar is 50 μm. b 3D network representation of a MSC spheroid. Different cell types are identified based upon CD146 fluorescence measurements. c Comparison between the degree distribution of an example spheroid (panel b, bars) and the batch distribution (N = 5, red line). d Comparison between the link-length distribution of an example spheroid (bars) and the batch distribution (red line). e The network representation makes it possible to identify cells on the outer layer of the spheroid (red) from the inner cells (blue). We can “peel off” the outer layers successively, revealing the inner structure and composition of the spheroid. f Cell degree as a function of the layer number, the average degree is larger for the layers near the center of the spheroid. Blue dots show one example spheroid and red dashed line represents average over the experimental batch. g Distance between cell centers (in μm) as a function of the layer number. Blue dots show one example spheroid and red dashed line represents average over the experimental batch
Fig. 4
Fig. 4
a Reconstruction of the zebrafish telencephalon from a data table. Colors represent the different cell types entered in the table by the user. b Network construction with Griottes from a point-cloud using the Delaunay construction rule. c Degree distribution of cells composing the zebrafish telencephalon after the network construction using the Delaunay rule. d Composition of the zebrafish telencephalon: a vast majority of the cells are GFAP+/PCNA−. e From the network representation of the tissue we can extract clusters of any given cell type (left). Distribution of PCNA+ cluster sizes for clusters of two cells or more (right). f Percentage of cells that belong to a cluster of their cell type of size larger than 2. All GFAP+/PCNA− cells are connected and belong to the same cluster. Conversely, a majority of GFAP+/PCNA− and GFAP+/PCNA+ cells aren’t connected to any other cell of the same type

References

    1. Warmflash A, Sorre B, Etoc F, Siggia ED, Brivanlou AH. A method to recapitulate early embryonic spatial patterning in human embryonic stem cells. Nat Meth. 2014;11(8):847–854. doi: 10.1038/nmeth.3016. - DOI - PMC - PubMed
    1. Schürch CM, Bhate SS, Barlow GL, Phillips DJ, Noti L, Zlobec I, et al. Coordinated cellular neighborhoods orchestrate antitumoral immunity at the colorectal cancer invasive front. Cell. 2020;182(5):1341–1359. doi: 10.1016/j.cell.2020.07.005. - DOI - PMC - PubMed
    1. Stoltzfus CR, Filipek J, Gern BH, Olin BE, Leal JM, Wu Y, et al. CytoMAP: A spatial analysis toolbox reveals features of myeloid cell organization in lymphoid tissues. Cell Rep. 2020;31(3):107523. - PMC - PubMed
    1. Binnewies M, Roberts EW, Kersten K, Chan V, Fearon DF, Merad M, et al. Understanding the tumor immune microenvironment (TIME) for effective therapy. Nat Med. 2018;24(5):541–550. doi: 10.1038/s41591-018-0014-x. - DOI - PMC - PubMed
    1. Jackson HW, Fischer JR, Zanotelli VRT, Ali HR, Mechera R, Soysal SD, et al. The single-cell pathology landscape of breast cancer. Nature. 2020;578(7796):615–620. doi: 10.1038/s41586-019-1876-x. - DOI - PubMed

Publication types

MeSH terms

LinkOut - more resources