. 2022 Aug 5;11(15):2346.
doi: 10.3390/foods11152346.

The Impact of Innovative Plant Sources (Cordia myxa L. Fruit (Assyrian Plum) and Phoenix dactylifera L. Biowaste (Date Pit)) on the Physicochemical, Microstructural, Nutritional, and Sensorial Properties of Gluten-Free Biscuits

Affiliations

The Impact of Innovative Plant Sources (Cordia myxa L. Fruit (Assyrian Plum) and Phoenix dactylifera L. Biowaste (Date Pit)) on the Physicochemical, Microstructural, Nutritional, and Sensorial Properties of Gluten-Free Biscuits

Syed Muhammad Ghufran Saeed et al. Foods. .

Abstract

The gluten-free products available on the markets are deficient in bioactive compounds and high in cost. The present study is designed to develop gluten-free biscuits with enhanced nutritional properties. The gluten-free biscuits are formulated with rice flour (RF) incorporated with Assyrian plum fruit flour (APF) and bio-waste date-pit flour (DPF) according to the following ratios; RF:DPF:APF (100:0:0)/T0, (90:5:5)/T1, (80:10:10)/T2, and (70:15:15)/T3. The results demonstrate that flour blends with different concentrations of APF and DPF incorporated in RF have high contents of protein, damaged starch, crude fiber, ash, phytochemicals, and antioxidants in contrast to 100% RF, which shows the lowest values for all these parameters. The pasting properties of the flour blends reveals that the values of peak, final, breakdown, and setback viscosities reduce from T1 to T3. Similarly, a differential scanning calorimeter reveals that the phase transition temperature of the flour blends decreases with the increasing amylose content. Moreover, the scanning electron microscopy of the biscuit samples shows a positive contribution of APF and DPF for the development of the desired compactness of the structure due to the leaching of amylose content from the starch. The total phenol content (TPC) and total flavonoid content (TFC) increase from 38.43 to 132.20 mg GAE/100 g DW and 18.67 to 87.27 mg CE/100 g DW, respectively. Similarly, the antioxidant activities of biscuits improved. The protein and fiber contents of the biscuits increased from 10.20 to 14.73% and 0.69 to 12.25%, respectively. The biscuits prepared from T3 resulted in a firmer texture with a reduced spread ratio. However, the formulation of T1 and T2 biscuit samples contributed to desirable physical and sensory properties. Therefore, the addition of DPF and APF to RF is a sustainable way to make gluten-free biscuits as they provide adequate amylose, damaged starch, and fiber content to overcome the essential role of gluten in the baked product with nutraceutical properties.

Keywords: bakery; bioactive compounds; gluten-free biscuits; pasting properties; scanning electron microscopy; sensory analysis.


Conflict of interest statement

There are no competing interest declared by any of the authors.

Figures

Figure 1
Figure 1
Appearance and scanning electron microscopic images (at 350× magnification) of gluten-free biscuit samples: (a,c) T0; RF:DPF:APF (100:0:0); (b,d) T1; RF:DPF:APF (90:5:5), (e,g) T2; RF:DPF:APF (80:10:10), and (f,h) T3; RF:DPF:APF (70:15:15), respectively, where T0, T1, T2, and T3 are the treatment (T) levels. Rice flour: RF, date pit flour: DPF, Assyrian plum flour: APF.
Figure 2
Figure 2
(a) Correlogram analysis with the obtained values of the Pearson coefficient of correlation between the bioactive compounds (total phenol content (TPC) and total flavonoid content (TFC)), and antioxidant activities (DPPH-IC50 and FRAP-IC50) of flour blends and biscuits. (b) Correlogram with the defined significance levels, where DPPH: 2, 2-diphenyl-1-picrylhydrazyl, FRAP: ferric reducing antioxidant power.
Figure 2
Figure 2
(a) Correlogram analysis with the obtained values of the Pearson coefficient of correlation between the bioactive compounds (total phenol content (TPC) and total flavonoid content (TFC)), and antioxidant activities (DPPH-IC50 and FRAP-IC50) of flour blends and biscuits. (b) Correlogram with the defined significance levels, where DPPH: 2, 2-diphenyl-1-picrylhydrazyl, FRAP: ferric reducing antioxidant power.
Figure 3
Figure 3
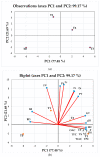
(a) Principal component analysis with the location of flour blend samples: T0; RF (rice flour):DPF (date pit flour):APF (Assyrian plum flour) (100:0:0), T1; RF:DPF:APF (90:5:5), T2; RF:DPF:APF (80:10:10), and T3; RF:DPF:APF (70:15:15). (b) Bi-plot of flour blend samples with the distribution of properties (physicochemical, functional, pasting, and bioactive compounds) in space defined by principal components 1 (PC1) and 2 (PC2), where T0, T1, T2, and T3 are the treatment (T) levels. MC; moisture content, A; ash, P; protein, CF; crude fiber, DS; damaged starch, TS; total starch, AC; amylose content, WAC; water absorption capacity, OAC; oil absorption capacity, TPC; total phenolic content, TFC; total flavonoid content, BD; breakdown viscosity, SB; setback viscosity, FV; final viscosity, PT; pasting temperature, GT; gelatinization time, To; onset temperature, Tp; peak temperature, Tc; conclusion temperature, ΔH; enthalpy of gelatinization.
Figure 4
Figure 4
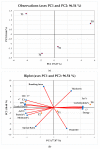
(a) Principal component analysis with the location of biscuit samples: T0; RF (rice flour):DPF (date pit flour):APF (Assyrian plum flour) (100:0:0), T1; RF:DPF:APF (90:5:5), T2; RF:DPF:APF (80:10:10), and T3; RF:DPF:APF (70:15:15). (b) Bi-plot of gluten-free biscuit samples describing the relationship between parameters (bioactive compounds, color values, nutritional, dimensional, and textural) in the space defined by principal components 1 (PC1) and 2 (PC2), where T0, T1, T2, and T3 are the treatment (T) levels. TPC; total phenolic content, TFC; total flavonoid content.
Figure 5
Figure 5
(a) Principal component analysis with the score plot of sensory analysis of gluten-free biscuit samples describing the variations among the samples: T0; RF (rice flour):DPF (date pit flour):APF (Assyrian plum flour) (100:0:0), T1; RF:DPF:APF (90:5:5), T2; RF:DPF:APF (80:10:10), and T3; RF:DPF:APF (70:15:15). (b) Bi-plot of gluten-free biscuit samples describing the relationship between parameters (bioactive compounds, color values nutritional, dimensional, and textural) in the space defined by principal component 1 (PC1) and 2 (PC2), where T0, T1, T2, and T3 are the treatment (T) levels. TPC; total phenolic content, TFC; total flavonoid content.

References

    1. Cannas M., Pulina S., Conte P., Del Caro A., Urgeghe P.P., Piga A. Effect of substitution of rice flour with Quinoa flour on the chemical-physical, nutritional, volatile and sensory parameters of gluten-free ladyfinger biscuits. Foods. 2020;9:808. doi: 10.3390/foods9060808. - DOI - PMC - PubMed
    1. Singh P., Arora A., Strand T.A., Leffler D.A., Catassi C., Green P.H., Kelly C.P., Ahuja V., Makharia G.K. Global prevalence of celiac disease: Systematic review and meta-analysis. Nat. Rev. Gastroenterol. Hepatol. 2018;16:823–836. e822. doi: 10.1016/j.cgh.2017.06.037. - DOI - PubMed
    1. Czaja-Bulsa G., Bulsa M. Adherence to gluten-free diet in children with celiac disease. Nutrients. 2018;10:1424. doi: 10.3390/nu10101424. - DOI - PMC - PubMed
    1. Sulieman A.A., Zhu K.X., Peng W., Hassan H.A., Obadi M., Siddeeg A., Zhou H.M. Rheological and quality characteristics of composite gluten-free dough and biscuits supplemented with fermented and unfermented Agaricus bisporus polysaccharide flour. Food Chem. 2019;271:193–203. doi: 10.1016/j.foodchem.2018.07.189. - DOI - PubMed
    1. Valitutti F., Iorfida D., Anania C., Trovato C.M., Montuori M., Cucchiara S., Catassi C. Cereal consumption among subjects with celiac disease: A snapshot for nutritional considerations. Nutrients. 2017;9:396. doi: 10.3390/nu9040396. - DOI - PMC - PubMed