. 2022 Jul 27;11(15):2311.
doi: 10.3390/cells11152311.

Kidney Cancer Biomarker Selection Using Regularized Survival Models

Affiliations

Kidney Cancer Biomarker Selection Using Regularized Survival Models

Carolina Peixoto et al. Cells. .

Abstract

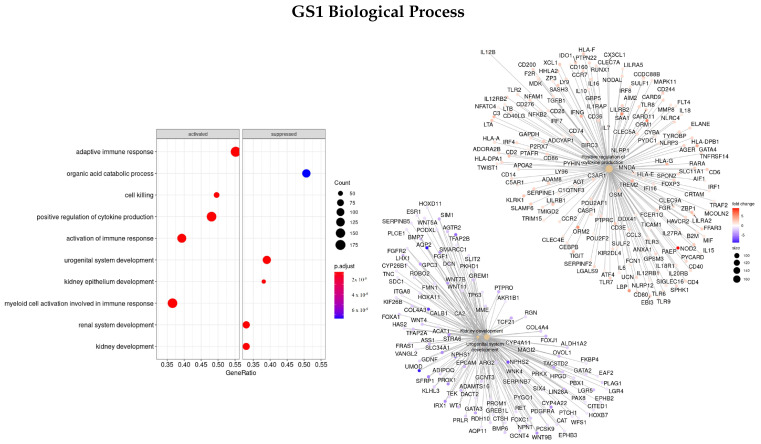
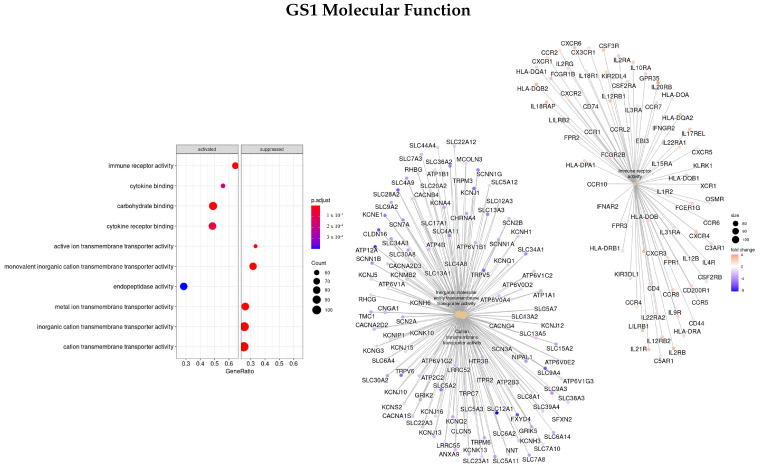
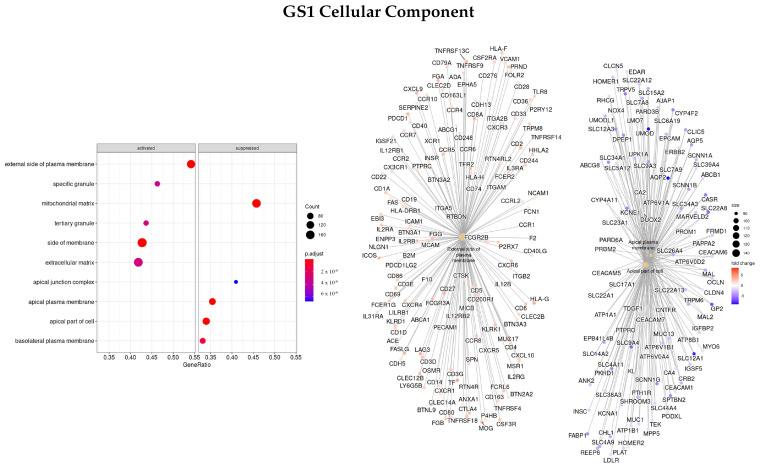
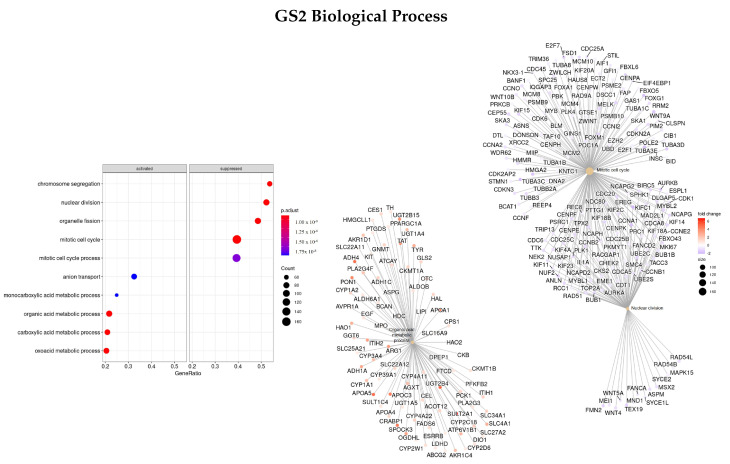
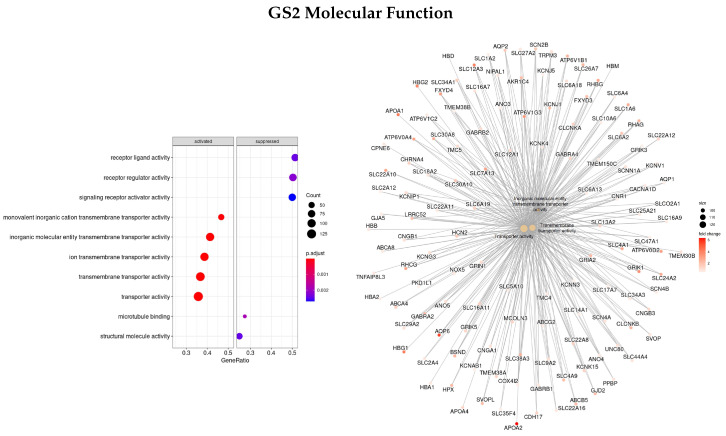
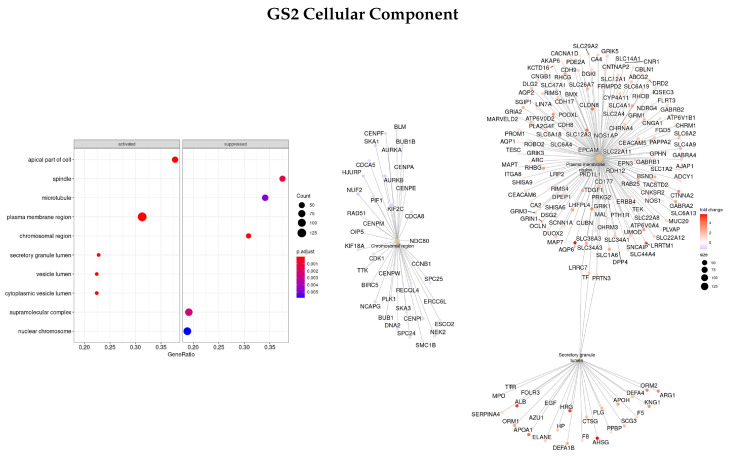
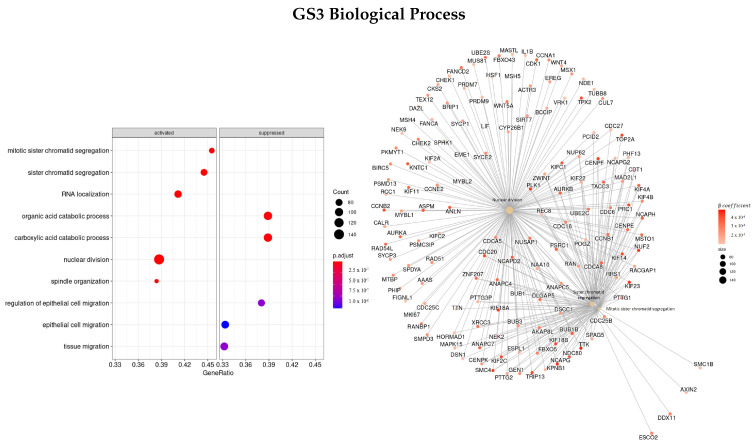
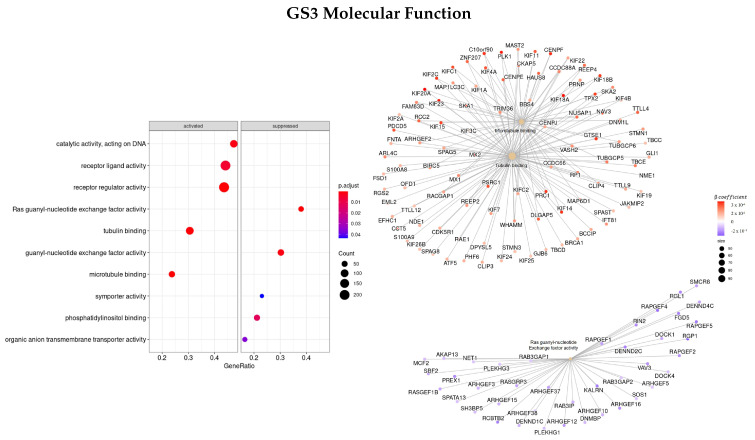
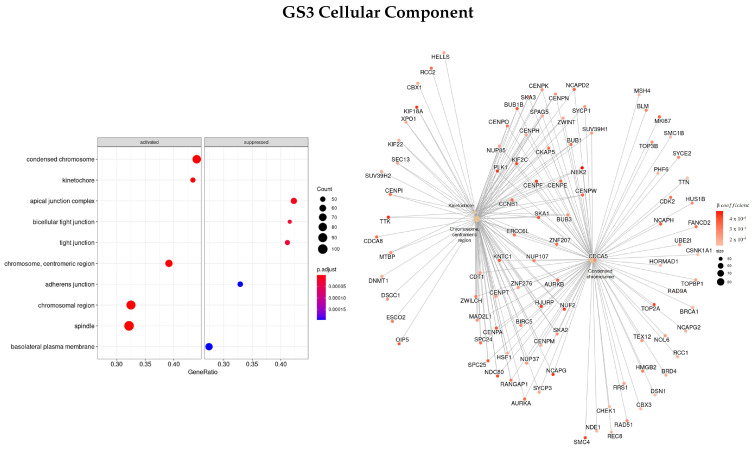
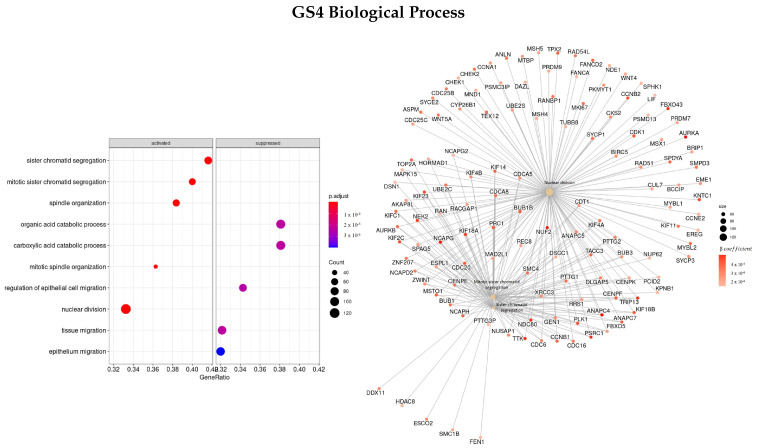
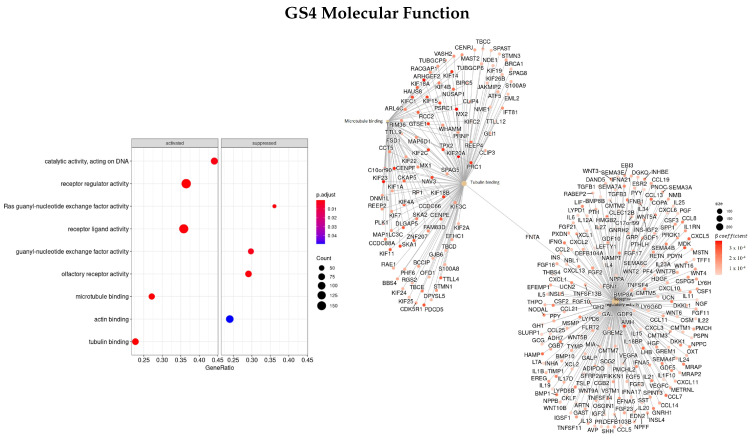
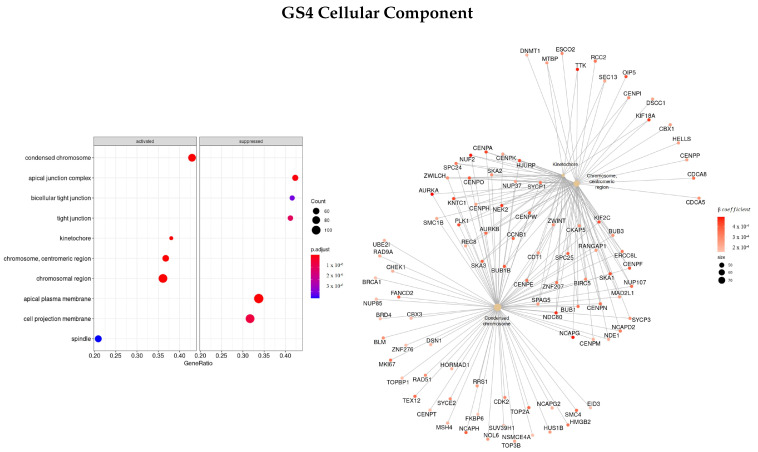
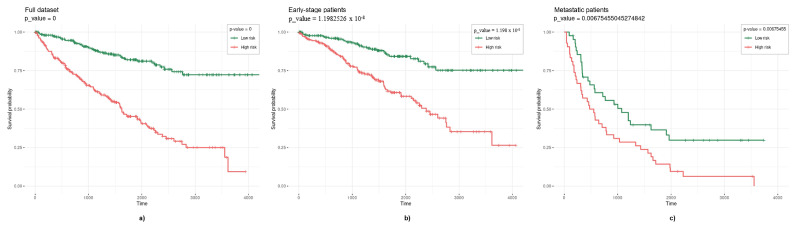
Clear cell renal cell carcinoma (ccRCC) is the most common subtype of RCC showing a significant percentage of mortality. One of the priorities of kidney cancer research is to identify RCC-specific biomarkers for early detection and screening of the disease. With the development of high-throughput technology, it is now possible to measure the expression levels of thousands of genes in parallel and assess the molecular profile of individual tumors. Studying the relationship between gene expression and survival outcome has been widely used to find genes associated with cancer survival, providing new information for clinical decision-making. One of the challenges of using transcriptomics data is their high dimensionality which can lead to instability in the selection of gene signatures. Here we identify potential prognostic biomarkers correlated to the survival outcome of ccRCC patients using two network-based regularizers (EN and TCox) applied to Cox models. Some genes always selected by each method were found (COPS7B, DONSON, GTF2E2, HAUS8, PRH2, and ZNF18) with known roles in cancer formation and progression. Afterward, different lists of genes ranked based on distinct metrics (logFC of DEGs or β coefficients of regression) were analyzed using GSEA to try to find over- or under-represented mechanisms and pathways. Some ontologies were found in common between the gene sets tested, such as nuclear division, microtubule and tubulin binding, and plasma membrane and chromosome regions. Additionally, genes that were more involved in these ontologies and genes selected by the regularizers were used to create a new gene set where we applied the Cox regression model. With this smaller gene set, we were able to significantly split patients into high/low risk groups showing the importance of studying these genes as potential prognostic factors to help clinicians better identify and monitor patients with ccRCC.

Keywords: Cox regression; biomarker selection; gene ontology; kidney cancer; regularization.


Conflict of interest statement

The authors declare no conflict of interest.

Figures

Figure 1
Figure 1
Gene ontology enrichment analysis regarding biological processes terms for a list of DEGs ranked by the log fold change between tumor and normal tissues. The left panel shows a dot chart with the most significant BP terms. The right panel shows a gene-concept network plot of the three most enriched terms that depicts the linkages of genes and biological concepts as a network.
Figure 2
Figure 2
Gene ontology enrichment analysis regarding molecular function terms for a list of DEGs ranked by the log fold change between tumor and normal tissues. The left panel shows a dot chart with the most significant MF terms. The right panel shows a gene-concept network plot of the three most enriched terms that depicts the linkages of genes and biological concepts as a network.
Figure 3
Figure 3
Gene ontology enrichment analysis regarding cellular components terms for a list of DEGs ranked by the log fold change between tumor and normal tissues. The left panel shows a dot chart with the most significant CC terms. The right panel shows a gene-concept network plot of the three most enriched terms that depicts the linkages of genes and biological concepts as a network.
Figure 4
Figure 4
Gene ontology enrichment analysis regarding biological processes terms for a list of DEGs ranked by the log fold change between early and advanced stages of the disease. The left panel shows a dot chart with the most significant BP terms. The right panel shows a gene-concept network plot of the three most enriched terms that depicts the linkages of genes and biological concepts as a network.
Figure 5
Figure 5
Gene ontology enrichment analysis regarding molecular functions terms for a list of DEGs ranked by the log fold change between early and advanced stages of the disease. The left panel shows a dot chart with the most significant MF terms. The right panel shows a gene-concept network plot of the three most enriched terms that depicts the linkages of genes and biological concepts as a network.
Figure 6
Figure 6
Gene ontology enrichment analysis regarding cellular components terms for a list of DEGs ranked by the log fold change between early and advanced stages of the disease. The left panel shows a dot chart with the most significant CC terms. The right panel shows a gene-concept network plot of the three most enriched terms that depicts the linkages of genes and biological concepts as a network.
Figure 7
Figure 7
Gene ontology enrichment analysis regarding biological processes terms for a list of genes selected by EN ranked by the β coefficients of the regression. The left panel shows a dot chart with the most significant BP terms and on the right a gene-concept network plot of the three most enriched terms depicts the linkages of genes and biological concepts as a network.
Figure 8
Figure 8
Gene ontology enrichment analysis regarding molecular function terms for a list of genes selected by EN ranked by the β coefficients of the regression. The left panel shows a dot chart with the most significant MF terms and on the right a gene-concept network plot of the three most enriched terms depicts the linkages of genes and biological concepts as a network.
Figure 9
Figure 9
Gene ontology enrichment analysis regarding cellular components terms for a list of genes selected by EN ranked by the β coefficients of the regression. The left panel shows a dot chart with the most significant CC terms and on the right a gene-concept network plot of the three most enriched terms depicts the linkages of genes and biological concepts as a network.
Figure 10
Figure 10
Gene ontology enrichment analysis regarding biological processes terms for a list of genes selected by TCox ranked by the β coefficients of the regression. The left panel shows a dot chart with the most significant BP terms. Right panel shows a gene-concept network plot of the three most enriched terms that depicts the linkages of genes and biological concepts as a network.
Figure 11
Figure 11
Gene ontology enrichment analysis regarding molecular function terms for a list of genes selected by TCox ranked by the β coefficients of the regression. The left panel shows a dot chart with the most significant MF terms. The right panel shows a gene-concept network plot of the three most enriched terms that depicts the linkages of genes and biological concepts as a network.
Figure 12
Figure 12
Gene ontology enrichment analysis regarding cellular components terms for a list of genes selected by TCox ranked by the β coefficients of the regression. The left panel shows a dot chart with the most significant CC terms. The right panel shows a gene-concept network plot of the three most enriched terms that depicts the linkages of genes and biological concepts as a network.
Figure 13
Figure 13
Kaplan–Meier curves obtained when applying a multivariate Cox model to a gene set comprising genes correlated with survival outcome in ccRCC and genes with some enriched ontology associated (p=24). (a) Full dataset (n=527); (b) early stage patients (n=441); (c) metastatic patients (n=84).

References

    1. Díaz-Montero C.M., Rini B.I., Finke J.H. The immunology of renal cell carcinoma. Nat. Rev. Nephrol. 2020;16:721–735. doi: 10.1038/s41581-020-0316-3. - DOI - PubMed
    1. Sung H., Ferlay J., Siegel R.L., Laversanne M., Soerjomataram I., Jemal A., Bray F. Global cancer statistics 2020: GLOBOCAN estimates of incidence and mortality worldwide for 36 cancers in 185 countries. CA A Cancer J. Clin. 2021;71:209–249. doi: 10.3322/caac.21660. - DOI - PubMed
    1. Ferlay J., Laversanne M., Ervik M., Lam F., Colombet M., Mery L., Piñeros M., Znaor A., Soerjomataram I., Bray F. Global Cancer Observatory: Cancer Tomorrow. International Agency for Research on Cancer; Lyon, France: 2020. [(accessed on 16 May 2022)]. Available online: https://gco.iarc.fr/tomorrow.
    1. Cheng Y., Xu T., Li S., Ruan H. GPX1, a biomarker for the diagnosis and prognosis of kidney cancer, promotes the progression of kidney cancer. Aging (Albany NY) 2019;11:12165. doi: 10.18632/aging.102555. - DOI - PMC - PubMed
    1. Harrison H., Thompson R.E., Lin Z., Rossi S.H., Stewart G.D., Griffin S.J., Usher-Smith J.A. Risk prediction models for kidney cancer: A systematic review. Eur. Urol. Focus. 2021;7:1380–1390. doi: 10.1016/j.euf.2020.06.024. - DOI - PMC - PubMed

Publication types

Substances