. 2022 Jul 30;11(15):2348.
doi: 10.3390/cells11152348.

Neuroinflammatory Gene Expression Analysis Reveals Pathways of Interest as Potential Targets to Improve the Recording Performance of Intracortical Microelectrodes

Affiliations

Neuroinflammatory Gene Expression Analysis Reveals Pathways of Interest as Potential Targets to Improve the Recording Performance of Intracortical Microelectrodes

Sydney Song et al. Cells. .

Abstract

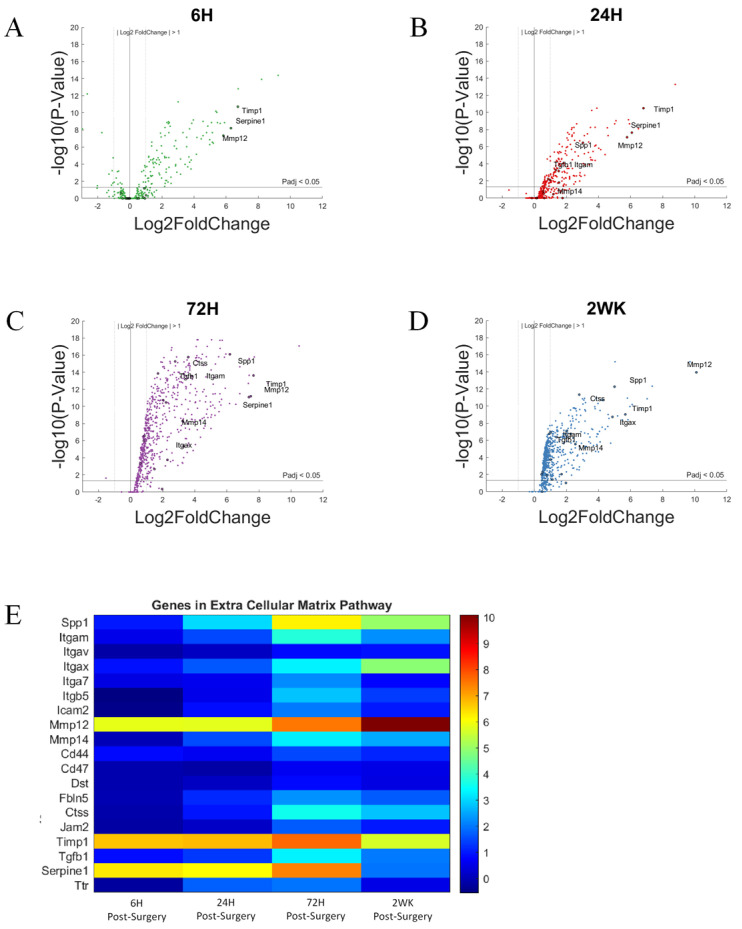
Intracortical microelectrodes are a critical component of brain-machine interface (BMI) systems. The recording performance of intracortical microelectrodes used for both basic neuroscience research and clinical applications of BMIs decreases over time, limiting the utility of the devices. The neuroinflammatory response to the microelectrode has been identified as a significant contributing factor to its performance. Traditionally, pathological assessment has been limited to a dozen or so known neuroinflammatory proteins, and only a few groups have begun to explore changes in gene expression following microelectrode implantation. Our initial characterization of gene expression profiles of the neuroinflammatory response to mice implanted with non-functional intracortical probes revealed many upregulated genes that could inform future therapeutic targets. Emphasis was placed on the most significant gene expression changes and genes involved in multiple innate immune sets, including Cd14, C3, Itgam, and Irak4. In previous studies, inhibition of Cluster of Differentiation 14 (Cd14) improved microelectrode performance for up to two weeks after electrode implantation, suggesting CD14 can be explored as a potential therapeutic target. However, all measures of improvements in signal quality and electrode performance lost statistical significance after two weeks. Therefore, the current study investigated the expression of genes in the neuroinflammatory pathway at the tissue-microelectrode interface in Cd14-/- mice to understand better how Cd14 inhibition was connected to temporary improvements in recording quality over the initial 2-weeks post-surgery, allowing for the identification of potential co-therapeutic targets that may work synergistically with or after CD14 inhibition to improve microelectrode performance.

Keywords: Toll-like receptors; cluster of differentiation 14; complement; cytokine; extracellular matrix; inflammation; microelectrode.


Conflict of interest statement

The authors declare no conflict of interest.

Figures

Figure 1
Figure 1
Heat map and principal component analysis. (A) Heatmap of gene expression after normalization and log2 transformation. (B) principal Component Analysis of normalized log2 transformed data. PC1—PC4 is displayed, and sample groups are marked. The first 4 Principal Component axes account for a total of 55.7% variation in the data. Specifically, PC1 accounts for 30.7% of the variation in data, PC2 accounts for 10.7% of the variation in data, PC3 accounts for 8.4% of the variation in data, and PC4 accounts for 4.9% of the variation in data. New samples are predicted to fall within the elliptical with a probability of 0.95. Orange (open circles) = NSCTR; Green (triangles) = 6-h; Red (circles) = 24-h; Purple (diamonds) = 72-h; and Blue (squares) = 2-week.
Figure 2
Figure 2
Venn diagram of the number of genes showing altered expression post-surgery compared to Non-Surgical Control (NSCTR). Only genes above the expression threshold of 25 counts in over 85% of the samples are included. (log2foldchange > 1 or <−1, Padj < 0.05). Overlapping points on the diagram (blended color) indicate the same genes demonstrating altered expression across both time points.
Figure 3
Figure 3
Differential expression of gene set involved in the complement pathway compared to NSCTR mice: (AD) volcano plot with genes in the complement pathway shown in black circles. Top 10 genes by differential expression level and Padj < 0.05 are labeled. Each time point post-surgery is on a separate volcano plot. (A) =6-h, (B) =24-h, (C) =72-h, and (D) =2-weeks. Color in (AD) corresponds to time post-surgery color coding in other figures. (E) heatmap showing differential expressions of genes of the complement system at each time point post-surgery compared to NSCTR.
Figure 4
Figure 4
Differential expression of specific genes involved in the complement pathway compared to NSCTR mice: Top differentially expressed genes for the complement pathway displayed as bar graphs of individual genes as a function of time post-surgery (AI). For each time point, gene expression levels are compared to the NSCTR mice. Error bars indicate the standard error of the mean between NSCTR and each time point. Asterisks indicate that Padj < 0.05. Note (D), which depicts the upregulation of C3, has a y-axis log2foldchange scale of −1 to 10, because of its high upregulation.
Figure 5
Figure 5
Differential expression of gene set involved in the pattern recognition system compared to NSCTR mice: (A) volcano plot with genes in the PRR pathway are shown in black. Genes in the pattern recognition system with Padj < 0.05 and log2foldchange > 1 or <−1 are labeled. Each time point post-surgery is on a separate volcano plot. (A) =6-h, (B) =24-h, (C) =72-h, and (D) =2-weeks. Color in (AD) corresponds to time post-surgery color coding in other figures. (E) heatmap showing differential expressions of genes of the chemokine system at each time point post-surgery compared to NSCTR.
Figure 6
Figure 6
Differential expression of specific genes in the pattern recognition receptor family compared to NSCTR mice: All genes for the pattern recognition receptor except Toll-like receptors, which will be described in Figure 8. Gene set displayed as bar graphs of individual genes as a function of time post-surgery (AE). For each time point, gene expression levels are compared to the NSCTR mice. Error bars indicate the standard error of the mean between NSCTR and each time point. Asterisks indicate that Padj < 0.05.
Figure 7
Figure 7
Differential expression of gene set involved in the Toll-like receptor pathway compared to NSCTR mice: (A) volcano plot with genes in the TLR group shown in black circles. Top 10 genes by differential expression level and Padj < 0.05 are labeled. Each time point post-surgery is on a separate volcano plot. (A) =6-h, (B) =24-h, (C) =72-h, and (D) =2-weeks. Color in (AD) corresponds to time post-surgery color coding in other figures. (E) heatmap showing differential expressions of genes of the TLR system at each time point post-surgery compared to NSCTR.
Figure 8
Figure 8
Differential expression of specific genes involved in the Toll-like receptor pathway compared to NSCTR mice: Bar graph of selected genes in the Toll-like Receptor’s pathway (AK), alterations in expression are displayed as bar graphs of individual genes as a function of time post-surgery. For each time point, gene expression levels are compared to the NSCTR mice. Error bars indicate the standard error of the mean between NSCTR and each time point. Asterisks indicate that Padj < 0.05. Note (C), depicting the upregulation of Cd36, has a y-axis log2foldchange scale of −1 to 10, because of its high upregulation.
Figure 9
Figure 9
Differential expression of gene set involved in cytokine response compared to NSCTR mice: (AD) volcano plot with genes in the cytokine system shown in black. Top 10 genes by differential expression level and Padj < 0.05 are labeled. Each time point post-surgery is on a separate volcano plot. (A) =6-h, (B) =24-h, (C) =72-h, and (D) =2-weeks. Color in (AD) corresponds to time post-surgery color coding in other figures. (E) heatmap showing differential expressions of genes of the cytokine system at each time point post-surgery compared to NSCTR.
Figure 10
Figure 10
Differential expression of specific genes involved in the cytokine pathway compared to NSCTR mice: (AL) Top differentially expressed genes for the cytokine gene set displayed as bar graphs of individual genes as a function of time post-surgery. For each time point, gene expression levels are compared to the NSCTR mice. (MO) bar graph for TGF signaling pathways, which may be important for wound healing deemed important in the cytokine pathway. Error bars indicate the standard error of the mean between NSCTR and each time point. Asterisks indicate that Padj < 0.05.
Figure 11
Figure 11
Differential expression of gene set involved in chemokine response compared to NSCTR mice: (AD) volcano plot with genes in the chemokine system in black. Genes in the chemokine response system with Padj < 0.05 and log2foldchange > 1 or <−1 are labeled. Each time point post-surgery is on a separate volcano plot. (A) =6-h, (B) =24-h, (C) =72-h, and (D) =2-weeks. Color in (AD) corresponds to time post-surgery color coding in other figures. (E) heatmap showing differential expressions of genes of the chemokine system at each time point post-surgery compared to NSCTR.
Figure 12
Figure 12
Differential expression of specific genes involved in the chemokine pathway compared to NSCTR mice: (AJ) Top differentially expressed genes for the chemokine gene set displayed as bar graphs of individual genes as a function of time post-surgery. For each time point, gene expression levels are compared to the NSCTR mice. Error bars indicate the standard error of the mean between NSCTR and each time point. Asterisks indicate that Padj < 0.05. Note (A,B,H), which depicts the upregulation of Ccl2, Ccl3, and Cxcl10, respectively, has a y-axis log2foldchange scale of −1 to 10, because of their high upregulation.
Figure 13
Figure 13
Differential expression of gene set involved in the extracellular matrix group compared to NSCTR mice: (AD) volcano plot with genes in the extracellular matrix group in black. Top 10 genes by differential expression level and Padj < 0.05. are labeled. Each time point post-surgery is on a separate volcano plot. (A) =6-h, (B) =24-h, (C) =72-h, and (D) =2-weeks. Color in (AD) corresponds to time post-surgery color coding in other figures. (E) heatmap showing differential expressions of genes of the extracellular matrix group at each time point post-surgery compared to NSCTR.
Figure 14
Figure 14
Differential expression of specific genes involved in the extracellular matrix pathway compared to NSCTR mice (AF) Top differentially expressed genes for the extracellular matrix gene set displayed as bar graphs of individual genes as a function of time post-surgery. For each time point, gene expression levels are compared to the NSCTR mice. Error bars indicate the standard error of the mean between NSCTR and each time point. Asterisks indicate that Padj < 0.05. Note (A,D,E,F) which depicts the upregulation of Spp1, Mmp12, Timp1, and Serpine1, respectively, has a y-axis log2foldchange scale of −1 to 10, because of their high upregulation.

Similar articles

Cited by

References

    1. Donoghue J. Bridging the Brain to the World: A Perspective on Neural Interface Systems. Neuron. 2008;60:511–521. doi: 10.1016/j.neuron.2008.10.037. - DOI - PubMed
    1. Nicolelis M.A. Brain-machine interfaces to restore motor function and probe neural circuits. Nat. Rev. Neurosci. 2003;4:417–422. doi: 10.1038/nrn1105. - DOI - PubMed
    1. Schwartz A.B. Cortical neural prosthetics. Annu. Rev. Neurosci. 2004;27:487–507. doi: 10.1146/annurev.neuro.27.070203.144233. - DOI - PubMed
    1. Hubel D.H. Single unit activity in striate cortex of unrestrained cats. J. Physiol. 1959;147:226–238. doi: 10.1113/jphysiol.1959.sp006238. - DOI - PMC - PubMed
    1. Yuste R. From the neuron doctrine to neural networks. Nat. Rev. Neurosci. 2015;16:487–497. doi: 10.1038/nrn3962. - DOI - PubMed

Publication types

LinkOut - more resources