. 2022 Jul 30;11(15):2349.
doi: 10.3390/cells11152349.

Piezo1 Channel Activation Reverses Pulmonary Artery Vasoconstriction in an Early Rat Model of Pulmonary Hypertension: The Role of Ca2+ Influx and Akt-eNOS Pathway

Affiliations

Piezo1 Channel Activation Reverses Pulmonary Artery Vasoconstriction in an Early Rat Model of Pulmonary Hypertension: The Role of Ca2+ Influx and Akt-eNOS Pathway

Thais Porto Ribeiro et al. Cells. .

Abstract

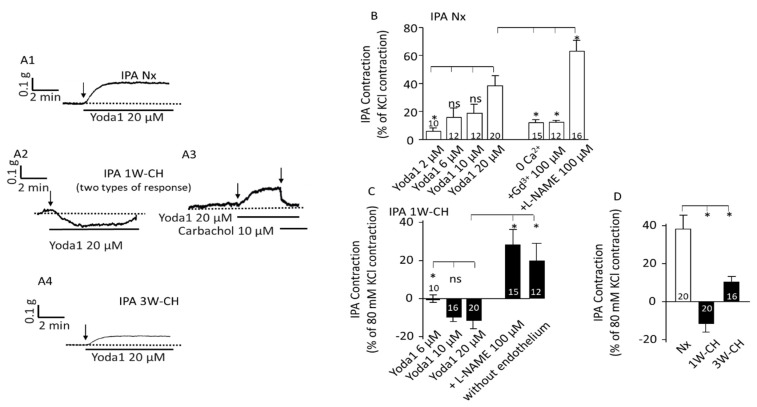
In intrapulmonary arteries (IPAs), mechanical forces due to blood flow control vessel tone, and these forces change during pulmonary hypertension (PH). Piezo1, a stretch-activated calcium channel, is a sensor of mechanical stress present in both endothelial cells (ECs) and smooth muscle cells (SMCs). The present study investigated the role of Piezo1 on IPA in the chronic hypoxia model of PH. Rats were raised in chronically hypoxic conditions for 1 (1W-CH, early stage) or 3 weeks (3W-CH, late-stage) of PH or in normoxic conditions (Nx). Immunofluorescence labeling and patch-clamping revealed the presence of Piezo1 in both ECs and SMCs. The Piezo1 agonist, Yoda1, induced an IPA contraction in Nx and 3W-CH. Conversely, Yoda1 induced an endothelial nitric oxide (eNOS) dependent relaxation in 1W-CH. In ECs, the Yoda1-mediated intracellular calcium concentration ([Ca2+]i) increase was greater in 1W-CH as compared to Nx. Yoda1 induced an EC hyperpolarization in 1W-CH. The eNOS levels were increased in 1W-CH IPA compared to Nx or 3W-CH PH and Yoda1 activated phosphorylation of Akt (Ser473) and eNOS (Ser1177). Thus, we demonstrated that endothelial Piezo1 contributes to intrapulmonary vascular relaxation by controlling endothelial [Ca2+]i, endothelial-dependent hyperpolarization, and Akt-eNOS pathway activation in the early stage of PH.

Keywords: Akt; Piezo channels; calcium signaling; eNOS; pulmonary artery.


Conflict of interest statement

The authors declare no conflict of interest.

Figures

Figure 1
Figure 1
Increase in mean pulmonary artery pressure (mPAP) and RV hypertrophy. (A) Fulton index, a cardiac PH marker in normoxic (Nx) or in CH conditions. n = 20. (B) Pressure (mean pulmonary artery pressure) increased in CH condition, regardless of time. (*) p  <  0.05; (ns) p > 0.05.
Figure 2
Figure 2
Piezo1 channels are expressed in PAECs and PASMCs in an early stage of CH-PH. PASMCs and PAECs expressed Piezo1 channels. (A) Immunostaining on thin transversal section: the endothelial layer (EC) and the media (smooth muscle cell, SMC) of IPA expressed Piezo1 (A1) without primary antibody, (A2) Nx IPA, (A3) 1W-CH IPA; elastic lamina in green separates media from intima. (B) PAECs were observed in the en face configuration in (B1) Nx IPA or (B2) 1W-CH IPA. (C) PASMCs were observed in the en face configuration in Nx IPA; note that SMC nuclei had a characteristic shape (elongated) as compared to EC nuclei. Red = antibody against Piezo1; blue = nucleus.
Figure 3
Figure 3
Piezo1 activation changes vascular tone response in IPA. Piezo1 contracted Nx IPA, but relaxed 1W-CH IPA. (A) A typical trace of IPA tension was recorded in the presence of Yoda1 in Nx (A1), 1W-CH (A2,A3), and 3W-CH (A4) conditions. For 1W-CH, two types of responses could be observed: a relaxation (A2) or a contraction (A3). In (A3), the application of carbachol (endothelial M3 agonist) induces a relaxation showing a functional endothelium. (B) Statistical analysis of the contraction induced by Yoda1 (2–20 μM) in Nx IPA. The Yoda1 (20 µM)-induced contraction was inhibited, in absence of extracellular calcium (0 Ca2+), by GdCl3 (Gd3+, 100 µM) and amplified in the presence of L-NAME (100 µM). (C) Amplitude of the Yoda1-mediated relaxation in 1W-CH. In the presence of L-NAME (100 µM) or mechanical abrasion of the endothelium, the relaxation induced by 20 µM Yoda1 was reversed to a contraction. (D) Comparison of the effect of 20 µM Yoda1 in Nx, 1W-CH, or 3W-CH IPA. * p  <  0.05. The number inserted in the bar graph represented the number of arterial rings analyzed. The vertical arrow represents the beginning of the drug’s application. ns = not significant. A minimum of four different rats, at least four rings per rat were used.
Figure 4
Figure 4
Piezo1 activation relaxes pre-contracted IPA from the early stage of PH. On pre-contracted IPA (phenylephrine 0.1 µM), Piezo1 contracted Nx IPA but relaxed 1W-CH IPA. (A) Typical trace of IPA tension recorded in the presence of Yoda1 on Nx (A1), 1W-CH (A2), or 3W-CH (A3). For Nx IPA, application of carbachol induced a relaxation, indicating a functional endothelium. For 1W-CH IPA, direct application of L-NAME (100 µM) converted the relaxation to a contraction, pointing out the importance of EC Piezo1 in the release of NO. Following 3W-CH, note the biphasic response (relaxation then contraction). (B) Statistical analysis of the contraction induced by Yoda1 (2–20 μM) in Nx IPA. (C) Amplitude of the Yoda1-mediated relaxation in 1W-CH pre-contracted IPA. In the presence of L-NAME (100 µM), Yoda1 induced a contraction instead of relaxation. (D) Effect of 20 µM Yoda1 in 3W-CH IPA (amplitude of the relaxation then contraction). * p  <  0.05. The number inserted in the bar graph represents the number of arterial rings analyzed. Vertical arrow represents the beginning of the drugs’ application. ns = not significant. Minimum four different rats, at least four rings per rat were used.
Figure 5
Figure 5
PAEC and PASMC Piezo1 current in an early stage of CH-PH. Yoda1 induced current activation through Piezo1 channels in PAECs and PASMCs. (A) Typical current induced by Yoda1 (10 µM) on PAECs (holding potential −65 mV, ramp depolarization up to 65 mV). (B) Yoda1 induced a greater inward current in 1W-CH PAECs as compared to Nx PAECs at the potential of -65 mV. * p  <  0.05. (C) Typical current induced by Yoda1 (10 µM) on PASMCs (holding potential −65 mV, ramp depolarization up to 65 mV). (D) Yoda1 induced the same inward current in 1W-CH PASMCs and Nx PASMCs at the potential of -65 mV. Each point represented a cell.
Figure 6
Figure 6
PAEC and PASMC Piezo1 current in an early stage of CH-PH. Piezo1 activation increased intracellular calcium concentration ([Ca2+]i) in both PAECs and PASMCs. (A1) Yoda1 (20 μM) induced a sustained increase in Cal520 fluorescence in isolated PAECs from 1W-CH IPA that was reduced in presence of thapsigargin (2 µM) or in absence of extracellular calcium (0 Ca2+). (A2) Typical trace of calcium increase recorded in the presence of Yoda1 in Nx PASMCs that was reduced in presence of thapsigargin (2 µM) or in absence of extracellular calcium (0 Ca2+). (B) Statistical analysis of the [Ca2+]i increase induced by Yoda1 (20 μM) in ECs from Nx and 1W-CH IPA (n represents the number of analyzed cells, five different rats at least). Absence of extracellular calcium (0 Ca2+), presence of GdCl3 (Gd3+, 100 µM), or thapsigargin (2 µM) inhibited the response. (C) Statistical analysis of the [Ca2+]i increase induced by ACh (10 μM) in PAECs from Nx and 1W-CH IPA. (D) Statistical analysis of the [Ca2+]i increase induced by Yoda1 (20 μM) in PASMCs from Nx and 1W-CH IPA. The absence of extracellular calcium (0 Ca2+), presence of GdCl3 (Gd3+, 100 µM), or thapsigargin (2 µM) inhibited the response, whereas nicardipine (1 μM; L-type voltage-gated calcium channel inhibitor) did not blunt the response. * p  <  0.05. n represented the number of analyzed cells, five different rats at least.
Figure 7
Figure 7
Yoda1 induced hyperpolarization of the transmembrane potential in PAECs. Piezo1 activation changed transmembrane potential. (A) Typical traces of the FLIPR fluorescence were recorded in freshly isolated vascular cells stimulated with Yoda1 (20 μM) (black line). Dash lines represent [Ca2+]i increase recorded simultaneously with the Cal520 fluorescent probe. Yoda1 (A1) hyperpolarized PAECs. This hyperpolarization was reduced by the application of apamin (1 mM), then apamin plus TEA (2 mM), and inhibitors of calcium-dependent potassium channels (A2). By contrast, Yoda1 depolarized PASMCs (A3) or could sometimes have a biphasic response (A4). (B) Statistical analysis of the membrane potential variation induced by Yoda1 (20 μM) in freshly isolated PAECs from Nx and 1W-CH IPA. The decrease in FLIRP fluorescence in the presence of Yoda1 was reversed by the combination of apamin (1 µM) plus TEA (2 mM). (C) Statistical analysis of the membrane potential variation induced by Yoda1 (20 μM) in freshly isolated PASMCs from Nx and 1W-CH IPA. As the control, KCl solution (80 mM) was applied to measure strong depolarization. For statistical analysis, antagonists (apamin and TEA) were preincubated before Yoda1 application and not after, as for Figure 2A. * p  <  0.05. n represented the number of analyzed cells, five different rats at least.
Figure 8
Figure 8
Piezo1 activation induces phosphorylation of the Akt-eNOS pathway in IPA. Effect of chronic hypoxia on expression and phosphorylation of Akt-eNOS pathway in IPA. (A1) Representative images of total eNOS, and phospho-eNOS in IPA from rats exposed to Nx or 1W-CH (early stage CH-PH) or 3W-CH (later stage). (A2) Graphs showed quantified relative signal intensity normalized (% of control, Nx) to total protein staining in IPA from rats exposed to Nx or 1W-CH or 3W-CH. The eNOS phosphorylation of Ser1177 (A3) or Thr497 (A4) was analyzed and compared to eNOS total levels under the same conditions. (B) Yoda1 led to the activation of eNOS by phosphorylation at Ser1177 in IPA from Nx or 1W-CH. (B1) Representative image of peNOS, (B2) graphs show data for statistical analysis. (C) Akt total levels were increased in 1W-CH PH in comparison to Nx. In addition, Yoda1 increased Akt phosphorylation at Ser473 in all experimental conditions. (C1) Representative image of total Akt and pAkt. (C2) Graphs from Akt quantified relative signal intensity normalized (% of control, Nx) to total protein staining and (C3) pAkt was compared to Akt total levels. Results are expressed as mean ± SEM from four (Western blotting) experiments. * p < 0.05 compared to Nx and # p < 0.05 compared to 1W-CH.

References

    1. Simonneau G., Montani D., Celermajer D., Denton C.P., Gatzoulis M.A., Krowka M., Williams P.G., Souza R. Haemodynamic definitions and updated clinical classification of pulmonary hypertension. Eur. Respir. J. 2019;53:1801913. doi: 10.1183/13993003.01913-2018. - DOI - PMC - PubMed
    1. Freund-Michel V., Guibert C., Dubois M., Courtois A., Marthan R., Savineau J.-P., Muller B. Reactive oxygen species as therapeutic targets in pulmonary hypertension. Ther. Adv. Respir. Dis. 2013;7:175–200. doi: 10.1177/1753465812472940. - DOI - PubMed
    1. Condon D., Nickel N.P., Anderson R., Mirza S., Perez V.A.D.J. The 6th World Symposium on Pulmonary Hypertension: What’s old is new. F1000Research. 2019;8:888. doi: 10.12688/f1000research.18811.1. - DOI - PMC - PubMed
    1. Fessart D., Martin-Negrier M.-L., Claverol S., Thiolat M.-L., Crevel H., Toussaint C., Bonneu M., Muller B., Savineau J.-P., Delom F. Proteomic remodeling of proteasome in right heart failure. J. Mol. Cell. Cardiol. 2014;66:41–52. doi: 10.1016/j.yjmcc.2013.10.015. - DOI - PubMed
    1. Bonnet S., Dumas-De-La-Roque E., Bégueret H., Marthan R., Fayon M., Dos Santos P., Savineau J.-P., Baulieu E.-E. Dehydroepiandrosterone (DHEA) prevents and reverses chronic hypoxic pulmonary hypertension. Proc. Natl. Acad. Sci. USA. 2003;100:9488–9493. doi: 10.1073/pnas.1633724100. - DOI - PMC - PubMed