. 2022 Aug 2;11(15):2369.
doi: 10.3390/cells11152369.

Rewiring of Glucose and Lipid Metabolism Induced by G Protein-Coupled Receptor 17 Silencing Enables the Transition of Oligodendrocyte Progenitors to Myelinating Cells

Affiliations

Rewiring of Glucose and Lipid Metabolism Induced by G Protein-Coupled Receptor 17 Silencing Enables the Transition of Oligodendrocyte Progenitors to Myelinating Cells

Davide Marangon et al. Cells. .

Abstract

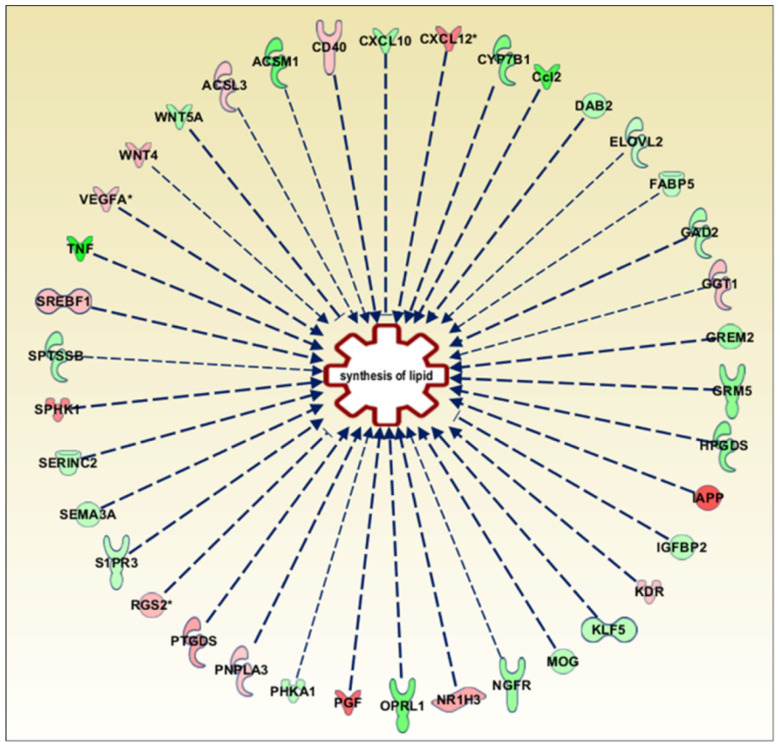
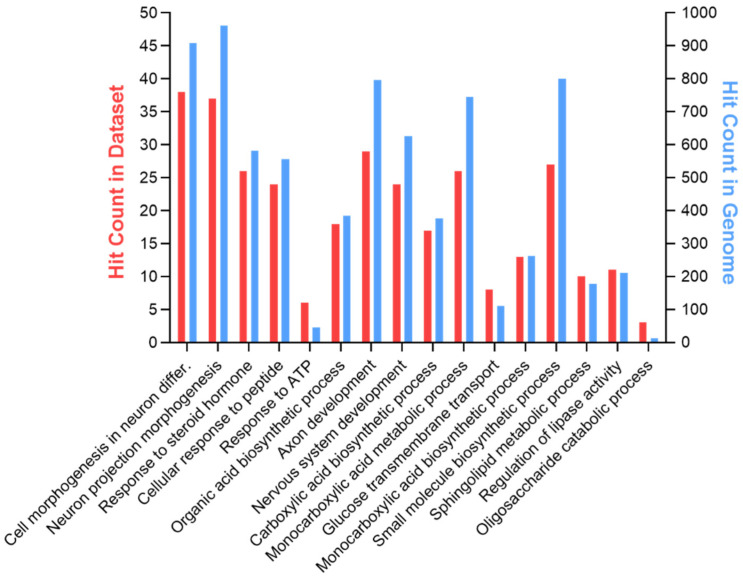
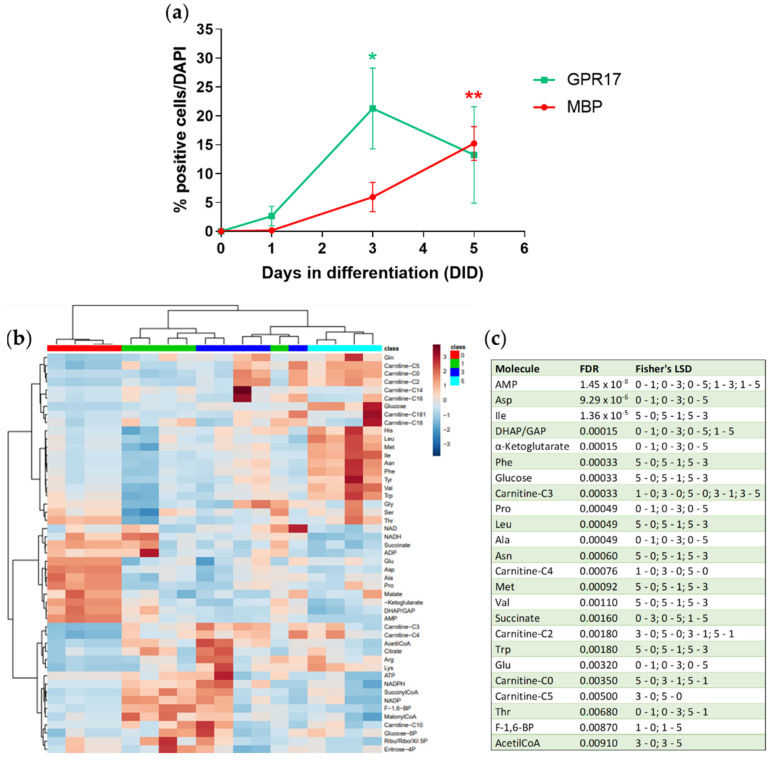
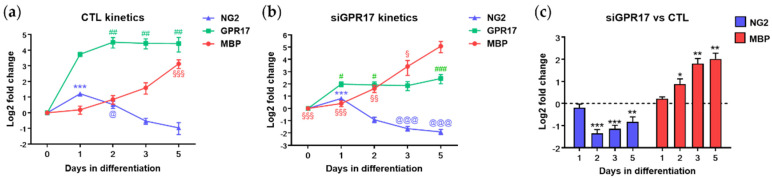
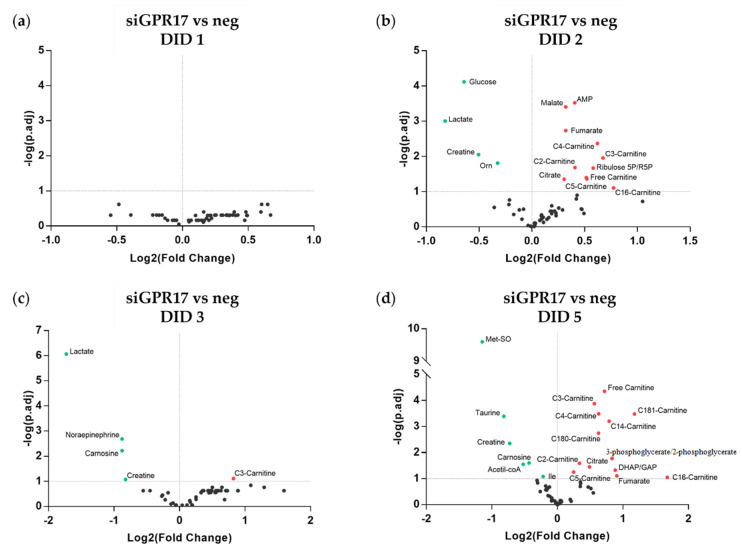
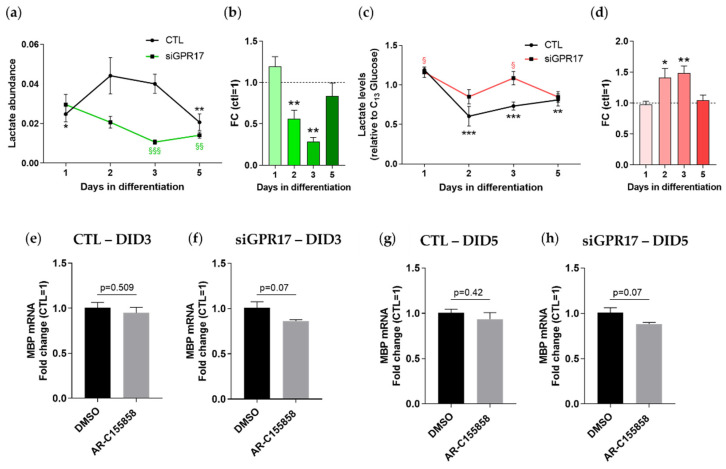
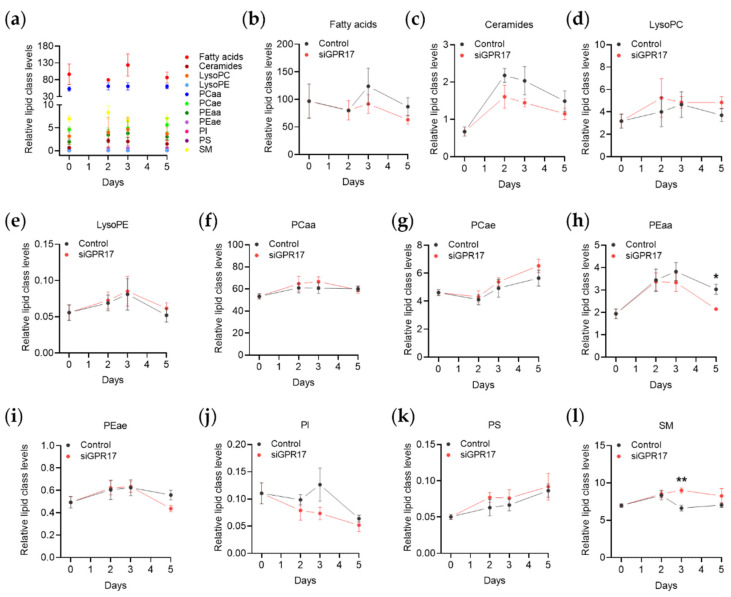
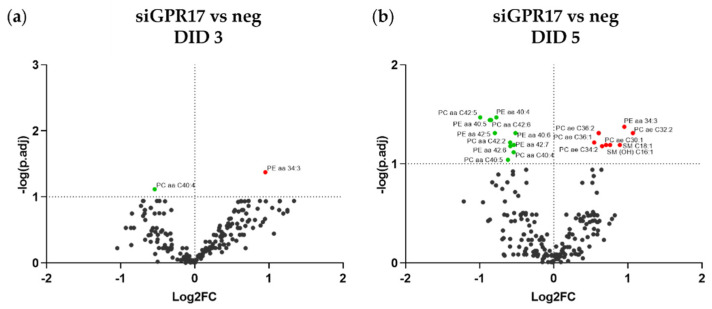
In the mature central nervous system (CNS), oligodendrocytes (OLs) provide support and insulation to axons thanks to the production of a myelin sheath. During their maturation to myelinating cells, OLs require energy and building blocks for lipids, which implies a great investment of energy fuels and molecular sources of carbon. The oligodendroglial G protein-coupled receptor 17 (GPR17) has emerged as a key player in OL maturation; it reaches maximal expression in pre-OLs, but then it has to be internalized to allow terminal maturation. In this study, we aim at elucidating the role of physiological GPR17 downregulation in OL metabolism by applying transcriptomics, metabolomics and lipidomics on differentiating OLs. After GPR17 silencing, we found a significant increase in mature OL markers and alteration of several genes involved in glucose metabolism and lipid biosynthesis. We also observed an increased release of lactate, which is partially responsible for the maturation boost induced by GPR17 downregulation. Concomitantly, GPR17 depletion also changed the kinetics of specific myelin lipid classes. Globally, this study unveils a functional link between GPR17 expression, lactate release and myelin composition, and suggests that innovative interventions targeting GPR17 may help to foster endogenous myelination in demyelinating diseases.

Keywords: energy metabolism; glycolysis; lactate; lipidomics; metabolomics; myelin lipids; myelination; oligodendrocyte; oligodendrocyte progenitor cell; transcriptomics.


Conflict of interest statement

The authors declare no conflict of interest. The funders had no role in the design of the study; in the collection, analyses, or interpretation of data; in the writing of the manuscript, or in the decision to publish the results.

Figures

Figure 1
Figure 1
Ingenuity pathway analysis tool (IPA, Qiagen) was used to analyse dataset and explore the diseases and biological processes which are predicted to be increasing or decreasing based on the pattern of differentially expressed genes in the dataset. From this analysis we extrapolated the scheme in the Figure that includes the genes related to lipid synthesis differentially expressed in our dataset (p-value = 9.67 × 10⁻⁴). The full names of these genes, together with the relative fold change (log2 ratio) are reported in Table S1. In red, upregulated genes; in green, downregulated genes.
Figure 2
Figure 2
The Toppgene suite has been used to perform a GO-based enrichment analysis on the DEGs. The picture shows some of the significant biological processes related to the central nervous system and cell metabolism potentially altered by GPR17 silencing. Blue bars indicate the total genes associated to each term; red bars indicate the genes in common with our dataset for each term. The complete list of biological processes resulting from this analysis and the relative p-values are reported in Table S2.
Figure 3
Figure 3
(a) The graph shows changes in the percentage of GPR17+ and MBP+ cells during differentiation. n = 3 per group; one-way ANOVA with Tukey’s test. * p < 0.05, ** p < 0.01) (b) The heatmap shows metabolite abundance in each single sample stopped at 0, 1, 3 or 5 DID. The abundance of the analyzed metabolites is represented by a chromatic scale ranging from dark blue (very low abundance) to dark brown (very high abundance). n = 4–5 per each group. (c) Metabolites with an abundance significantly different among the conditions (0, 1, 3 and 5 days in differentiation, DID; one-way ANOVA with Fisher’s LSD test).
Figure 4
Figure 4
Effect of GPR17 silencing on OPC maturation. The expression levels of GPR17 (green), NG2 (blue) and MBP (red) were evaluated by real-time PCR during differentiation in control conditions (a), cells transfected with scramble RNA and after GPR17 silencing (b), and normalized versus expression at T0 (set to 0). n = 6 per each time point. One-way ANOVA with Tukey’s multiple comparisons test. (a): *** p < 0.001 vs. DID 0-2-3-5, @ p < 0.05 vs. DID 3-5; ## p < 0.01 vs. day 0; §§§ p < 0.001 vs. DID 0-1-2-3; (b): *** p < 0.001 vs. DID 0-2-3-5, @@@ p < 0.001 vs. day 0, # p < 0.05, ### p < 0.001 vs. day 0, § p < 0.05, §§ p < 0.01, §§§ p < 0.001 vs. DID 5. (c) NG2 and MBP expression in GPR17-silenced OPCs vs. control OPCs (set to 0) at each time point. Fold change (FC) has been reported as LOG2(FC). One sample t-test, * p < 0.05; ** p < 0.01; *** p < 0.001 vs. relative DID in control OPCs.
Figure 5
Figure 5
Metabolomic changes induced by GPR17 silencing in OPCs. (ad) The abundance of each metabolite after GPR17 silencing has been normalized to that in the relative control sample. The resulting fold changes were used to generate a volcano plot for each time point (1, 2, 3, 5 days in differentiation). The points over the dotted horizontal line represent the metabolites that have shown a statistically significant change (Fisher’s LSD corrected by FDR; p.adj < 0.1). In green, metabolites with lower expression, in red, those with higher expression, after GPR17 silencing. n = 7–9 per each group. DID: days in differentiation.
Figure 6
Figure 6
GPR17 silencing in OPCs alters lactate metabolism. (a) Lactate abundance during OPC maturation in control conditions (green line) and after GPR17 silencing (orange line). n = 7–9 per each group. One-way ANOVA with Tukey’s multiple comparisons test. * p < 0.05, ** p < 0.01 vs. DID2 CTL; §§ p < 0.01, §§§ p < 0.001 vs. DID1 siGPR17 (b) Lactate levels after GPR17 silencing were normalized versus control samples (set to 1) at each time point (n = 7–9). ** p < 0.01; one sample t-test. Conditioned media from GPR17-silenced and control OPCs were collected from the same culture used for metabolomic analysis. Lactate levels in the media were evaluated by LC-MS/MS. (c) Abundance of lactate in the extracellular space during OPC maturation in control conditions (green line) and after GPR17 silencing (orange line). One-way ANOVA with Tukey’s multiple comparisons test. ** p < 0.01, *** p < 0.001 vs. DID1 CTL; § p < 0.05 vs. DID5 siGPR17. (d) Extracellular lactate levels after GPR17 silencing were normalized versus control samples (set to 1) at each time point. * p < 0.05; ** p < 0.01; one sample t-test. The effect of MCT1 inhibition in control (e,g) and GPR17-silenced (f,h) OPCs has been evaluated by analyzing the expression of MBP, in inhibitor-treated samples vs. relative controls (vehicle treated), at at 3 and 5 days of differentiation. n = 6 per each group.
Figure 7
Figure 7
Changes in lipidic classes abundance induced by GPR17 silencing during OPC differentiation. The abundance of each lipid class in control conditions at different time points is reported (a). The kinetics of each lipid class after GPR17 silencing were analysed: (b) fatty acids, (c) ceramides, (d) LysoPC (lysophosphatidyl-cholines), (e) LysoPE (lysophosphatidyl-ethanolamines), (f) PCaa (diacyl-phosphatidyl-cholines), (g) PCae (acyl-alkyl-phosphatidyl-cholines), (h) PEaa (di-acyl-phosphatidyl-ethanolamines), (i) PEae (acyl-alkyl-phosphatidyl-ethanolamines), (j) PI (phosphatidyl-inositols), (k) PS (phosphatidyl-serines), (l) SM (sphingomyelins). n = 5 for each group. Kinetics: Two-way ANOVA followed by Tukey’s multiple comparison test. siGPR17: Two-way ANOVA followed by Sidak’s multiple comparison test. * p.adj < 0.05; ** p.adj < 0.01.
Figure 8
Figure 8
Lipidomic changes induced by GPR17 silencing in OPCs. (a,b) The abundance of each lipid after GPR17 silencing has been normalized to that in the relative control sample. The resulting fold changes were used to generate a volcano plot for each time point (3, 5 days in differentiation). The points over the dotted horizontal line represent the metabolites that have shown a statistically significant change (Fisher’s LSD corrected by FDR; p.adj < 0.1). In green, lipids with lower expression, in red, those with higher expression, after GPR17 silencing. n = 5 per each group.

References

    1. Butt A.M., Papanikolaou M., Rivera A. Physiology of Oligodendroglia. Adv. Exp. Med. Biol. 2019;1175:117–128. doi: 10.1007/978-981-13-9913-8_5. - DOI - PubMed
    1. Nave K.A., Werner H.B. Myelination of the nervous system: Mechanisms and functions. Annu. Rev. Cell Dev. Biol. 2014;30:503–533. doi: 10.1146/annurev-cellbio-100913-013101. - DOI - PubMed
    1. Narine M., Colognato H. Current Insights Into Oligodendrocyte Metabolism and Its Power to Sculpt the Myelin Landscape. Front. Cell. Neurosci. 2022;16:892968. doi: 10.3389/fncel.2022.892968. - DOI - PMC - PubMed
    1. Tepavcevic V. Oligodendroglial Energy Metabolism and (re)Myelination. Life. 2021;11:238. doi: 10.3390/life11030238. - DOI - PMC - PubMed
    1. Rao V.T.S., Khan D., Cui Q.L., Fuh S.C., Hossain S., Almazan G., Multhaup G., Healy L.M., Kennedy T.E., Antel J.P. Distinct age and differentiation-state dependent metabolic profiles of oligodendrocytes under optimal and stress conditions. PLoS ONE. 2017;12:e0182372. doi: 10.1371/journal.pone.0182372. - DOI - PMC - PubMed

Publication types