. 2022 Aug 2;11(15):2379.
doi: 10.3390/cells11152379.

Identification, Quantification, and Characterization of HIV-1 Reservoirs in the Human Brain

Affiliations

Identification, Quantification, and Characterization of HIV-1 Reservoirs in the Human Brain

Maribel Donoso et al. Cells. .

Abstract

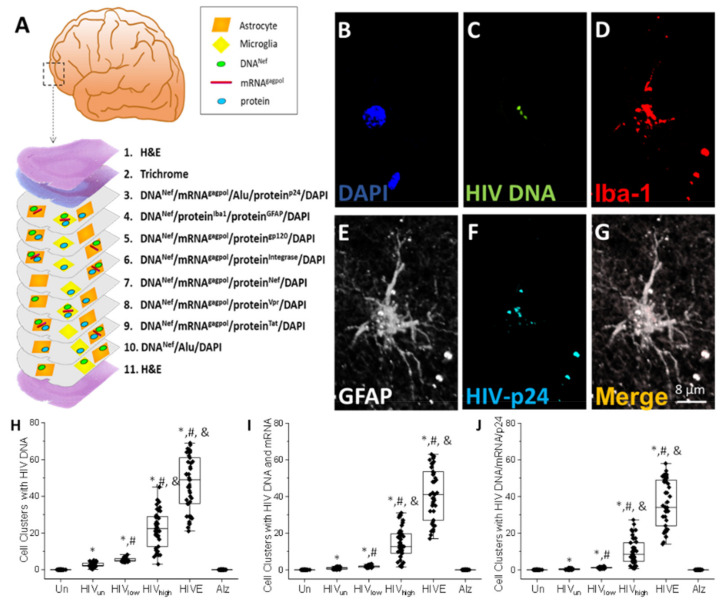
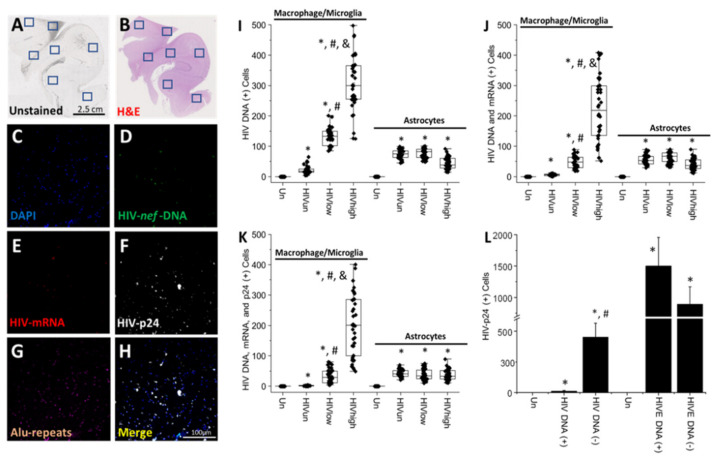
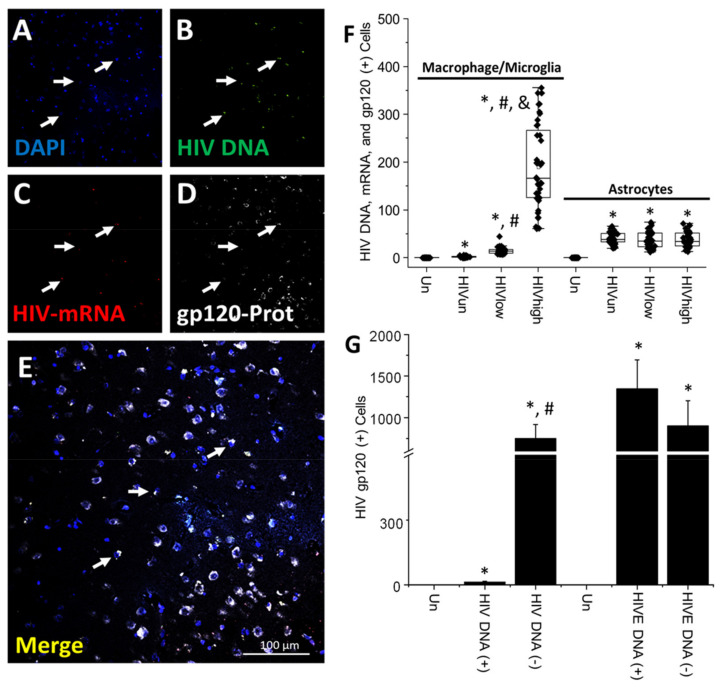
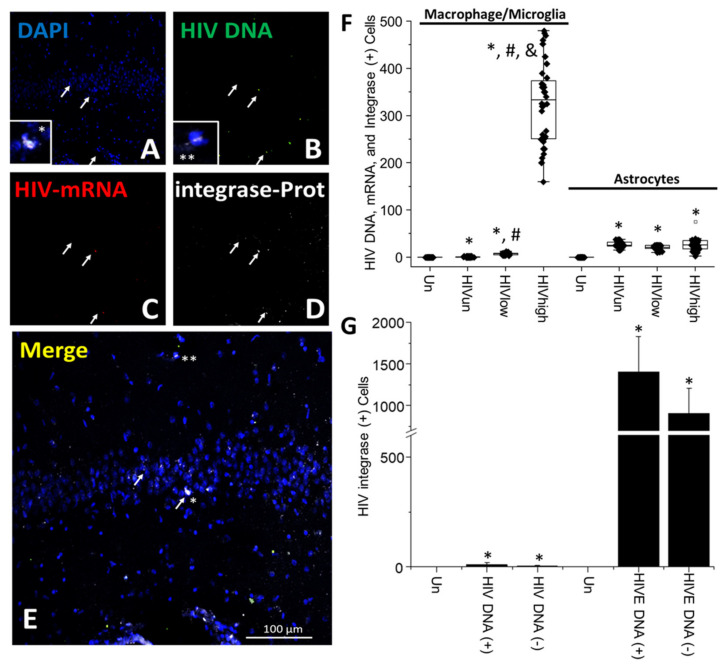
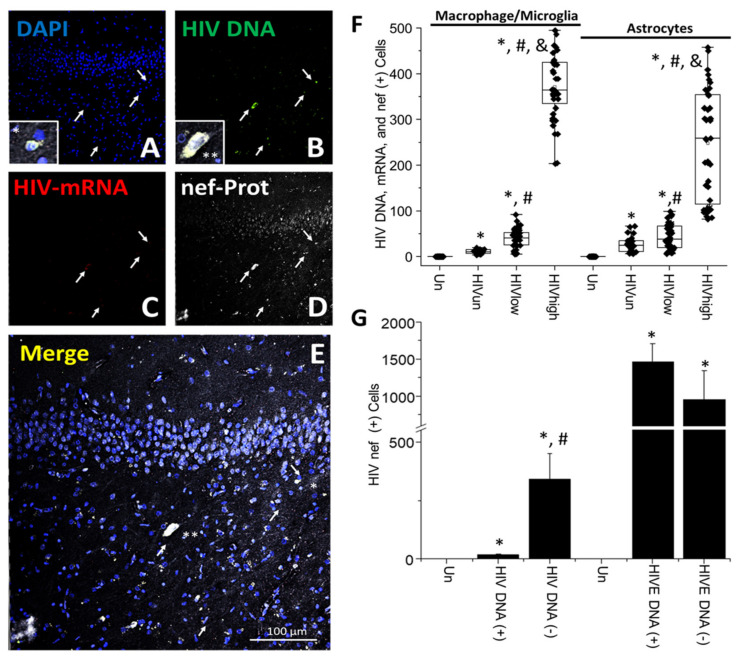
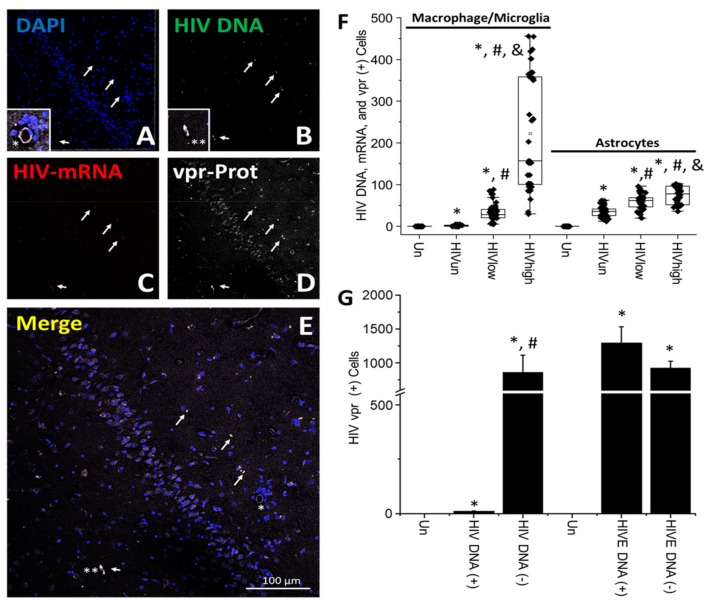
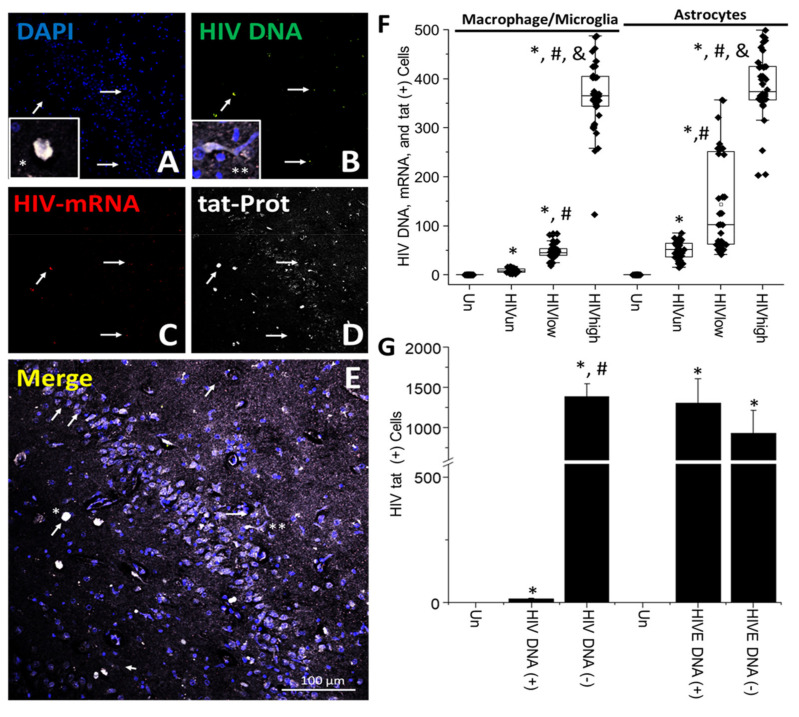
The major barrier to cure HIV infection is the early generation and extended survival of HIV reservoirs in the circulation and tissues. Currently, the techniques used to detect and quantify HIV reservoirs are mostly based on blood-based assays; however, it has become evident that viral reservoirs remain in tissues. Our study describes a novel multi-component imaging method (HIV DNA, mRNA, and viral proteins in the same assay) to identify, quantify, and characterize viral reservoirs in tissues and blood products obtained from HIV-infected individuals even when systemic replication is undetectable. In the human brains of HIV-infected individuals under ART, we identified that microglia/macrophages and a small population of astrocytes are the main cells with integrated HIV DNA. Only half of the cells with integrated HIV DNA expressed viral mRNA, and one-third expressed viral proteins. Surprisingly, we identified residual HIV-p24, gp120, nef, vpr, and tat protein expression and accumulation in uninfected cells around HIV-infected cells suggesting local synthesis, secretion, and bystander uptake. In conclusion, our data show that ART reduces the size of the brain's HIV reservoirs; however, local/chronic viral protein secretion still occurs, indicating that the brain is still a major anatomical target to cure HIV infection.

Keywords: HIV-1; NeuroHIV; anti-retroviral; cure; dementia; reservoirs; survival.


Conflict of interest statement

The authors declare no conflict of interest.

Figures

Figure 1
Figure 1
HIV reservoirs are organized in small clusters within the brain of HIV-infected individuals. (A) The image shows the detection strategy for HIV DNA, viral mRNA, and viral proteins, as well as cellular markers using 11 slice sections per tissue. The first and last sections were stained for H&E; the second section was used for a trichrome stain; the following sections were sequentially stained for DAPI, HIV DNA, HIV-mRNA, HIV protein (p24, gp120, integrase, nef, vpr, or tat), Alu repeats, or markers for astrocytes (GFAP), and microglia/macrophages (Iba-1) as indicated. (BG) Confocal images show a cell cluster labeled with DAPI, containing HIV DNA, positive for microglia/macrophage markers and enlarged astrocytes, indicated by the Iba-1 protein and GFAP, respectively, and expressing HIV-p24 protein cells. Most brain tissue was negative for the viral markers (compared to Supplemental Figure S1). (HJ) Quantification of cell clusters positive for HIV DNA in tissues obtained from uninfected brains (Un), HIV-infected brains with undetectable replication (HIVun), HIV-infected brains with low replication (HIVlow), and HIV-infected brains with high replication (HIVhigh). As a control, we used HIV encephalitic brains (HIVEs) and uninfected cases from healthy and Alzheimer’s individuals, Alz (n = 34 brains analyzed and each point corresponding to the mean of at least 3–5 different quantifications per tissue). (H) Corresponds to the quantification of cell clusters containing HIV DNA in the nucleus (colocalizing with DAPI and Alu repeats). (I) Quantification of double-positive cell clusters for HIV DNA and viral mRNA. (J) Quantification of cell clusters positive for HIV DNA, viral mRNA, and HIV-p24. * p ≤ 0.005 compared to uninfected conditions, # p ≤ 0.005 compared to HIVun conditions, and & p ≤ 0.005 compared to HIVun or HIVlow conditions; n = 34 tissues analyzed, and 21 tissues compared to uninfected tissues, Un and Alz, n = 8 different tissues; each point represents 3–5 different areas per tissue analyzed. Bar: 8 µm.
Figure 2
Figure 2
Quantification of myeloid and glial viral reservoirs in cortical and subcortical human brain areas. Representative confocal images of the areas analyzed for (A) unstained and (B) H&E-stained tissue. Areas detected with HIV DNA are represented in blue boxes. (CH) Representative confocal images of the brain areas containing integrated HIV DNA and positive labeling for (C) DAPI, (D) HIV DNA, (E) HIV-mRNA, (F) HIV-p24, (G) Alu repeats, and (H) the merge of all colors. (IK) Quantification of cells positive for (I) integrated HIV DNA in Macrophage/Microglia (Iba-1-positive cells) and astrocytes (GFAP-positive cells) in human tissues obtained from individuals with undetectable, low, and high systemic replication; * p ≤ 0.005 compared to uninfected conditions, # p ≤ 0.005 compared to HIVun conditions, and & p ≤ 0.005 compared to HIVun or HIVlow conditions; n = 34 tissues analyzed and 21 tissues compared to uninfected tissues, Un and Alz, n = 8 different tissues; each point represents 3–5 different areas per tissue analyzed. Comparisons of the HIV-infected groups by ANOVA are described in the text and Methods Section, (J) integrated HIV DNA and HIV-mRNA in Macrophage/Microglia and astrocytes in human tissues obtained from individuals with undetectable, low, and high systemic replication (* p ≤ 0.005 compared to uninfected conditions and # p ≤ 0.005 compared to HIV conditions, & p ≤ 0.005), (K) integrated HIV DNA, HIV-mRNA, and HIV-p24 in Macrophage/Microglia and astrocytes in human tissues obtained from individuals with undetectable, low, and high systemic replication (* p ≤ 0.005 compared to uninfected conditions, # p ≤ 0.005 compared to HIVun conditions, and & p ≤ 0.005 compared to HIVun or HIVlow conditions; n = 34 tissues analyzed and 21 tissues compared to uninfected tissues, Un and Alz, n = 8 different tissues; each point represents 3–5 different areas per tissue analyzed). (L) Quantification of cells expressing HIV-p24 in HIV and HIVE cells positive for HIV DNA (HIV DNA (+) and HIVE-DNA (+)) and negative for HIV DNA (HIV DNA (−) and HIVE-DNA (−)) (* p ≤ 0.005 compared to uninfected conditions and # p ≤ 0.005 compared to HIV DNA (+) conditions). Bar: 100 µm.
Figure 3
Figure 3
HIV-gp120 protein is expressed in myeloid and glial viral reservoirs and surrounding uninfected cells: potential bystander toxicity under the current ART era. (AE) Representative confocal images showing (A) DAPI staining, (B) HIV DNA, (C) Macrophage/Microglia marker Iba-1 protein, (D) HIV-gp120 protein (arrows denote triple-positive cells), and (E) corresponds to the merging of all colors. (F) Quantified Macrophage/Microglia and astrocyte cells with integrated HIV DNA, producing HIV-mRNA and HIV-gp120 according to the viral replication status, including undetectable, low, and high replication (* p ≤ 0.005 compared to uninfected conditions, # p ≤ 0.005 compared to HIVun conditions, and & p ≤ 0.005 compared to HIVun or HIVlow conditions; n = 34 tissues analyzed and 21 tissues compared to uninfected tissues, Un and Alz, n = 8 different tissues; each point represents 3–5 different areas per tissue analyzed). HIVE total numbers were 1364 ± 279 cells, 876 ± 458 for macrophages, and 624 ± 287 for astrocytes under HIVE conditions (data not plotted). (G) Quantification of cells positive for HIV-gp120 detected in uninfected cells (HIV DNA (−)) surrounding the clusters containing integrated HIV DNA (HIV DNA (+)) corresponded to 750.61 ± 164.85 cells, suggesting bystander damage within the CNS (* p ≤ 0.005 compared to uninfected conditions and # p ≤ 0.005 compared to HIV DNA (+) cells). In contrast, only 10.45 ± 3.65 cells with integrated HIV DNA accumulated HIV-gp120 protein. In HIVE conditions, cells with integrated HIV DNA (HIVE-DNA (+)) were 1364 ± 349 cells, and uninfected cells (HIVE-DNA (−)) were 901 ± 302 cells; thus, local numbers of cells containing HIV-gp120 could be comparable to HIVE conditions but with a significantly lower expression or accumulation as well as being extremely localized. Bar: 100 µm.
Figure 4
Figure 4
HIV-integrase protein is poorly expressed in HIV-infected cells under ART. (AE) Representative confocal images showing the expression and distribution of integrase in the HIV-infected cells, showing minimal to no expression of integrase, where labeling corresponds to (A) DAPI, (B) HIV DNA, (C) HIV-mRNA, (D) HIV-integrase protein, and (E) merging of all colors. White arrows indicate cells with integrated HIV DNA. Asterisks and arrows indicate cells with high levels of cytoplasmic and nuclear integrase proteins. The insets indicate the colocalization of DAPI, HIV DNA, and integrase. (F) Quantification of cells with integrated HIV DNA, viral mRNA, and HIV-integrase protein according to its localization in Macrophage/Microglia or astrocytes in human brain tissues obtained from individuals with undetectable, low, and high viral replication (* p ≤ 0.005 compared to uninfected conditions, # p ≤ 0.005 compared to HIVun conditions, and & p ≤ 0.005 compared to HIVun or HIVlow conditions; n = 34 tissues analyzed and 21 tissues compared to uninfected tissues, Un and Alz, n = 8 different tissues; each point represents 3–5 different areas per tissue analyzed). The total numbers of cells in HIVE conditions were 1406 ± 425 cells, 905 ± 357 cells were macrophages, and 569 ± 299 cells were astrocytes (data not plotted). (G) Quantification of cells expressing HIV-integrase protein detected in HIV-positive and -negative cells, 11.22 ± 8.52 and 4.21 ± 2.46 cells, respectively. In contrast, in HIVE conditions, most integrase was accumulated in HIV DNA-positive cells, 1406 ± 425 cells (HIV DNA (+)), and HIV DNA-negative cells (HIV DNA (−)) 904 ± 305 cells, surrounding HIV-infected clusters. * p ≤ 0.005 compared to uninfected conditions. Bar: 100 µm.
Figure 5
Figure 5
HIV-nef is expressed in HIV-infected and surrounding uninfected cells, even in ART conditions. (AE) Representative confocal images show the expression and distribution of nef protein in the HIV-infected cells. Labeling corresponds to (A) DAPI, (B) HIV DNA, (C) HIV-mRNA, and (D) HIV-nef protein showing wide distribution in cells containing integrated HIV DNA (white arrows) and cells without integrated DNA, and (E) merging of all colors. The asterisks (* and **) and arrows represent cells with a high HIV-nef protein expression. The insets show cells with DAPI, HIV DNA, and HIV-nef protein. (F) Quantification of cells with integrated HIV DNA, viral mRNA, and HIV-nef protein in microglia/macrophages and astrocytes according to the tissue analyzed based on systemic replication, including undetectable, low, and high replication (* p ≤ 0.005 compared to uninfected conditions, # p ≤ 0.005 compared to HIVun conditions, and & p ≤ 0.005 compared to HIVun or HIVlow conditions; n = 34 tissues analyzed and 21 tissues compared to uninfected tissues, Un and Alz, n = 8 different tissues; each point represents 3–5 different areas per tissue analyzed). (G) Quantification of cells positive for HIV-nef protein in HIV-infected cells (HIV DNA (+)) was 17.15 ± 2.81 cells compared to neighboring uninfected cells (HIV DNA (−)) containing HIV-nef protein 341.63 ± 107.68 cells. This indicates a strong nef expression within the CNS in the current ART era, especially in neighboring uninfected cells. * p ≤ 0.005 compared to uninfected conditions, # p ≤ 0.005 compared to HIVun conditions. Bar: 100 µm.
Figure 6
Figure 6
HIV-vpr is expressed in HIV-infected cells under effective ART. (AE) Representative confocal images present the expression and distribution of Vpr protein in the HIV-infected cells. We identified that HIV-vpr was expressed in HIV-infected cells and cells without DNA. Labeling corresponds to (A) DAPI, (B) HIV DNA, (C) HIV-mRNA, and (D) HIV-vpr protein; it was not possible to establish a diffusion pattern similar to gp120 and nef proteins. HIV-vpr-positive cells were scattered within the brain (arrows represent HIV-infected cells producing HIV-vpr, * or ** represent cells with high HIV-vpr expression without an association to HIV-infected cells), (E) merging of all colors. The insets indicate cells positive for DAPI, HIV DNA, and vpr protein. (F) Quantification of cells with integrated HIV DNA, producing HIV-mRNA and HIV-vpr protein in Macrophage/Microglia and astrocytes according to the brain tissue analyzed based on systemic replication, including undetectable, low, and high replication (* p ≤ 0.005 compared to uninfected conditions, # p ≤ 0.005 compared to HIVun conditions, and & p ≤ 0.005 compared to HIVun or HIVlow conditions; n = 34 tissues analyzed and 21 tissues compared to uninfected tissues, Un and Alz, n = 8 different tissues; each point represents 3–5 different areas per tissue analyzed). In HIVE conditions, HIV-vpr colocalized mostly with HIV-infected cells with total numbers (HIVE) of 1289 ± 245, macrophages 920 ± 105 cells, and astrocyte 623 ± 277 positive cells. (G) Quantification of cells expressing HIV-vpr protein in uninfected cells (HIV DNA (−)) positive for vpr was 855.83 ± 257.45 cells around the clusters containing cells with integrated HIV DNA, compared to HIV DNA-positive cells (HIV DNA (+)) with 9.68 ± 2.70 cells, suggesting a bystander secretion and uptake (* p ≤ 0.005 compared to uninfected conditions and # p ≤ 0.005 compared to HIV DNA(+) cells). In HIVE conditions, quantification shows most vpr was in cells with integrated HIV DNA (HIVE-DNA (+)), with 1289 ± 245 cells, and minimal amounts present in uninfected cells (HIVE-DNA (−)), with 920 ± 105 cells. Bar: 100 µm.
Figure 7
Figure 7
HIV-tat protein is expressed within the CNS, even in the ART era. (AE) Representative confocal images show the expression and distribution of the tat protein in the HIV-infected cells and surrounding uninfected cells. Labeling corresponds to (A) DAPI, (B) HIV DNA, (C) HIV-mRNA, (D) HIV-tat protein showing diffusion from HIV DNA-positive cells into neighboring uninfected cells (white arrows indicate cells with integrated HIV DNA and */** indicates cells without integrated HIV DNA, but highly positive for HIV-tat), (E) merging of all colors. The insets indicate cells positive for DAPI, HIV DNA, and tat protein. (F) Quantification of cells with integrated HIV DNA, producing HIV-mRNA and HIV-tat in Macrophage/Microglia and astrocyte cells in brain tissues obtained from HIV-infected individuals with undetectable, low, and high replication (* p ≤ 0.005 compared to uninfected conditions, # p ≤ 0.005 compared to HIVun conditions, and & p ≤ 0.005 compared to HIVun or HIVlow conditions; n = 34 tissues analyzed and 21 tissues compared to uninfected tissues, Un and Alz, n = 8 different tissues; each point represents 3–5 different areas per tissue analyzed). In encephalitic conditions (HIVEs), HIV-tat colocalized mostly with HIV-infected cells, total numbers (HIVE, 1193 ± 244), Macrophage/Microglia (801 ± 197 cells), and a small population of astrocytes (685 ± 297 cells) (data not show). (G) Quantification of cells positive for tat protein-containing integrated HIV DNA (HIV DNA (+)) indicates only 13.96 ± 3.65 cells, whereas 1383.71 ± 164.85 uninfected surrounding cells (HIV DNA (−)) contained tat protein. A similar number of cells were found in HIV encephalitic brains (HIVEs), 1306 ± 306 cells expressed tat in HIV-infected cells (HIVE DNA (+)), and only 934 ± 277 cells without HIV DNA showed HIV-tat staining, HIV DNA (−), * p ≤ 0.005 compared to uninfected conditions, # p ≤ 0.005 compared to HIV DNA (+) cells. Bar: 100 µm.

Similar articles

Cited by

References

    1. De Scheerder M.A., Vrancken B., Dellicour S., Schlub T., Lee E., Shao W., Rutsaert S., Verhofstede C., Kerre T., Malfait T., et al. HIV Rebound Is Predominantly Fueled by Genetically Identical Viral Expansions from Diverse Reservoirs. Cell Host Microbe. 2019;26:347–358.e347. doi: 10.1016/j.chom.2019.08.003. - DOI - PMC - PubMed
    1. De-Scheerder M.A., Depelseneer B., Vandekerckhove L., Trypsteen W. Evolution of Experimental Design and Research Techniques in HIV-1 Reservoir Studies: A Systematic Review. AIDS Rev. 2020;22:16–24. doi: 10.24875/AIDSRev.M20000028. - DOI - PubMed
    1. Kimata J.T., Rice A.P., Wang J. Challenges and strategies for the eradication of the HIV reservoir. Curr. Opin. Immunol. 2016;42:65–70. doi: 10.1016/j.coi.2016.05.015. - DOI - PMC - PubMed
    1. Fujinaga K., Cary D.C. Experimental Systems for Measuring HIV Latency and Reactivation. Viruses. 2020;12:1279. doi: 10.3390/v12111279. - DOI - PMC - PubMed
    1. Wong J.K., Yukl S.A. Tissue reservoirs of HIV. Curr. Opin. HIV AIDS. 2016;11:362–370. doi: 10.1097/COH.0000000000000293. - DOI - PMC - PubMed

Publication types