Review
. 2022 Aug 2;11(15):2383.
doi: 10.3390/cells11152383.

Profiling Microglia through Single-Cell RNA Sequencing over the Course of Development, Aging, and Disease

Affiliations
Review

Profiling Microglia through Single-Cell RNA Sequencing over the Course of Development, Aging, and Disease

Spyros Pettas et al. Cells. .

Abstract

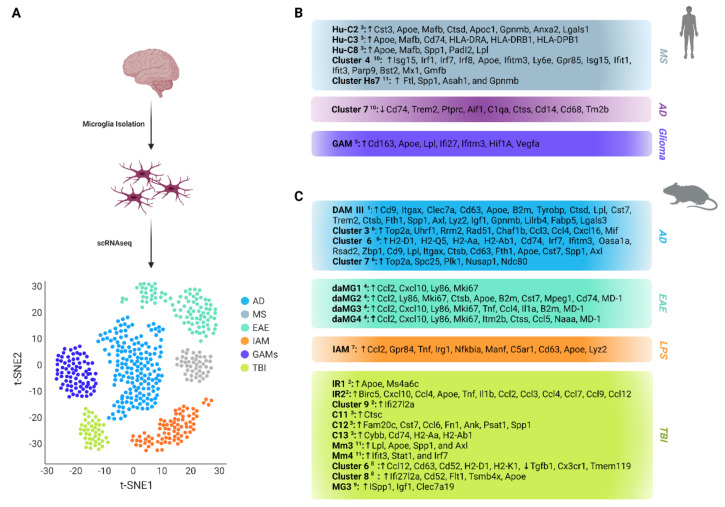
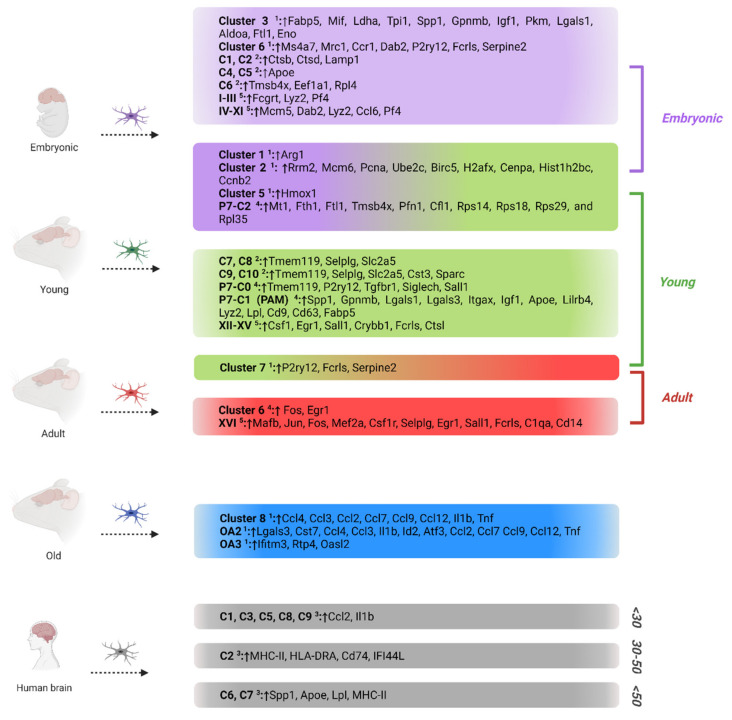
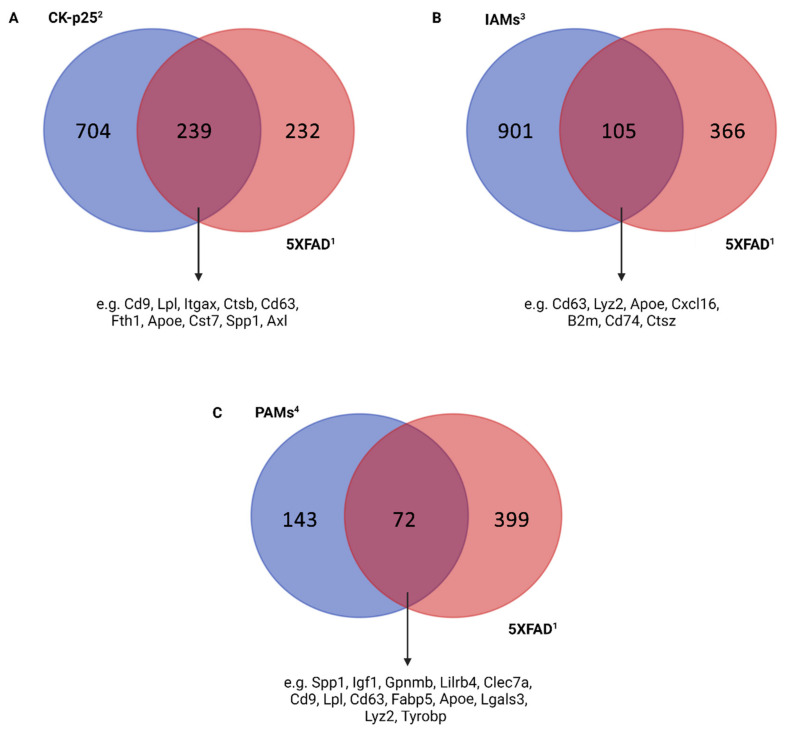
Microglia are macrophages present in the brain that function as the primary and most important source of immune response in the central nervous system (CNS). Regardless of their multitasking role, our knowledge regarding their molecular heterogeneity is limited; due to technical restrictions, it is only possible to measure gene expression in cell populations, not individual cells, with the results reflecting average mRNA levels. Therefore, recent scientific approaches have focused on single-cell techniques such as single-cell RNA sequencing (scRNAseq), a powerful technique that enables the delineation of transcriptomic cell-to-cell differences, revealing subpopulations with distinct molecular and functional characteristics. Here, we summarize recent studies that focused on transcriptomic microglial subpopulation clustering and classify them into three distinct groups based on age, spatial distribution, and disease. Additionally, we cross-compare populations from different studies to identify expressional and functional overlaps between them.

Keywords: aging; development; disease; microglia; microglial heterogeneity; neurodegenerative diseases; single-cell RNA sequencing.


Conflict of interest statement

The authors declare no conflict of interest.

Figures

Figure 1
Figure 1
Schematic overview of the most distinct disease-associated microglial populations and their transcriptomic signatures revealed through transcriptional profiling of murine and human microglia using single-cell RNA sequencing. (A) Schematic representation of research process for molecular classification of microglial subpopulations. (B) Most regulated human disease-associated microglial populations and their transcriptomic signatures. (C) Most regulated mouse disease-associated microglial populations and their transcriptomic signatures. Microglial subsets are represented with superscript numbers as described in the studies of 1 Keren-Shaul et al. [14], 2 Hammond et al. [15], 3 Masuda et al. [16], 4 Jordão et al. [17], 5 Sankowski et al. [18], 6 Mathys et al. [19], 7 Sousa et al. [20], 8 Wicher et al. [21], 9 Li et al. [22], 10 Olah et al. [23], and 11 Miedema et al. [24]. AD: Alzheimer’s Disease, MS: Multiple Sclerosis, EAE: Experimental Autoimmune Encephalomyelitis, LPS: Lipopolysaccharide, IAM: Inflammatory-Associated Microglia, GAM: Glioma-Associated Microglia HIV: Human Immunodeficiency Virus, TBI: Traumatic Brain Injury. ↑ denotes transcriptomic upregulation, ↓ denotes transcriptomic downregulation. Figure created with BioRender.com (accessed on 22 June 2022).
Figure 2
Figure 2
Overview of the most distinct age-associated microglial populations and their transcriptomic signatures revealed through transcriptional profiling of murine and human microglia using single-cell RNA sequencing. Microglial subsets are represented with superscript numbers as described in the studies of 1 Hammond et al. [15], 2 Masuda et al. [16], 3 Sankowski et al. [18], 4 Li et al. [39], 5 Matcovitch-Natan et al. [40]. ↑ denotes transcriptomic upregulation. Figure created with BioRender.com (accessed on 18 June 2022).
Figure 3
Figure 3
Comparison of upregulated genes between 1 Keren-Shaul et al. [14] DAM III cluster with different microglial subsets derived through single-cell RNA sequencing uncovers expressional and functional overlaps between them. Only upregulated genes with statistical significance (p-value < 0.05) were used for the comparison. (A) Venn diagrams depicting common and differential transcriptomic patterns between 1 Keren-Shaul et al. [14] DAM III cluster and 2 Mathys et al. [19] late-response cluster 6. (B) Venn diagrams depicting common and differential transcriptomic patterns between 1 Keren-Shaul et al. [14] DAM III cluster and 3 Sousa et al. [20] IAM cluster. (C) Venn diagrams depicting common and differential transcriptomic patterns between 1 Keren-Shaul et al. [14] DAM III cluster and 4 Li et al. [39] PAM clusters. Superscript numbers refer to the respective studies. Figure created with BioRender.com (accessed on 18 June 2022).

References

    1. Reemst K., Noctor S.C., Lucassen P.J., Hol E.M. The Indispensable Roles of Microglia and Astrocytes during Brain Development. Front. Hum. Neurosci. 2016;10:566. doi: 10.3389/fnhum.2016.00566. - DOI - PMC - PubMed
    1. Ginhoux F., Greter M., Leboeuf M., Nandi S., See P., Gokhan S., Mehler M.F., Conway S.J., Ng L.G., Stanley E.R., et al. Fate Mapping Analysis Reveals That Adult Microglia Derive from Primitive Macrophages. Science. 2010;330:841–845. doi: 10.1126/science.1194637. - DOI - PMC - PubMed
    1. Lawson L.J., Perry V.H., Gordon S. Turnover of Resident Microglia in the Normal Adult Mouse Brain. Neuroscience. 1992;48:405–415. doi: 10.1016/0306-4522(92)90500-2. - DOI - PubMed
    1. Mittelbronn M., Dietz K., Schluesener H.J., Meyermann R. Local Distribution of Microglia in the Normal Adult Human Central Nervous System Differs by up to One Order of Magnitude. Acta Neuropathol. 2001;101:249–255. doi: 10.1007/s004010000284. - DOI - PubMed
    1. Bessis A., Béchade C., Bernard D., Roumier A. Microglial Control of Neuronal Death and Synaptic Properties. Glia. 2007;55:233–238. doi: 10.1002/glia.20459. - DOI - PubMed

Publication types

LinkOut - more resources