

The Differential Metabolic Signature of Breast Cancer Cellular Response to Olaparib Treatment
- PMID: 35954325
- PMCID: PMC9367310
- DOI: 10.3390/cancers14153661
The Differential Metabolic Signature of Breast Cancer Cellular Response to Olaparib Treatment
Abstract
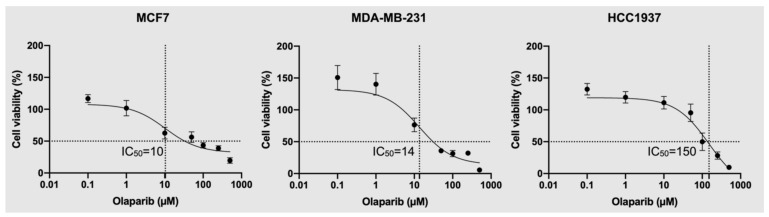
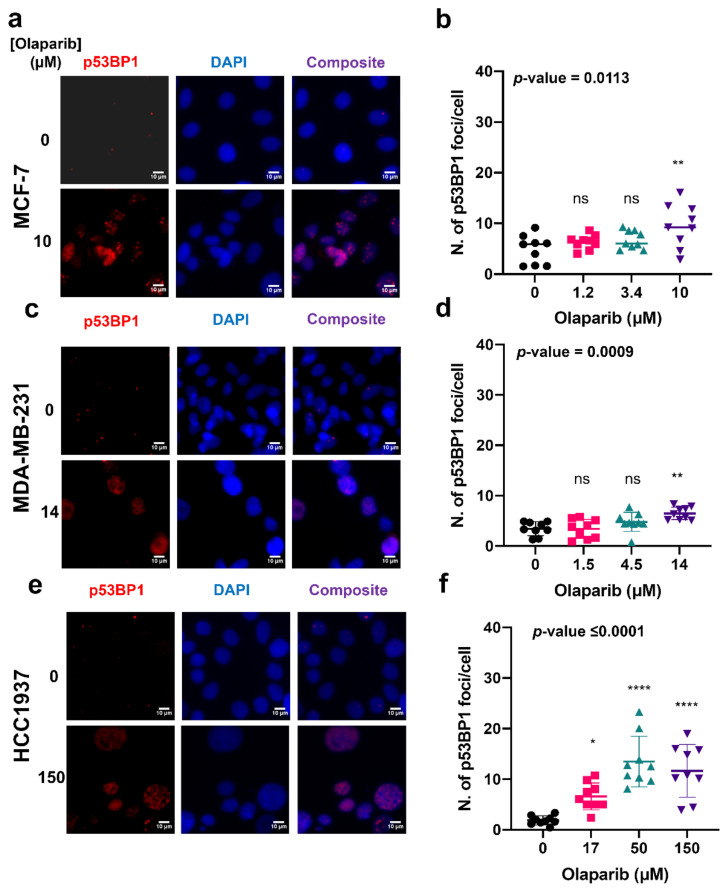
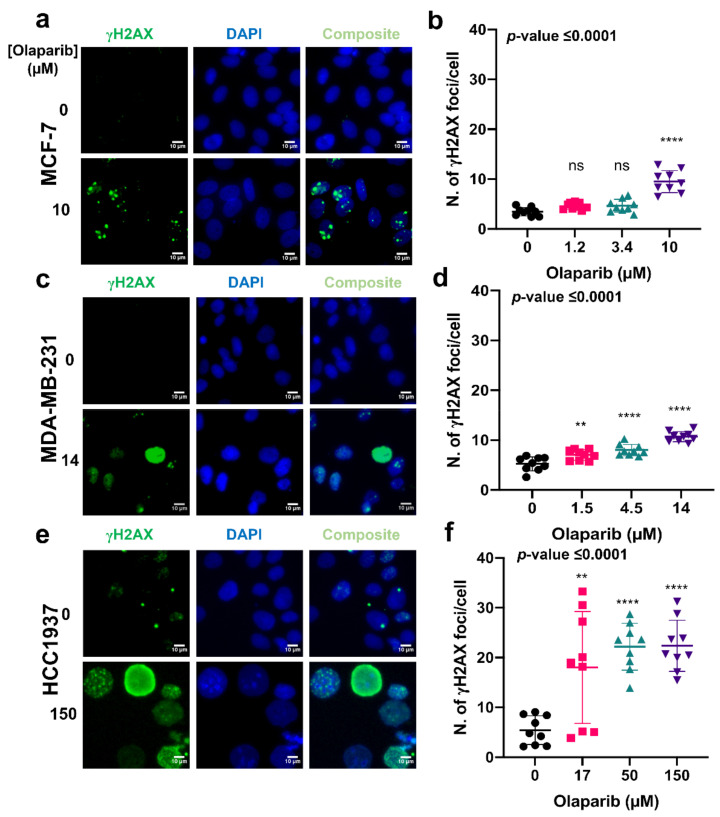
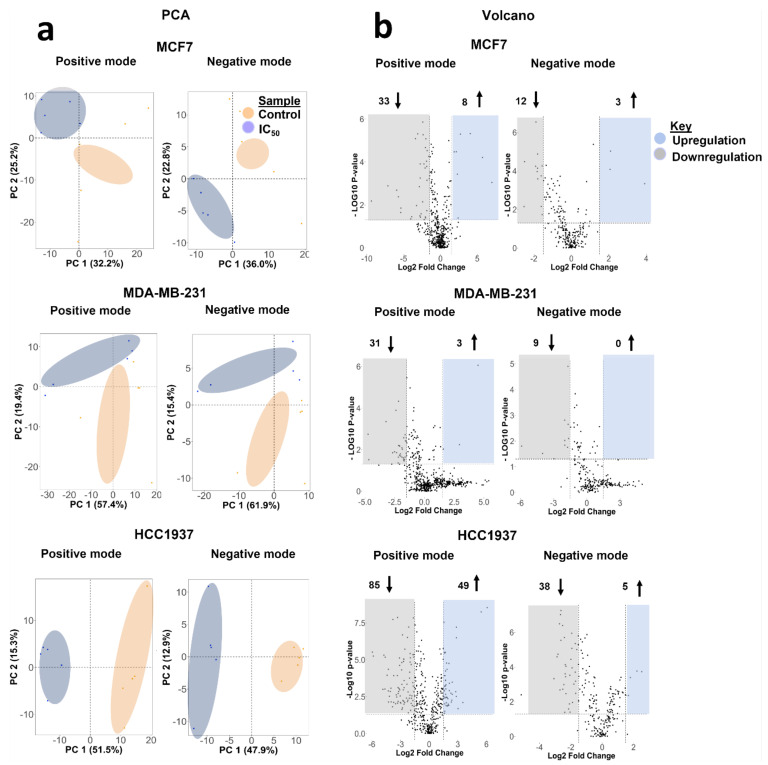
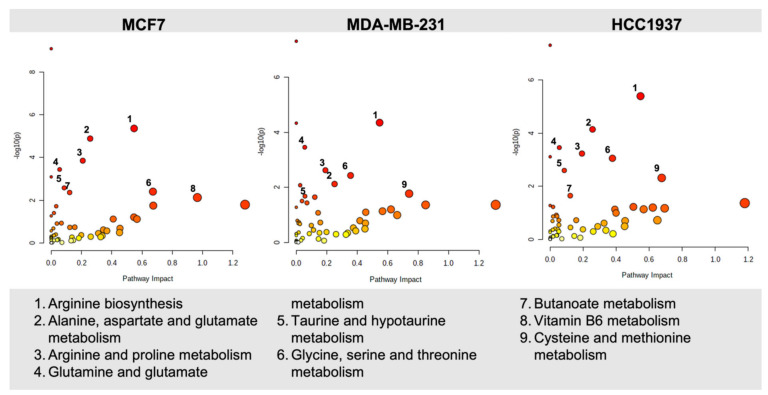
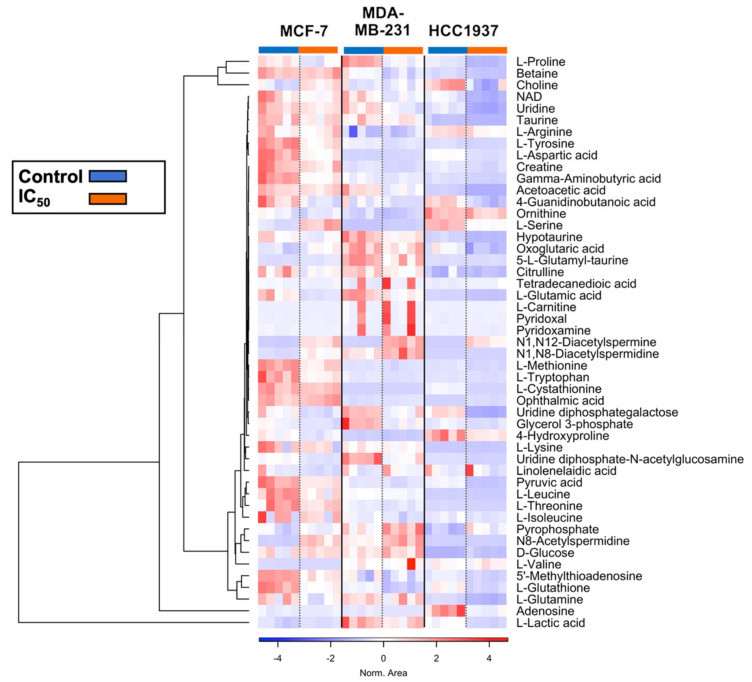
Metabolic reprogramming and genomic instability are key hallmarks of cancer, the combined analysis of which has gained recent popularity. Given the emerging evidence indicating the role of oncometabolites in DNA damage repair and its routine use in breast cancer treatment, it is timely to fingerprint the impact of olaparib treatment in cellular metabolism. Here, we report the biomolecular response of breast cancer cell lines with DNA damage repair defects to olaparib exposure. Following evaluation of olaparib sensitivity in breast cancer cell lines, we immunoprobed DNA double strand break foci and evaluated changes in cellular metabolism at various olaparib treatment doses using untargeted mass spectrometry-based metabolomics analysis. Following identification of altered features, we performed pathway enrichment analysis to measure key metabolic changes occurring in response to olaparib treatment. We show a cell-line-dependent response to olaparib exposure, and an increased susceptibility to DNA damage foci accumulation in triple-negative breast cancer cell lines. Metabolic changes in response to olaparib treatment were cell-line and dose-dependent, where we predominantly observed metabolic reprogramming of glutamine-derived amino acids and lipids metabolism. Our work demonstrates the effectiveness of combining molecular biology and metabolomics studies for the comprehensive characterisation of cell lines with different genetic profiles. Follow-on studies are needed to map the baseline metabolism of breast cancer cells and their unique response to drug treatment. Fused with genomic and transcriptomics data, such readout can be used to identify key oncometabolites and inform the rationale for the design of novel drugs or chemotherapy combinations.
Keywords: DNA damage; breast cancer; metabolic reprogramming; oncometabolites; precision medicine; triple-negative.
Conflict of interest statement
The authors declare no conflict of interest.
Figures
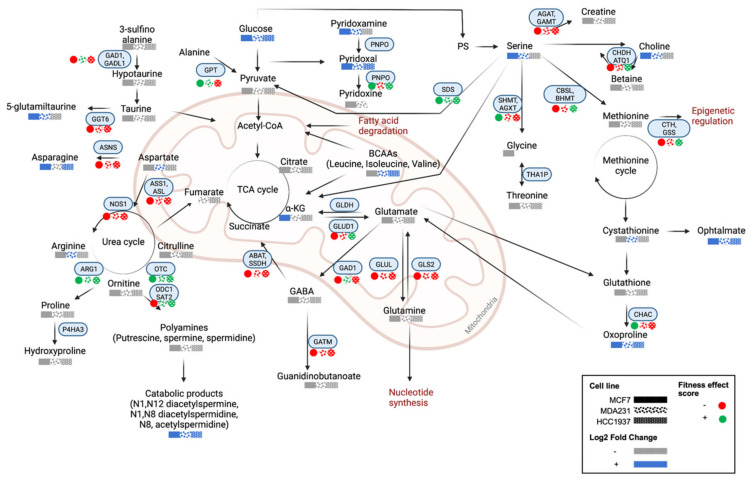
 ), MDA-MB-231 (
 ), and HCC1937 (
 ). Fitness effect score is based on the Chronos algorithm.
Similar articles
-
Histone deacetylase inhibitor, suberoylanilide hydroxamic acid (SAHA), enhances anti-tumor effects of the poly (ADP-ribose) polymerase (PARP) inhibitor olaparib in triple-negative breast cancer cells.Breast Cancer Res. 2015 Mar 7;17:33. doi: 10.1186/s13058-015-0534-y. Breast Cancer Res. 2015. PMID: 25888415 Free PMC article.
-
Olaparib and ionizing radiation trigger a cooperative DNA-damage repair response that is impaired by depletion of the VRK1 chromatin kinase.J Exp Clin Cancer Res. 2019 May 17;38(1):203. doi: 10.1186/s13046-019-1204-1. J Exp Clin Cancer Res. 2019. PMID: 31101118 Free PMC article.
-
PARP inhibitor olaparib has a potential to increase the effectiveness of electrochemotherapy in BRCA1 mutated breast cancer in mice.Bioelectrochemistry. 2021 Aug;140:107832. doi: 10.1016/j.bioelechem.2021.107832. Epub 2021 May 1. Bioelectrochemistry. 2021. PMID: 33984694
-
Genomic instability and metabolism in cancer.Int Rev Cell Mol Biol. 2021;364:241-265. doi: 10.1016/bs.ircmb.2021.05.004. Epub 2021 Jul 1. Int Rev Cell Mol Biol. 2021. PMID: 34507785 Review.
-
Olaparib tablets for the treatment of germ line BRCA-mutated metastatic breast cancer.Expert Rev Clin Pharmacol. 2018 Sep;11(9):833-839. doi: 10.1080/17512433.2018.1513321. Epub 2018 Aug 30. Expert Rev Clin Pharmacol. 2018. PMID: 30118334 Review.
Cited by
-
Signature-based repurposed drugs resemble the inhibition of TGFβ-induced NDRG1 as potential therapeutics for triple-negative breast cancer.Int J Biol Sci. 2025 Jun 9;21(9):3949-3967. doi: 10.7150/ijbs.112645. eCollection 2025. Int J Biol Sci. 2025. PMID: 40612674 Free PMC article.
-
Natural compounds solasonine and alisol B23-acetate target GLI3 signaling to block oncogenesis in MED12-altered breast cancer.Mol Biol Res Commun. 2024;13(3):127-135. doi: 10.22099/mbrc.2024.49044.1915. Mol Biol Res Commun. 2024. PMID: 38915457 Free PMC article.
-
Deregulated Metabolic Pathways in Ovarian Cancer: Cause and Consequence.Metabolites. 2023 Apr 15;13(4):560. doi: 10.3390/metabo13040560. Metabolites. 2023. PMID: 37110218 Free PMC article. Review.
-
An Optimised Monophasic Faecal Extraction Method for LC-MS Analysis and Its Application in Gastrointestinal Disease.Metabolites. 2022 Nov 14;12(11):1110. doi: 10.3390/metabo12111110. Metabolites. 2022. PMID: 36422250 Free PMC article.
-
Metabolomic profiling of childhood medulloblastoma: contributions and relevance to diagnosis and molecular subtyping.J Cancer Res Clin Oncol. 2024 Oct 23;150(10):471. doi: 10.1007/s00432-024-05990-1. J Cancer Res Clin Oncol. 2024. PMID: 39441459 Free PMC article. Review.
References
Grants and funding
LinkOut - more resources
Full Text Sources
