

TP53 Abnormalities Are Underlying the Poor Outcome Associated with Chromothripsis in Chronic Lymphocytic Leukemia Patients with Complex Karyotype
- PMID: 35954380
- PMCID: PMC9367500
- DOI: 10.3390/cancers14153715
TP53 Abnormalities Are Underlying the Poor Outcome Associated with Chromothripsis in Chronic Lymphocytic Leukemia Patients with Complex Karyotype
Abstract
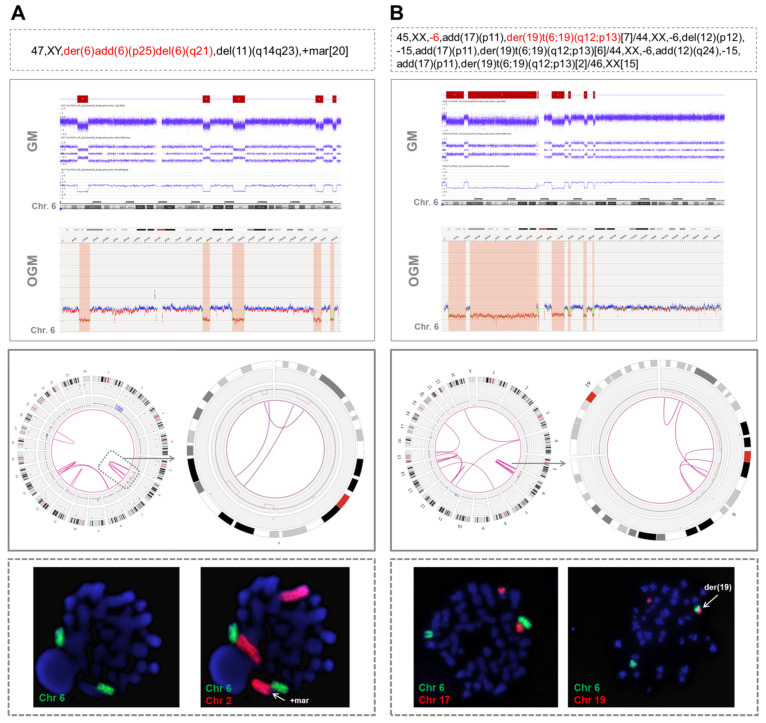
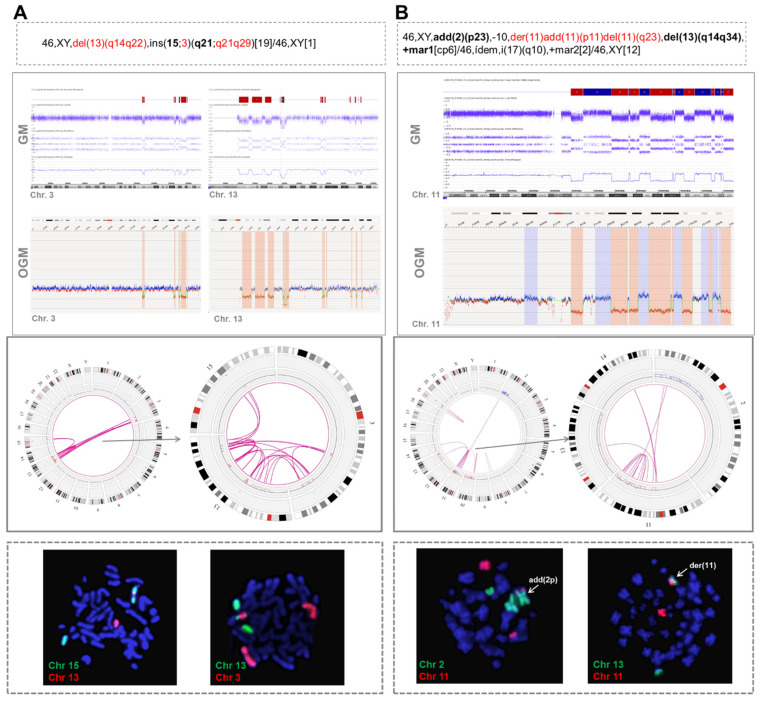
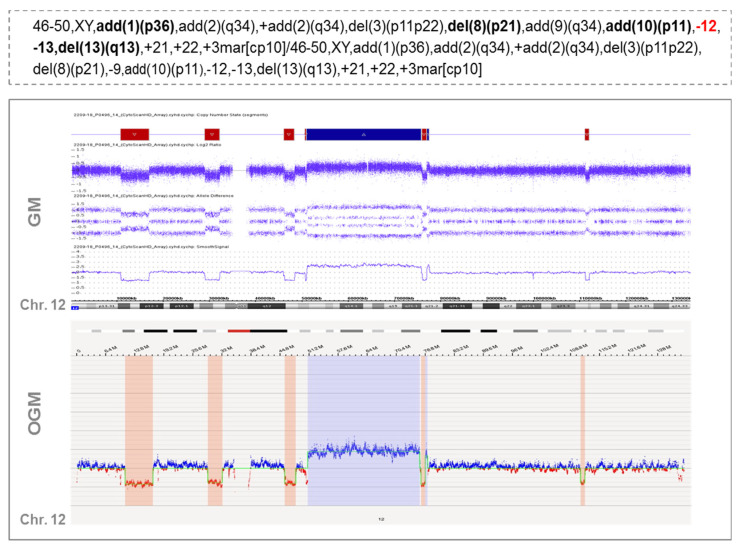
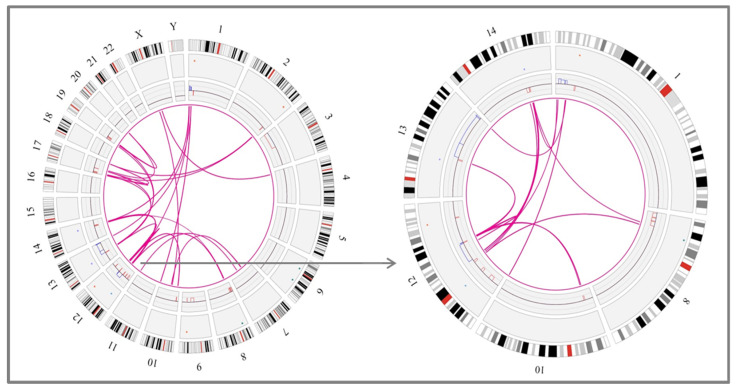
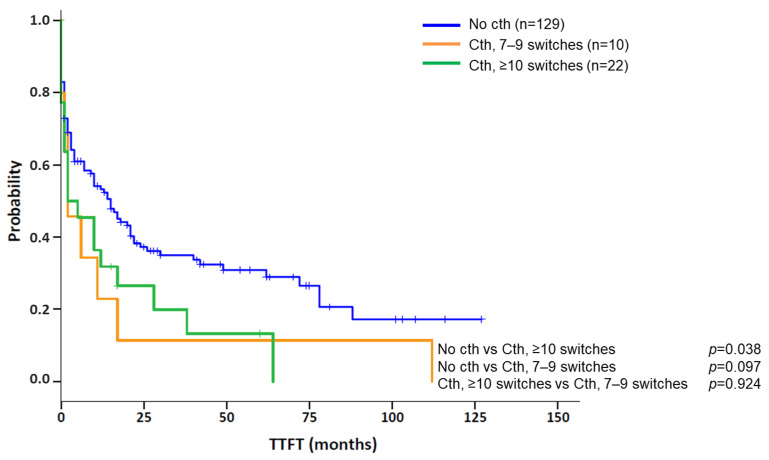
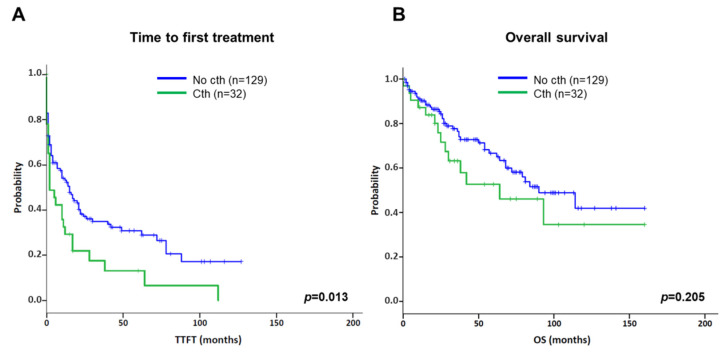
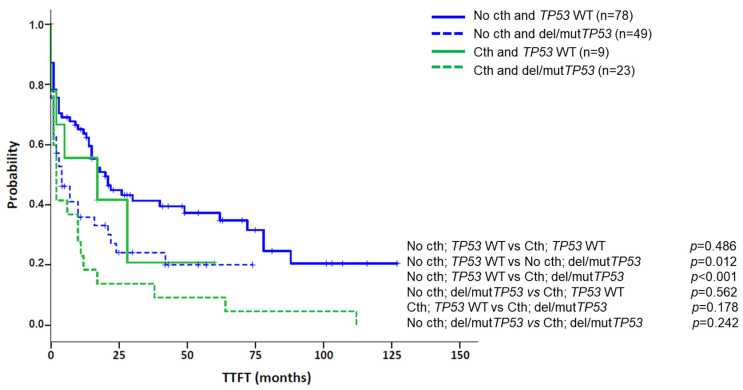
Chromothripsis (cth) has been associated with a dismal outcome and poor prognosis factors in patients with chronic lymphocytic leukemia (CLL). Despite being correlated with high genome instability, previous studies have not assessed the role of cth in the context of genomic complexity. Herein, we analyzed a cohort of 33 CLL patients with cth and compared them against a cohort of 129 non-cth cases with complex karyotypes. Nine cth cases were analyzed using optical genome mapping (OGM). Patterns detected by genomic microarrays were compared and the prognostic value of cth was analyzed. Cth was distributed throughout the genome, with chromosomes 3, 6 and 13 being those most frequently affected. OGM detected 88.1% of the previously known copy number alterations and several additional cth-related rearrangements (median: 9, range: 3-26). Two patterns were identified: one with rearrangements clustered in the region with cth (3/9) and the other involving both chromothriptic and non-chromothriptic chromosomes (6/9). Cases with cth showed a shorter time to first treatment (TTFT) than non-cth patients (median TTFT: 2 m vs. 15 m; p = 0.013). However, when stratifying patients based on TP53 status, cth did not affect TTFT. Only TP53 maintained its significance in the multivariate analysis for TTFT, including cth and genome complexity defined by genomic microarrays (HR: 1.60; p = 0.029). Our findings suggest that TP53 abnormalities, rather than cth itself, underlie the poor prognosis observed in this subset.
Keywords: TP53; chromothripsis; chronic lymphocytic leukemia; genomic complexity; genomic microarrays; optical genome mapping.
Conflict of interest statement
The authors declare no conflict of interest.
Figures
Similar articles
-
Optical Genome Mapping: A Promising New Tool to Assess Genomic Complexity in Chronic Lymphocytic Leukemia (CLL).Cancers (Basel). 2022 Jul 11;14(14):3376. doi: 10.3390/cancers14143376. Cancers (Basel). 2022. PMID: 35884436 Free PMC article.
-
Chromosome banding analysis and genomic microarrays are both useful but not equivalent methods for genomic complexity risk stratification in chronic lymphocytic leukemia patients.Haematologica. 2022 Mar 1;107(3):593-603. doi: 10.3324/haematol.2020.274456. Haematologica. 2022. PMID: 33691382 Free PMC article.
-
Genetic hallmarks and clinical implications of chromothripsis in childhood T-cell acute lymphoblastic leukemia.Leukemia. 2024 Nov;38(11):2344-2354. doi: 10.1038/s41375-024-02370-z. Epub 2024 Aug 27. Leukemia. 2024. PMID: 39192035 Free PMC article.
-
Chromothripsis in Chronic Lymphocytic Leukemia: A Driving Force of Genome Instability.Front Oncol. 2021 Nov 26;11:771664. doi: 10.3389/fonc.2021.771664. eCollection 2021. Front Oncol. 2021. PMID: 34900721 Free PMC article. Review.
-
Insight into the Molecular Basis Underlying Chromothripsis.Int J Mol Sci. 2022 Mar 19;23(6):3318. doi: 10.3390/ijms23063318. Int J Mol Sci. 2022. PMID: 35328739 Free PMC article. Review.
Cited by
-
Testicular large B-cell lymphoma is genetically similar to PCNSL and distinct from nodal DLBCL.Hemasphere. 2024 Oct 7;8(10):e70024. doi: 10.1002/hem3.70024. eCollection 2024 Oct. Hemasphere. 2024. PMID: 39380845 Free PMC article.
-
Clinical Utility of Optical Genome Mapping for Improved Cytogenomic Analysis of Gliomas.Biomedicines. 2024 Jul 25;12(8):1659. doi: 10.3390/biomedicines12081659. Biomedicines. 2024. PMID: 39200124 Free PMC article.
-
The Intersection of Epigenetic Alterations and Developmental State in Pediatric Ependymomas.Dev Neurosci. 2024;46(6):365-372. doi: 10.1159/000537694. Epub 2024 Mar 25. Dev Neurosci. 2024. PMID: 38527429 Free PMC article. Review.
-
Chromoanagenesis Detection in Chronic Lymphocytic Leukemia.Methods Mol Biol. 2025;2968:231-248. doi: 10.1007/978-1-0716-4750-9_13. Methods Mol Biol. 2025. PMID: 40884647
-
Optical Genome Mapping: A Machine-Based Platform in Cytogenomics.Methods Mol Biol. 2024;2825:113-124. doi: 10.1007/978-1-0716-3946-7_5. Methods Mol Biol. 2024. PMID: 38913305
References
-
- Herling C.D., Klaumünzer M., Rocha C.K., Altmüller J., Thiele H., Bahlo J., Kluth S., Crispatzu G., Herling M., Schiller J., et al. Complex karyotypes and KRAS and POT1 mutations impact outcome in CLL after chlorambucil-based chemotherapy or chemoimmunotherapy. Blood. 2016;128:395–404. doi: 10.1182/blood-2016-01-691550. - DOI - PubMed
-
- Puiggros A., Collado R., Calasanz M.J., Ortega M., Ruiz-Xivillé N., Rivas-Delgado A., Luño E., González T., Navarro B., García-Malo M.D., et al. Patients with chronic lymphocytic leukemia and complex karyotype show an adverse outcome even in absence of TP53/ATM FISH deletions. Oncotarget. 2017;8:54297–54303. doi: 10.18632/oncotarget.17350. - DOI - PMC - PubMed
-
- Rigolin G.M., Cavallari M., Quaglia F.M., Formigaro L., Lista E., Urso A., Guardalben E., Liberatore C., Faraci D., Saccenti E., et al. In CLL, comorbidities and the complex karyotype are associated with an inferior outcome independently of CLL-IPI. Blood. 2017;129:3495–3498. doi: 10.1182/blood-2017-03-772285. - DOI - PubMed
-
- Baliakas P., Jeromin S., Iskas M., Puiggros A., Plevova K., Nguyen-Khac F., Davis Z., Rigolin G.M., Visentin A., Xochelli A., et al. Cytogenetic complexity in chronic lymphocytic leukemia: Definitions, associations, and clinical impact. Blood. 2019;133:1205–1216. doi: 10.1182/blood-2018-09-873083. - DOI - PMC - PubMed
-
- Thompson P.A., O’Brien S.M., Wierda W.G., Ferrajoli A., Stingo F., Smith S.C., Burger J.A., Estroy Z., Jain N., Kantarjian H.M., et al. Complex karyotype is a stronger predictor than del(17p) for an inferior outcome in relapsed or refractory chronic lymphocytic leukemia patients treated with ibrutinib-based regimens. Cancer. 2015;121:3612–3621. doi: 10.1002/cncr.29566. - DOI - PMC - PubMed
Grants and funding
LinkOut - more resources
Full Text Sources
Research Materials
Miscellaneous
