Meta-Analysis
. 2022 Jul 29;19(15):9298.
doi: 10.3390/ijerph19159298.

Effects of Household Air Pollution (HAP) on Cardiovascular Diseases in Low- and Middle-Income Countries (LMICs): A Systematic Review and Meta-Analysis

Affiliations
Meta-Analysis

Effects of Household Air Pollution (HAP) on Cardiovascular Diseases in Low- and Middle-Income Countries (LMICs): A Systematic Review and Meta-Analysis

Akorede Adekoya et al. Int J Environ Res Public Health. .

Abstract

Background: Out of over 3 billion people exposed to household air pollution (HAP), approximately 4 million die prematurely, most from cardiorespiratory diseases. Although many recent studies have reported adverse effects of HAP on cardiovascular outcomes, the findings are inconsistent.

Objectives: The primary aim of this systematic review is to critically appraise the published studies and report the pooled summary of the findings on the association between HAP and cardiovascular outcomes, particularly in LMICs.

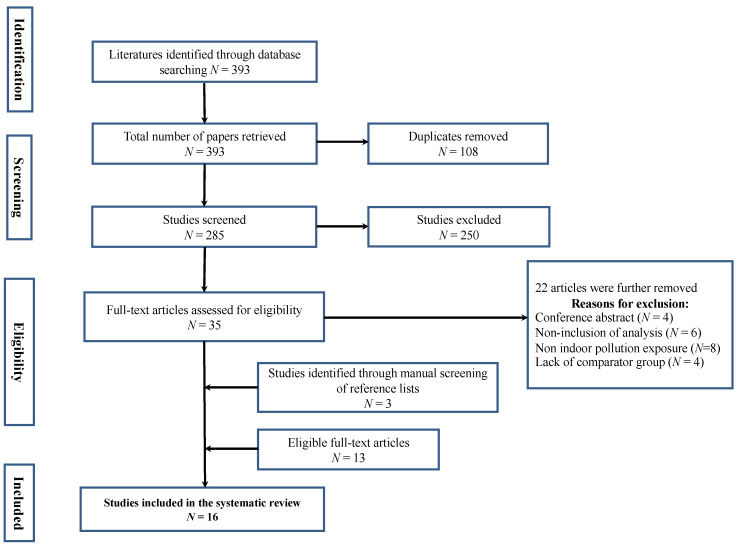
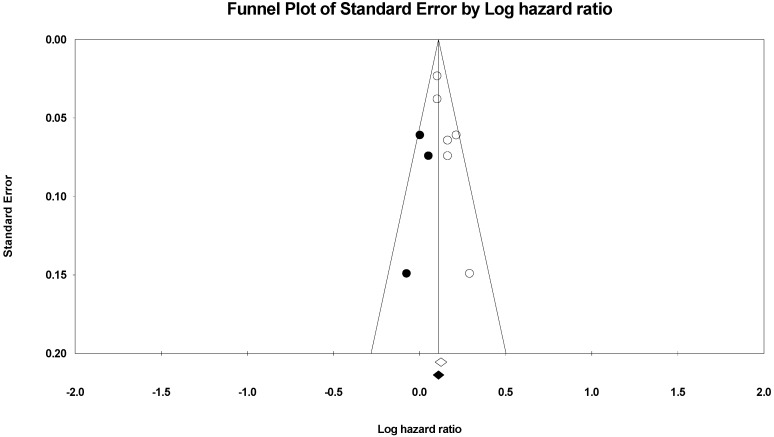
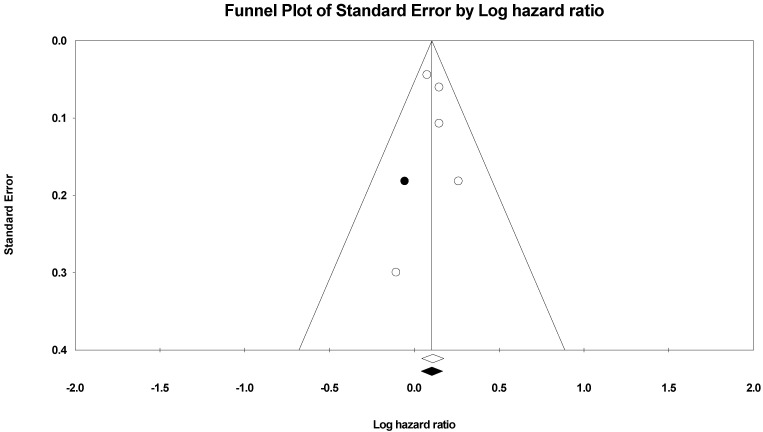
Methods: During this systematic review and meta-analysis, six databases were searched systematically, and the protocol was published in PROSPERO (CRD 42021248800). Only peer-reviewed English-language studies published from 1980 to March 2021 were included. We extracted data for the population ≥ 18 years old. Newcastle-Ottawa Criteria were used to assess the quality of evidence. The heterogeneity and publication bias of the studies was evaluated. A meta-analysis was conducted using a random-effect model to pool the findings from published studies.

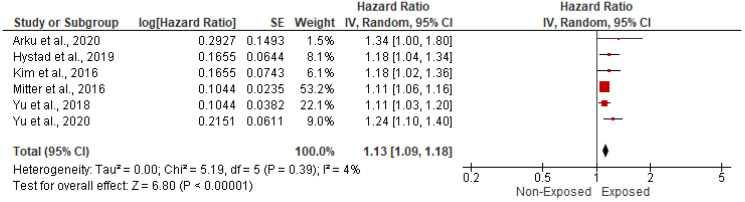
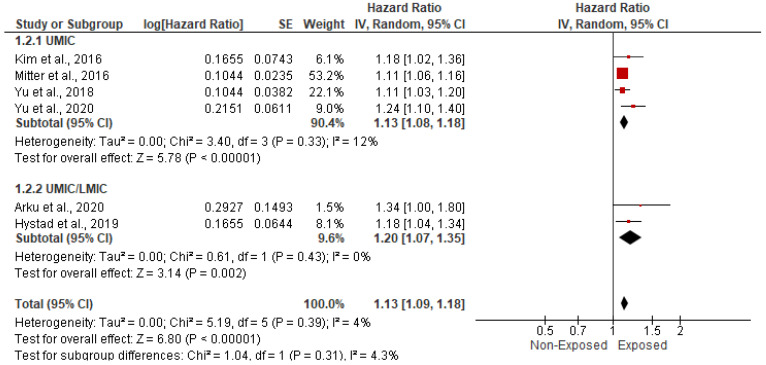
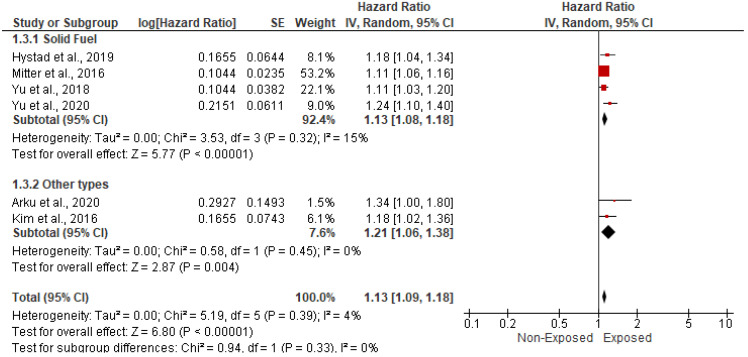
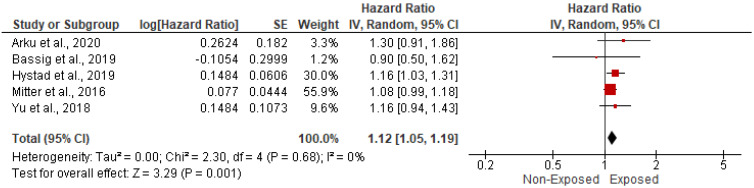
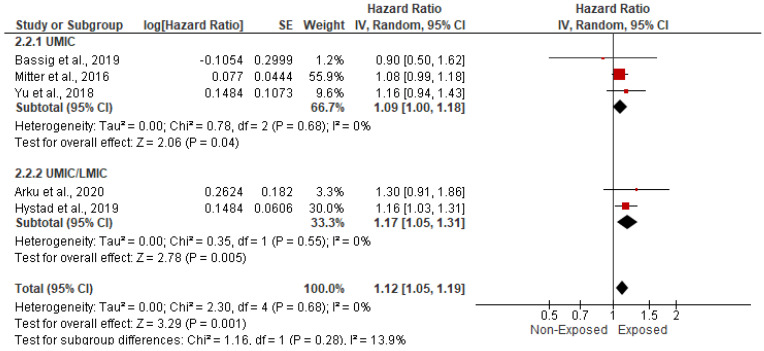
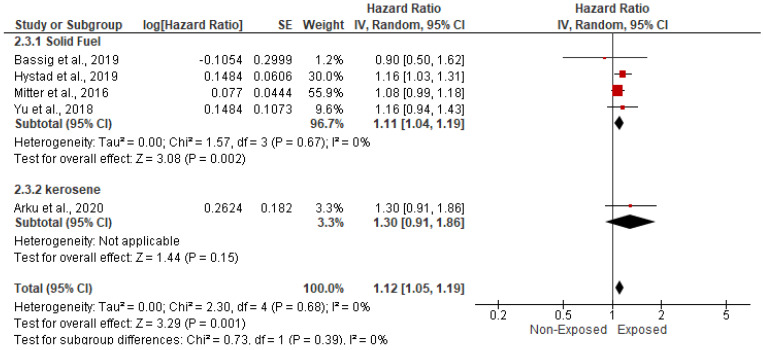
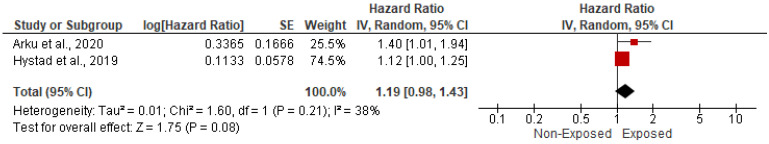
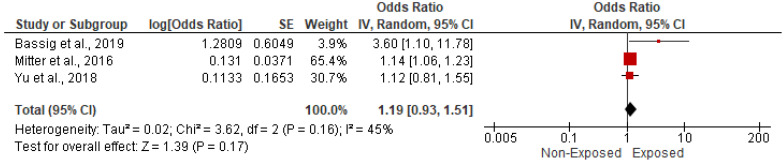
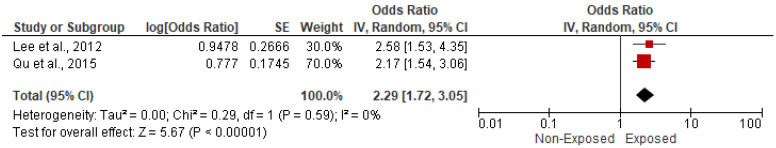
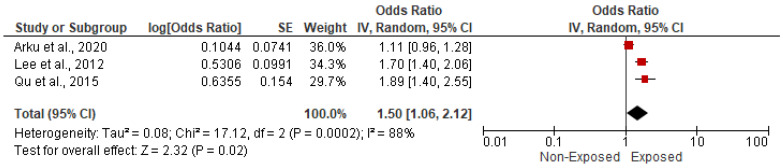
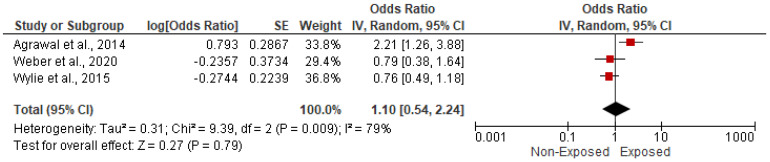
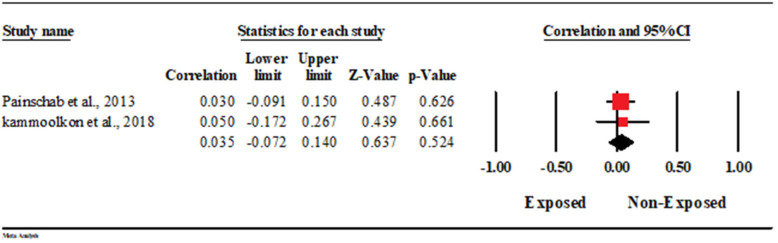
Results: In sixteen studies totaling 547,463 cases, 319,180 were exposed to HAP. The pooled estimate suggested an overall 13% higher risk of CVDs, and a 21% higher risk of CVD mortality in LMICs among those exposed to HAP. Similarly, the increased risk of stroke and cerebrovascular accidents, heart failure, and hypertension was statistically significant among those exposed to HAP but not with myocardial infarction, IHD, eclampsia/preeclampsia, and carotid intima-media thickness.

Conclusions: Our findings suggest exposure to HAP increases the risk of cardiovascular outcomes.

Keywords: biomass fuel; cardiovascular disease; household air pollution; hypertension; low-and middle-income countries; particulate matter.


Conflict of interest statement

The authors declare no conflict of interest.

Figures

Figure 1
Figure 1
The PRISMA flow diagram for the selection of studies for the systematic review.
Figure 2
Figure 2
Forest plot of summary analysis of the hazard ratio and 95% CI of the association between HAP and CVD-related mortality. The size of the red squares is proportional to the statistical weight of each trial. The gray diamond represents the pooled point estimate. The positioning of both diamonds and squares (along with 95% CIs) beyond the vertical line (unit value) suggests a significant outcome (IV = inverse variance).
Figure 3
Figure 3
After using the trim and fill method of Duvall and Tweedie, a funnel plot of the observed and plotted studies for assessing the association between HAP and CVD-related mortality. The white circles represent the observed studies, and the black circles represent the plotted studies.
Figure 4
Figure 4
Forest plot of subgroup analysis of the hazard ratio and 95% CI of the association between HAP and CVD-related mortality based on income category. The size of the red squares is proportional to the statistical weight of each trial. The gray diamond represents the pooled point estimate. The positioning of both diamonds and squares (along with 95% CIs) beyond the vertical line (unit value) suggests a significant outcome (IV = inverse variance).
Figure 5
Figure 5
Forest plot of subgroup analysis of the hazard ratio and 95% CI of the association between HAP and CVD-related mortality based on types of HAP. The size of the red squares is proportional to the statistical weight of each trial. The gray diamond represents the pooled point estimate. The positioning of both diamonds and squares (along with 95% CIs) beyond the vertical line (unit value) suggests a significant outcome (IV = inverse variance).
Figure 6
Figure 6
Forest plot of summary analysis of the hazard ratio and 95% CI of the association between HAP and stroke and cerebrovascular accidents. The size of the red squares is proportional to the statistical weight of each trial. The gray diamond represents the pooled point estimate. The positioning of both diamonds and squares (along with 95% CIs) beyond the vertical line (unit value) suggests a significant outcome (IV = inverse variance).
Figure 7
Figure 7
Funnel plot of the observed and plotted studies for assessing the association between HAP and cerebrovascular accidents after using the trim and fill method of Duvall and Tweedie. The white circles represent the observed studies, and the black circles represent the plotted studies.
Figure 8
Figure 8
Forest plot of subgroup analysis of the hazard ratio and 95% CI of the association between HAP and cerebrovascular accidents based on income category. The size of the red squares is proportional to the statistical weight of each trial. The gray diamond represents the pooled point estimate. The positioning of both diamonds and squares (along with 95% CIs) beyond the vertical line (unit value) suggests a significant outcome (IV = inverse variance).
Figure 9
Figure 9
Forest plot of subgroup analysis of the hazard ratio and 95% CI of the association between HAP and cerebrovascular accidents based on types of HAP. The size of the red squares is proportional to the statistical weight of each trial. The gray diamond represents the pooled point estimate. The positioning of both diamonds and squares (along with 95% CIs) beyond the vertical line (unit value) suggests a significant outcome (IV = inverse variance).
Figure 10
Figure 10
Forest plot of summary analysis of the hazard ratio and 95% CI of the association between HAP and myocardial infarction risk. The size of the red squares is proportional to the statistical weight of each trial. The gray diamond represents the pooled point estimate. The positioning of both diamonds and squares (along with 95% CIs) beyond the vertical line (unit value) suggests a significant outcome (IV = inverse variance).
Figure 11
Figure 11
Forest plot of summary analysis of the Odds ratio and 95% CI of the association between HAP and ischemic heart disease. The size of the red squares is proportional to the statistical weight of each trial. The gray diamond represents the pooled point estimate. The positioning of both diamonds and squares (along with 95% CIs) beyond the vertical line (unit value) suggests a significant outcome (IV = inverse variance).
Figure 12
Figure 12
Forest plot of summary analysis of the Odds ratio and 95% CI of the association between HAP and heart failure. The size of the red squares is proportional to the statistical weight of each trial. The gray diamond represents the pooled point estimate. The positioning of both diamonds and squares (along with 95% CIs) beyond the vertical line (unit value) suggests a significant outcome (IV = inverse variance).
Figure 13
Figure 13
Forest plot of summary analysis of the Odds ratio and 95% CI of the association between HAP and hypertension. The size of the red squares is proportional to the statistical weight of each trial. The gray diamond represents the pooled point estimate. The positioning of both diamonds and squares (along with 95% CIs) beyond the vertical line (unit value) suggests a significant outcome (IV = inverse variance).
Figure 14
Figure 14
Forest plot of summary analysis of the Odds ratio and 95% CI of the association between HAP and eclampsia/pre-eclampsia. The size of the red squares is proportional to the statistical weight of each trial. The gray diamond represents the pooled point estimate. The positioning of both diamonds and squares (along with 95% CIs) beyond the vertical line (unit value) suggests a significant outcome (IV = inverse variance).
Figure 15
Figure 15
Forest plot of summary analysis of the correlation coefficient and 95% CI of the association between HAP and CIMT. The size of the red squares is proportional to the statistical weight of each trial. The gray diamond represents the pooled point estimate. The positioning of both diamonds and squares (along with 95% CIs) beyond the vertical line (unit value) suggests a significant outcome (IV = inverse variance).

Similar articles

Cited by

References

    1. World Health Organization . Household Air Pollution and Health. World Health Organization; Geneva, Switzerland: 2018.
    1. Hadley M.B., Baumgartner J., Vedanthan R. Developing a clinical approach to air pollution and cardiovascular health. Circulation. 2018;137:725–742. doi: 10.1161/CIRCULATIONAHA.117.030377. - DOI - PMC - PubMed
    1. Manisalidis I., Stavropoulou E., Stavropoulos A., Bezirtzoglou E. Environmental and health impacts of air pollution: A review. Front. Public Health. 2020;8:14. doi: 10.3389/fpubh.2020.00014. - DOI - PMC - PubMed
    1. Ochieng C., Vardoulakis S., Tonne C. Household air pollution following replacement of traditional open fire with an improved rocket type cookstove. Sci. Total Environ. 2017;580:440–447. doi: 10.1016/j.scitotenv.2016.10.233. - DOI - PubMed
    1. Sapkota A., Zaridze D., Szeszenia-Dabrowska N., Mates D., Fabiánová E., Rudnai P., Janout V., Holcatova I., Brennan P., Boffetta P., et al. Indoor air pollution from solid fuels and risk of upper aerodigestive tract cancers in central and eastern Europe. Environ. Res. 2013;120:90–95. doi: 10.1016/j.envres.2012.09.008. - DOI - PubMed