

Bayesian Modeling of COVID-19 to Classify the Infection and Death Rates in a Specific Duration: The Case of Algerian Provinces
- PMID: 35954953
- PMCID: PMC9368112
- DOI: 10.3390/ijerph19159586
Bayesian Modeling of COVID-19 to Classify the Infection and Death Rates in a Specific Duration: The Case of Algerian Provinces
Abstract
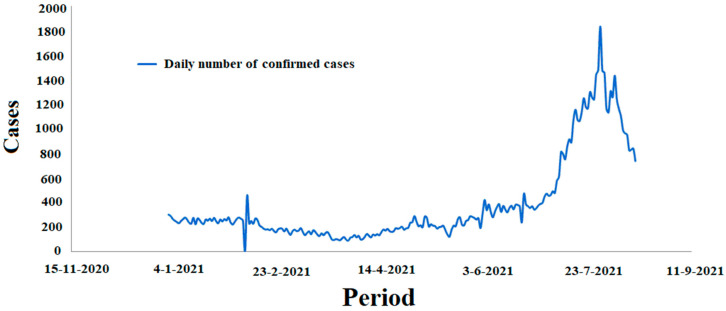
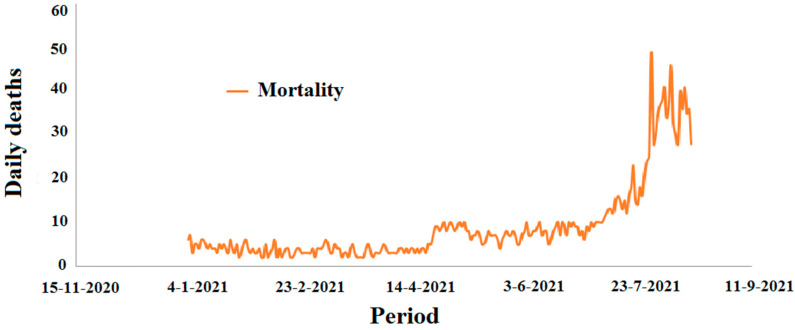
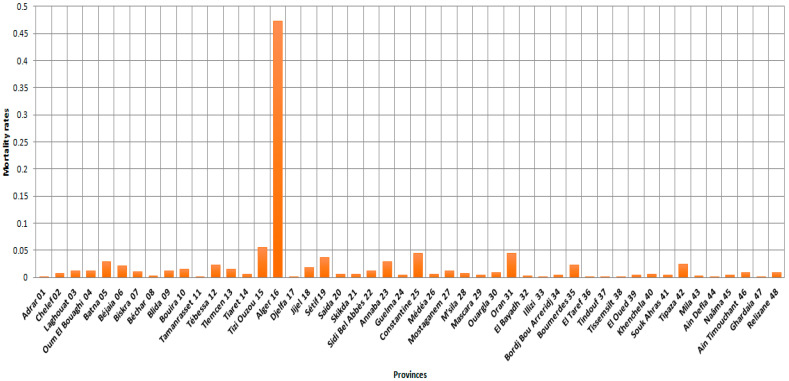
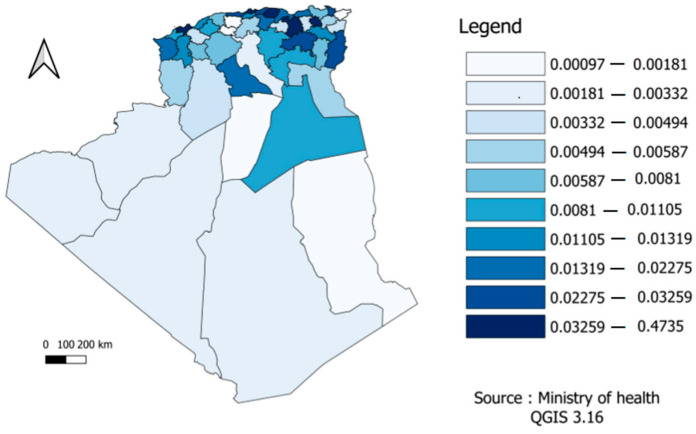
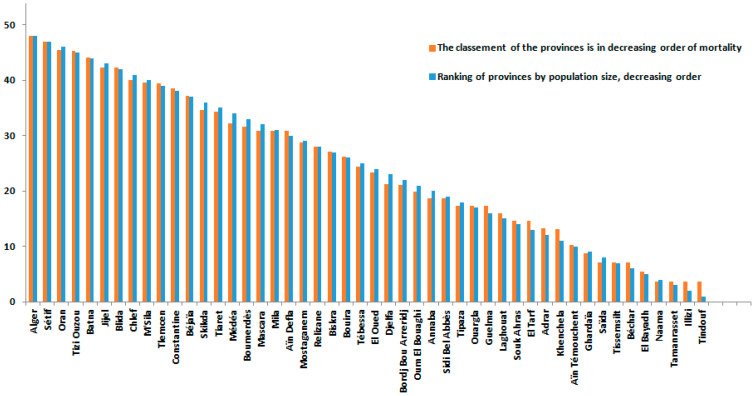
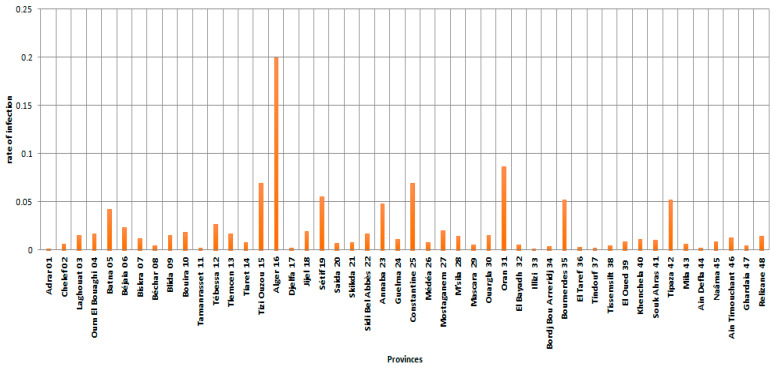
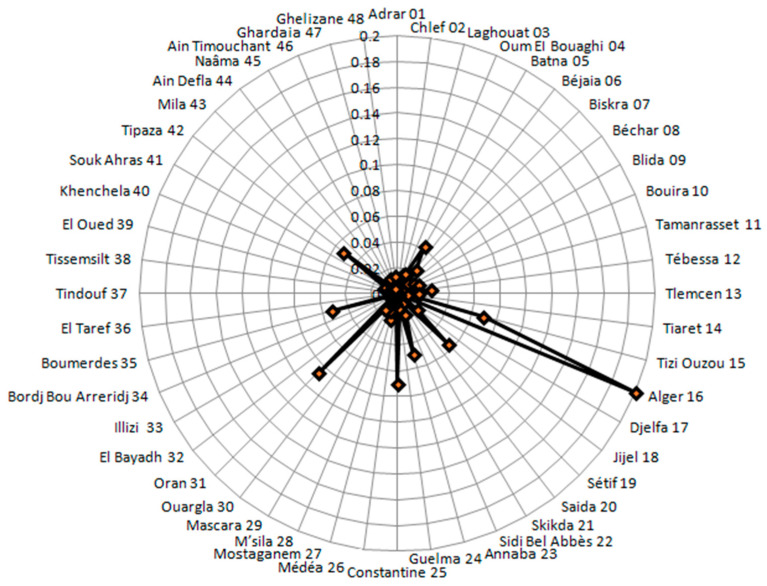
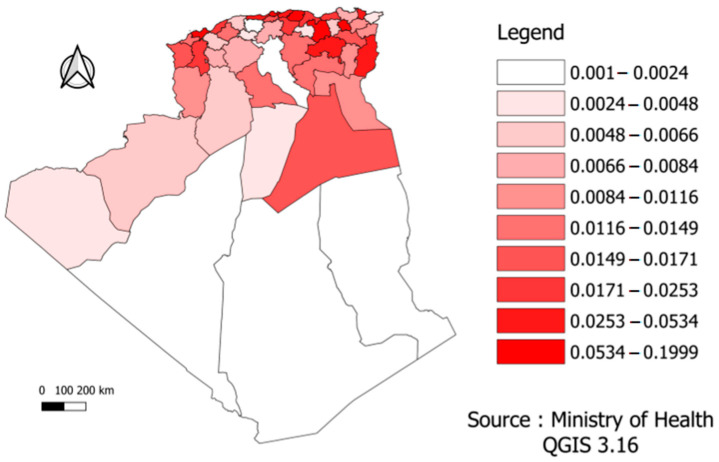
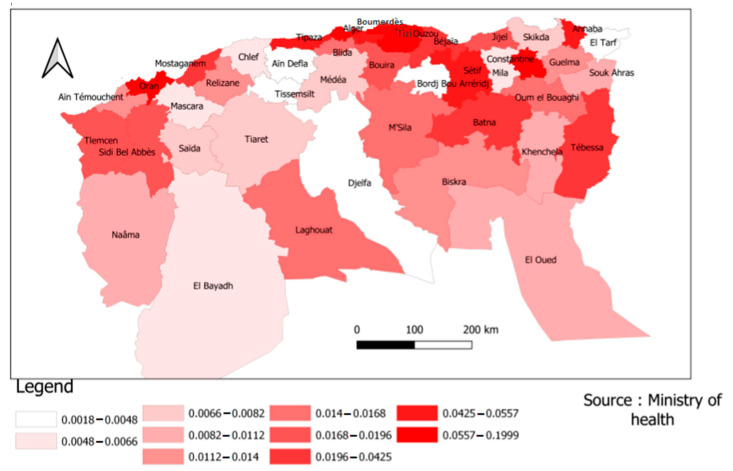
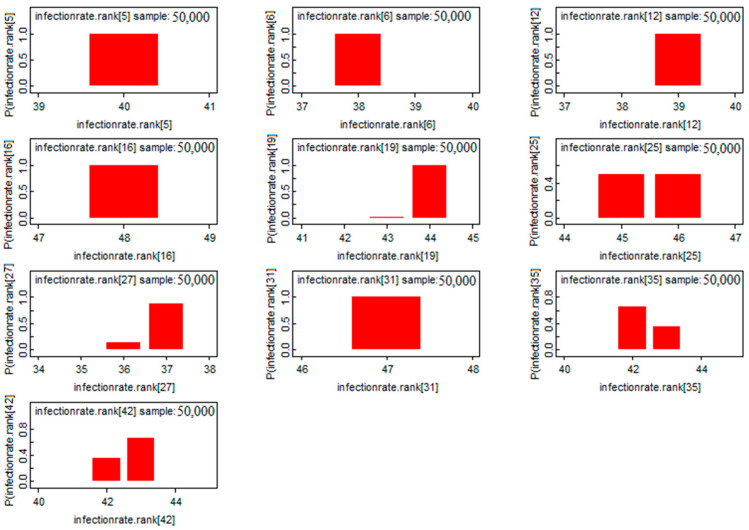
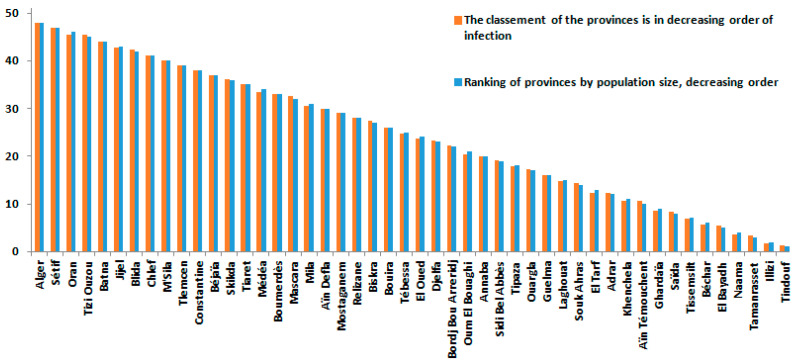
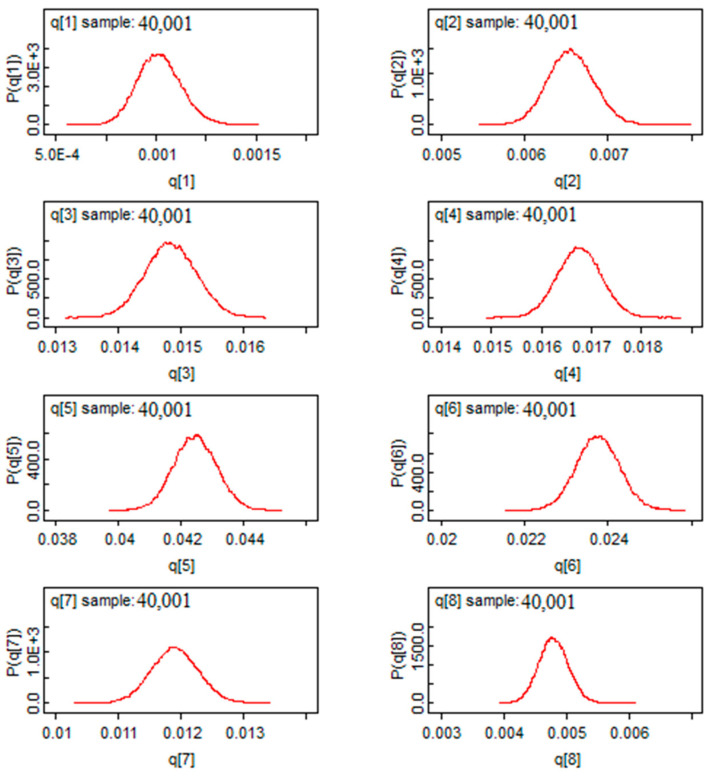
COVID-19 causes acute respiratory illness in humans. The direct consequence of the spread of the virus is the need to find appropriate and effective solutions to reduce its spread. Similar to other countries, the pandemic has spread in Algeria, with noticeable variation in mortality and infection rates between regions. We aimed to estimate the proportion of people who died or became infected with SARS-CoV-2 in each provinces using a Bayesian approach. The estimation parameters were determined using a binomial distribution along with an a priori distribution, and the results had a high degree of accuracy. The Bayesian model was applied during the third wave (1 January-15 August 2021), in all Algerian's provinces. For spatial analysis of duration, geographical maps were used. Our findings show that Tissemsilt, Ain Defla, Illizi, El Taref, and Ghardaia (Mean = 0.001) are the least affected provinces in terms of COVID-19 mortality. The results also indicate that Tizi Ouzou (Mean = 0.0694), Boumerdes (Mean = 0.0520), Annaba (Mean = 0.0483), Tipaza (Mean = 0.0524), and Tebessa (Mean = 0.0264) are more susceptible to infection, as they were ranked in terms of the level of corona infections among the 48 provinces of the country. Their susceptibility seems mainly due to the population density in these provinces. Additionally, it was observed that northeast Algeria, where the population is concentrated, has the highest infection rate. Factors affecting mortality due to COVID-19 do not necessarily depend on the spread of the pandemic. The proposed Bayesian model resulted in being useful for monitoring the pandemic to estimate and compare the risks between provinces. This statistical inference can provide a reasonable basis for describing future pandemics in other world geographical areas.
Keywords: Algeria; Bayesian approach; COVID-19; binomial model; mortality and infection rates.
Conflict of interest statement
The authors declare no conflict of interest. The funders had no role in the design of the study; in the collection, analyses, or interpretation of data; in the writing of the manuscript, or in the decision to publish the results.
Figures

References
-
- WHO Coronavirus (COVID-19) Dashboard. [(accessed on 30 July 2022)]. Available online: https://covid19.who.int.
-
- Gallè F., Sabella E.A., Roma P., Ferracuti S., Da Molin G., Diella G., Montagna M.T., Orsi G.B., Liguori G., Napoli C. Knowledge and Lifestyle Behaviors Related to COVID-19 Pandemic in People over 65 Years Old from Southern Italy. Int. J. Environ. Res. Public Health. 2021;18:10872. doi: 10.3390/ijerph182010872. - DOI - PMC - PubMed
-
- Giraldi G., Montesano M., Napoli C., Frati P., La Russa R., Santurro A., Scopetti M., Orsi G.B. Healthcare-Associated Infections Due to Multidrug-Resistant Organisms: A Surveillance Study on Extra Hospital Stay and Direct Costs. Curr. Pharm. Biotechnol. 2019;20:643–652. doi: 10.2174/1389201020666190408095811. - DOI - PubMed
-
- Gratz K.L., Tull M.T., Richmond J.R., Edmonds K.A., Scamaldo K.M., Rose J.P. Thwarted Belongingness and Perceived Burdensomeness Explain the Associations of COVID-19 Social and Economic Consequences to Suicide Risk. Suicide Life Threat. Behav. 2020;50:1140–1148. doi: 10.1111/sltb.12654. - DOI - PMC - PubMed
Publication types
MeSH terms
LinkOut - more resources
Full Text Sources
Medical
Miscellaneous
