

Hospitalization Costs of Respiratory Diseases Attributable to Temperature in Australia and Projections for Future Costs in the 2030s and 2050s under Climate Change
- PMID: 35955062
- PMCID: PMC9368165
- DOI: 10.3390/ijerph19159706
Hospitalization Costs of Respiratory Diseases Attributable to Temperature in Australia and Projections for Future Costs in the 2030s and 2050s under Climate Change
Abstract
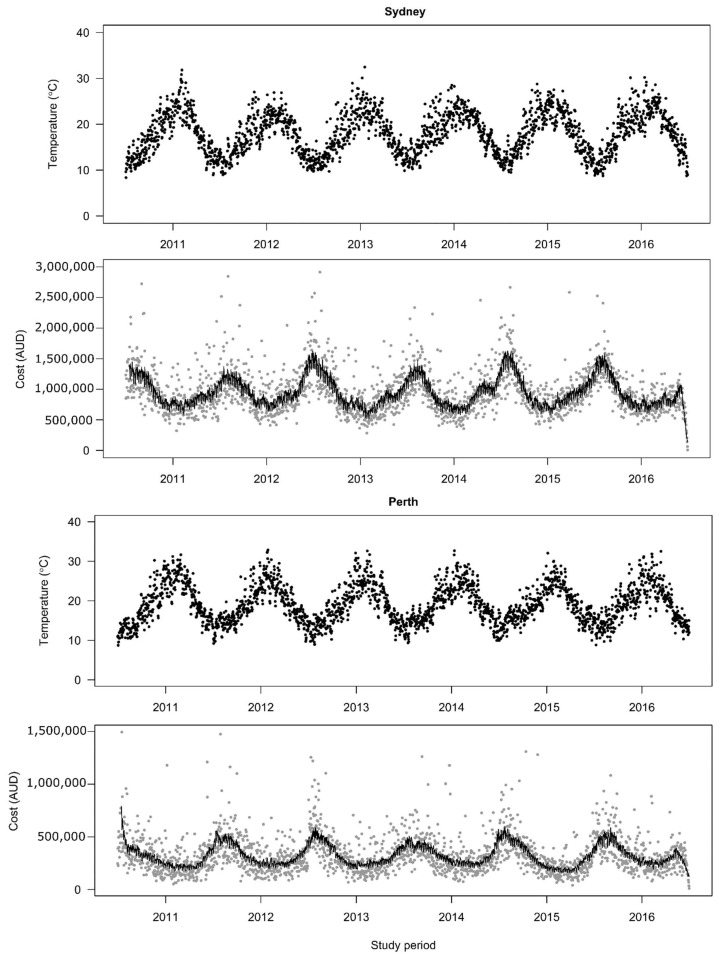
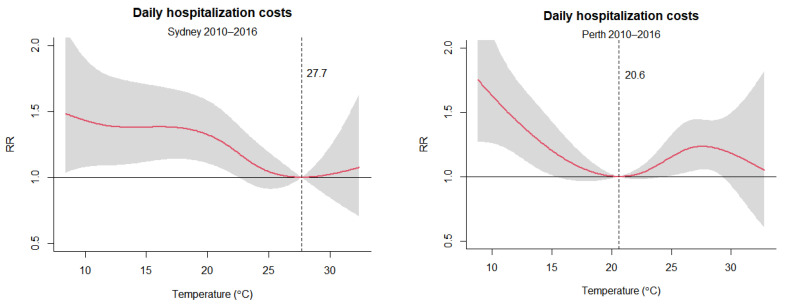
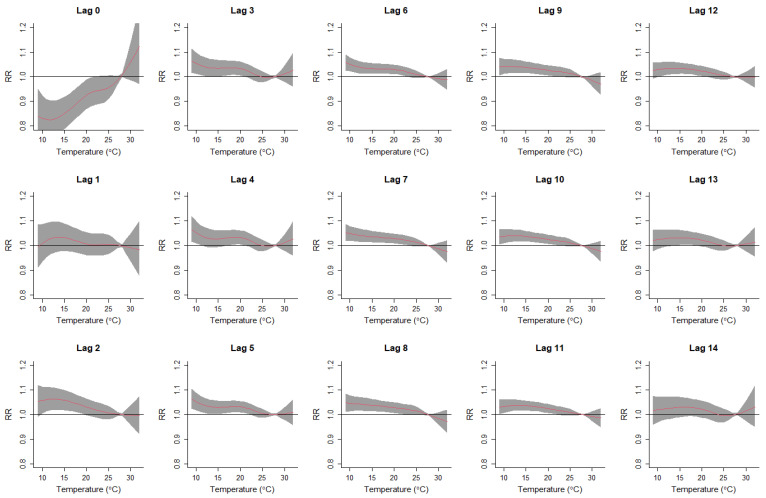
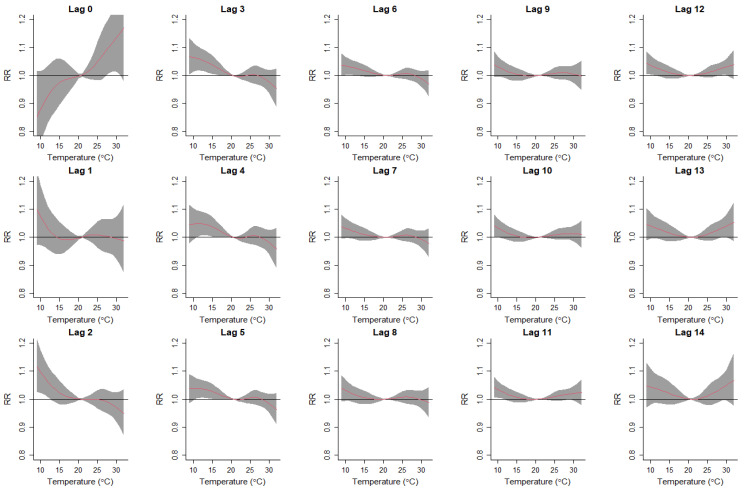
This study aimed to estimate respiratory disease hospitalization costs attributable to ambient temperatures and to estimate the future hospitalization costs in Australia. The associations between daily hospitalization costs for respiratory diseases and temperatures in Sydney and Perth over the study period of 2010-2016 were analyzed using distributed non-linear lag models. Future hospitalization costs were estimated based on three predicted climate change scenarios-RCP2.6, RCP4.5 and RCP8.5. The estimated respiratory disease hospitalization costs attributable to ambient temperatures increased from 493.2 million Australian dollars (AUD) in the 2010s to more than AUD 700 million in 2050s in Sydney and from AUD 98.0 million to about AUD 150 million in Perth. The current cold attributable fraction in Sydney (23.7%) and Perth (11.2%) is estimated to decline by the middle of this century to (18.1-20.1%) and (5.1-6.6%), respectively, while the heat-attributable fraction for respiratory disease is expected to gradually increase from 2.6% up to 5.5% in Perth. Limitations of this study should be noted, such as lacking information on individual-level exposures, local air pollution levels, and other behavioral risks, which is common in such ecological studies. Nonetheless, this study found both cold and hot temperatures increased the overall hospitalization costs for respiratory diseases, although the attributable fractions varied. The largest contributor was cold temperatures. While respiratory disease hospitalization costs will increase in the future, climate change may result in a decrease in the cold attributable fraction and an increase in the heat attributable fraction, depending on the location.
Keywords: climate change; hospitalization cost; respiratory diseases; temperature.
Conflict of interest statement
The authors declare no conflict of interest.
Figures
Similar articles
-
Projections of temperature-attributable mortality in Europe: a time series analysis of 147 contiguous regions in 16 countries.Lancet Planet Health. 2021 Jul;5(7):e446-e454. doi: 10.1016/S2542-5196(21)00150-9. Lancet Planet Health. 2021. PMID: 34245715
-
Understanding current and projected emergency department presentations and associated healthcare costs in a changing thermal climate in Adelaide, South Australia.Occup Environ Med. 2022 Jun;79(6):421-426. doi: 10.1136/oemed-2021-107888. Epub 2022 Apr 4. Occup Environ Med. 2022. PMID: 35379702
-
Projections of temperature-associated mortality risks under the changing climate in an ageing society.Public Health. 2023 Aug;221:23-30. doi: 10.1016/j.puhe.2023.05.017. Epub 2023 Jun 23. Public Health. 2023. PMID: 37356324
-
Impacts of exposure to ambient temperature on burden of disease: a systematic review of epidemiological evidence.Int J Biometeorol. 2019 Aug;63(8):1099-1115. doi: 10.1007/s00484-019-01716-y. Epub 2019 Apr 22. Int J Biometeorol. 2019. PMID: 31011886
-
The Economic Cost of Child and Adolescent Bullying in Australia.J Am Acad Child Adolesc Psychiatry. 2021 Mar;60(3):367-376. doi: 10.1016/j.jaac.2020.05.010. Epub 2020 Jun 30. J Am Acad Child Adolesc Psychiatry. 2021. PMID: 32619590
Cited by
-
Climate change and respiratory disease: clinical guidance for healthcare professionals.Breathe (Sheff). 2023 Jun;19(2):220222. doi: 10.1183/20734735.0222-2022. Epub 2023 Jul 11. Breathe (Sheff). 2023. PMID: 37492343 Free PMC article. Review.
-
Association between ambient temperature and genitourinary emergency ambulance dispatches in Japan: A nationwide case-crossover study.Environ Epidemiol. 2024 Feb 14;8(2):e298. doi: 10.1097/EE9.0000000000000298. eCollection 2024 Apr. Environ Epidemiol. 2024. PMID: 38617428 Free PMC article.
-
The Impact of Climate Change on Respiratory Care: A Scoping Review.J Clim Chang Health. 2024 May;17:10.1016/j.joclim.2024.100313. doi: 10.1016/j.joclim.2024.100313. J Clim Chang Health. 2024. PMID: 40895352 Free PMC article.
-
An Estimation of the Economic and Environmental Impact of Inhaler Devices Switch for Non-Clinical Reasons in COPD and Asthma: The Case for Spain.J Mark Access Health Policy. 2025 Jul 17;13(3):34. doi: 10.3390/jmahp13030034. eCollection 2025 Sep. J Mark Access Health Policy. 2025. PMID: 40709215 Free PMC article.
-
Associations between monthly temperature anomalies and mortality among children younger than five years in low- and middle-income countries.Commun Med (Lond). 2025 Aug 21;5(1):365. doi: 10.1038/s43856-025-01101-4. Commun Med (Lond). 2025. PMID: 40841773 Free PMC article.
References
-
- Hawkins E., Ortega P., Suckling E., Schurer A., Hegerl G., Jones P., Joshi M., Osborn T.J., Masson-Delmotte V., Mignot J., et al. Estimating Changes in Global Temperature since the Preindustrial Period. Bull. Am. Meteorol. Soc. 2017;98:1841–1856. doi: 10.1175/BAMS-D-16-0007.1. - DOI
-
- Costello A., Abbas M., Allen A., Ball S., Bell S., Bellamy R., Friel S., Groce N., Johnson A., Kett M., et al. Managing the health effects of climate change: Lancet and University College London Institute for Global Health Commission. Lancet. 2009;373:1693–1733. doi: 10.1016/S0140-6736(09)60935-1. - DOI - PubMed
Publication types
MeSH terms
LinkOut - more resources
Full Text Sources
