. 2022 Aug 8;19(15):9753.
doi: 10.3390/ijerph19159753.

Hymenolepis diminuta Infection Affects Apoptosis in the Small and Large Intestine

Affiliations

Hymenolepis diminuta Infection Affects Apoptosis in the Small and Large Intestine

Patrycja Kapczuk et al. Int J Environ Res Public Health. .

Abstract

The rat tapeworm Hymenolepis diminuta has been shown to cause alterations in gastrointestinal tissues. Since hymenolepiasis induces a number of reactions in the host, it is reasonable to assume that it may also be involved in the mechanisms of apoptosis in the intestines. Individual research tasks included an examination of the effect of H. diminuta infection on; (i) the cellular localization of the expression of pro-apoptotic protein Bax and anti-apoptotic protein Bcl-2, as well as caspase-3 and caspase-9, and (ii) the effects of the infection on the expression of Bcl-2, Bax, Cas-3 and Cas-9, at the mRNA and protein levels. Molecular tests (including mRNA (qRT PCR) and the protein (Western blot) expression of Bax, Bcl-2, and caspases-3, -9) and immunohistochemical tests were performed during the experiment. They showed that H. diminuta infection activates the intrinsic apoptosis pathway in the small and large intestine of the host. H. diminuta infection triggered the apoptosis via the activation of the caspase cascade, including Cas-3 and Cas-9. Hymenolepiasis enhanced apoptosis in the small and large intestine of the host by increasing the expression of the pro-apoptotic gene and protein Bax and by decreasing the expression of the anti-apoptotic gene and protein Bcl-2.

Keywords: apoptosis; hymenolepiasis; parasite–host system; rat.


Conflict of interest statement

The authors declare no conflict of interest.

Figures
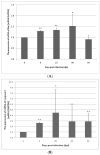
Figure 1
Figure 1
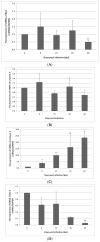
Expression of Bax (A), caspase-3 (B), caspase-9 (C), and Bcl-2 (D) genes at the mRNA level in the small intestine from uninfected and H. diminuta-infected rats. Data represent the arithmetic mean ± SD and are representative of individual groups of six animals in each experiment. Statistical analysis was performed using the Kruskal–Wallis test, * p < 0.05, ** p < 0.01 vs. 0 dpi.
Figure 1
Figure 1
Expression of Bax (A), caspase-3 (B), caspase-9 (C), and Bcl-2 (D) genes at the mRNA level in the small intestine from uninfected and H. diminuta-infected rats. Data represent the arithmetic mean ± SD and are representative of individual groups of six animals in each experiment. Statistical analysis was performed using the Kruskal–Wallis test, * p < 0.05, ** p < 0.01 vs. 0 dpi.
Figure 2
Figure 2
Expression of Bax (A), caspase-3 (B), caspase-9 (C), and Bcl-2 (D) genes at the mRNA level in the colon from uninfected and H. diminuta-infected rats. Data represent the arithmetic mean ± SD and are representative of individual groups of six animals in each experiment. Statistical analysis was performed using the Kruskal–Wallis test, * p < 0.05, ** p < 0.01 vs. 0 dpi.
Figure 3
Figure 3
Representative Western blot bands and densitometric analysis of Bax protein level in the small intestine (A) and large intestine (B) from uninfected and H. diminuta-infected rats. Data represent the arithmetic mean ± SD and are representative of individual groups of six animals in each experiment. Statistical analysis was performed using the Kruskal–Wallis test, * p < 0.05, vs. 0 dpi.
Figure 4
Figure 4
Representative Western blot bands and densitometric analysis of the Bcl-2 protein level in the small intestine (A) and large intestine (B) from uninfected and H. diminuta-infected rats. Data represent the arithmetic mean ± SD and are representative of individual groups of six animals in each experiment. Statistical analysis was performed using the Kruskal–Wallis test, * p < 0.05, vs. 0 dpi.
Figure 5
Figure 5
Representative Western blot bands and densitometric analysis of the caspase-3 protein level in the small intestine (A) and large intestine (B) from uninfected and H. diminuta-infected rats. Data represent the arithmetic mean ± SD and are representative of individual groups of six animals in each experiment. Statistical analysis was performed using the Kruskal–Wallis test, * p < 0.05 vs. 0 dpi.
Figure 6
Figure 6
Representative Western blot bands and densitometric analysis of the caspase-9 protein level in the small intestine (A) and large intestine (B) from uninfected and H. diminuta-infected rats. Data represent the arithmetic mean ± SD and are representative of individual groups of six animals in each experiment. Statistical analysis was performed using the Kruskal–Wallis test, * p < 0.05 vs. 0 dpi.
Figure 7
Figure 7
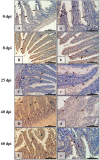
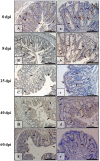
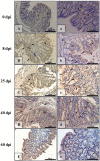
Representative microphotographs showing Bax immunoexpression in the small intestine of control animals (A,a) and on subsequent days (B,b,C,c,D,d,E,e) after H. diminuta infection. Positive IHC reaction—brown reaction marked with arrows: red—epithelial cells of the villi and intestinal crypts, blue and white—cells in the connective tissue lining of the mucosa, green—intraepithelial lymphocytes. Lens magnification: ×20 (AE, scale bar: 200 µm), ×40 (ae, scale bar: 100 µm).
Figure 8
Figure 8
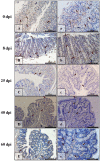
Representative microphotographs showing Bax immunoexpression in the colon of control animals (A,a) and on consecutive days (B,b,C,c,D,d,E,e) after H. diminuta infection. Positive IHC reaction—brown reaction indicated by arrows: red—epithelial cells of the intestinal villi and crypts, blue and white—cells in the connective tissue lining of the mucosa. Lens magnification: ×20 (AE, scale bar: 200 µm), ×40 (ae, scale bar: 100 µm).
Figure 9
Figure 9
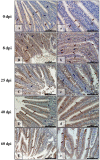
Representative microphotographs showing Bcl-2 immunoexpression in the small intestine of control animals (A,a) and on consecutive days (B,b,C,c,D,d,E,e) after H. diminuta infection. Positive IHC reaction—brown reaction marked with arrows: red—epithelial cells of the villi and intestinal crypts, blue and white—cells in the connective tissue lining of the mucosa. Lens magnification: ×20 (AE, scale bar: 200 µm), ×40 (ae, scale bar: 100 µm).
Figure 10
Figure 10
Representative microphotographs showing Bcl-2 immunoexpression in the colon of control animals (A,a) and on consecutive days (B,b,C,c,D,d,E,e) after H. diminuta infection. Positive IHC reaction—brown reaction indicated by arrows: red—epithelial cells of the intestinal villi and crypts, blue—cells in the connective tissue lining of the mucosa,. Lens magnification: ×20 (AE, scale bar: 200 µm), ×40 (ae, scale bar: 100 µm).
Figure 11
Figure 11
Representative microphotographs showing caspase-3 immunoexpression in the small intestine of control animals (A,a) and on subsequent days (B,b,C,c,D,d,E,e) after H. diminuta infection. Positive IHC reaction—brown reaction marked with arrows: red—epithelial cells of the villi and intestinal crypts, blue and white—cells in the connective tissue lining of the mucosa. Lens magnification: ×20 (AE, scale bar: 200 µm), ×40 (ae, scale bar: 100 µm).
Figure 12
Figure 12
Representative microphotographs showing caspase-3 immunoexpression in the colon of control animals (A,a) and on consecutive days (B,b,C,c,D,d,E,e) after H. diminuta infection. Positive IHC reaction—brown reaction indicated by arrows: red—epithelial cells of the intestinal villi and crypts, blue and white—cells in the connective tissue lining of the mucosa,. Lens magnification: ×20 (AE, scale bar: 200 µm), ×40 (ae, scale bar: 100 µm).
Figure 13
Figure 13
Representative microphotographs showing caspase-9 immunoexpression in the small intestine of control animals (A,a) and on subsequent days (B,b,C,c,D,d,E,e) after H. diminuta infection. Positive IHC reaction—brown reaction marked with arrows: red—epithelial cells of the villi and intestinal crypts, blue and white—cells in the connective tissue lining of the mucosa. Lens magnification: ×20 (AE, scale bar: 200 µm), ×40 (ae, scale bar: 100 µm).
Figure 14
Figure 14
Representative microphotographs showing caspase-9 immunoexpression in the colon of control animals (A,a) and on consecutive days (B,b,C,c,D,d,E,e) after H. diminuta infection. Positive IHC reaction—brown reaction indicated by arrows: red—epithelial cells of the intestinal villi and crypts, blue—cells in the connective tissue lining of the mucosa. Lens magnification: ×20 (AE, scale bar: 200 µm), ×40 (ae, scale bar: 100 µm).

Similar articles

Cited by

References

    1. Panti-May J.A., Rodríguez-Vivas R.I., García-Prieto L. Worldwide overview of human infections with Hymenolepis diminuta. Parasitol. Res. 2020;119:1997–2004. doi: 10.1007/s00436-020-06663-x. - DOI - PubMed
    1. Kapczuk P., Chlubek D., Baranowska-Bosiacka I. Epidemiological and clinical characteristic of Hymenolepis diminuta infection—review of current literature. Pomeranian J. Life Sci. 2020;66:32–38. doi: 10.21164/pomjlifesci.664. - DOI
    1. Fal W., Czaplicka H. Effect of experimental hymenolepiasis on various tissue reactions in rats. Wiad. Parazytol. 1991;37:331–342. - PubMed
    1. Maizels R.M., Balic A., Gomez-Escobar N., Nair M., Taylor M.D., Allen J.E. Helminth parasites: Masters of regulation. Immunol. Rev. 2004;201:89–116. doi: 10.1111/j.0105-2896.2004.00191.x. - DOI - PubMed
    1. Smallwood T.B., Giacomin P.R., Loukas A., Mulvenna J.P., Clark R.J., Miles J.J. Helminth Immunomodulation in Autoimmune Disease. Front. Immunol. 2017;8:453. doi: 10.3389/fimmu.2017.00453. - DOI - PMC - PubMed

Publication types