. 2022 Jul 27;23(15):8276.
doi: 10.3390/ijms23158276.

BPA Decreases PDCD4 in Bovine Granulosa Cells Independently of miR-21 Inhibition

Affiliations

BPA Decreases PDCD4 in Bovine Granulosa Cells Independently of miR-21 Inhibition

Reem Sabry et al. Int J Mol Sci. .

Abstract

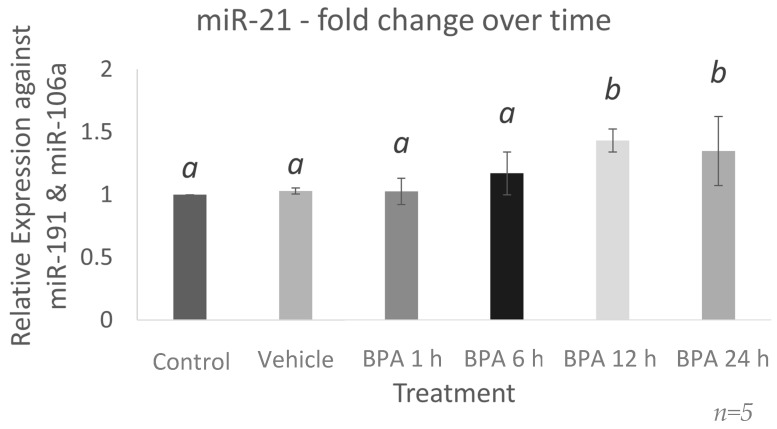
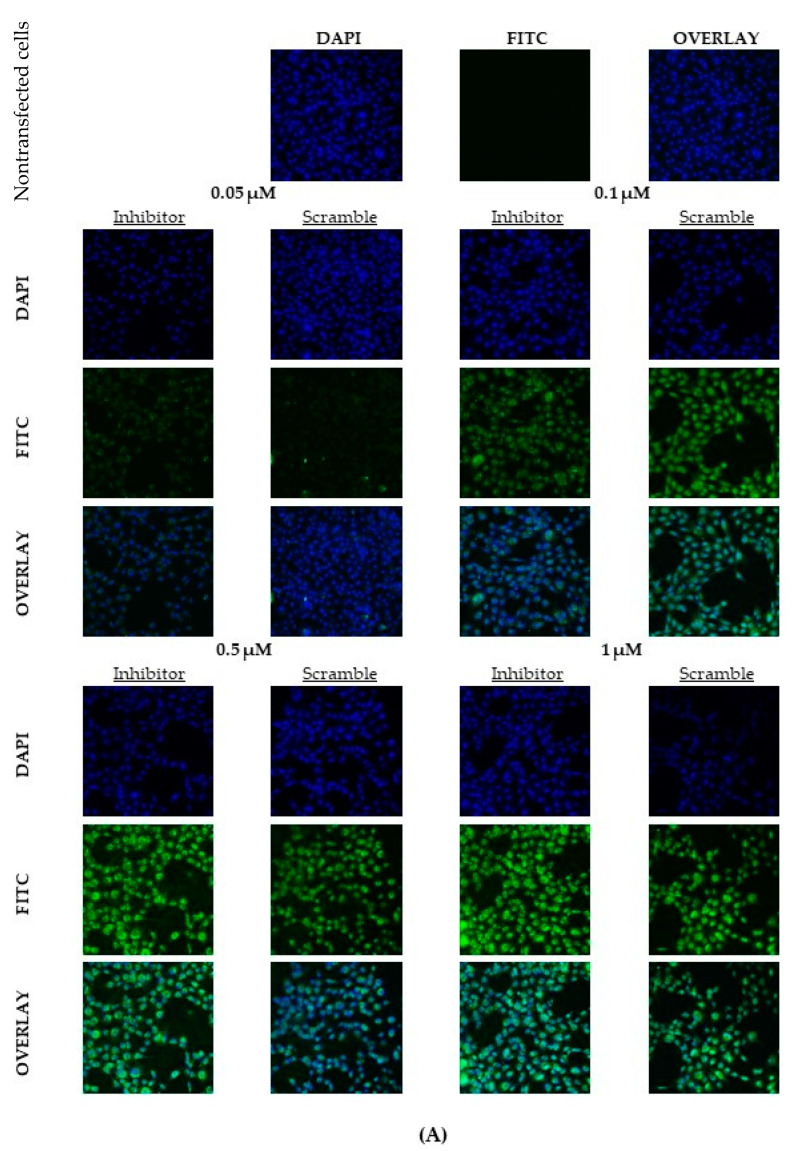
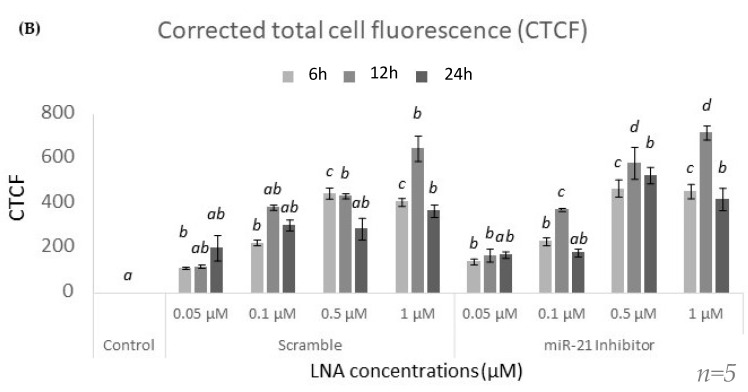
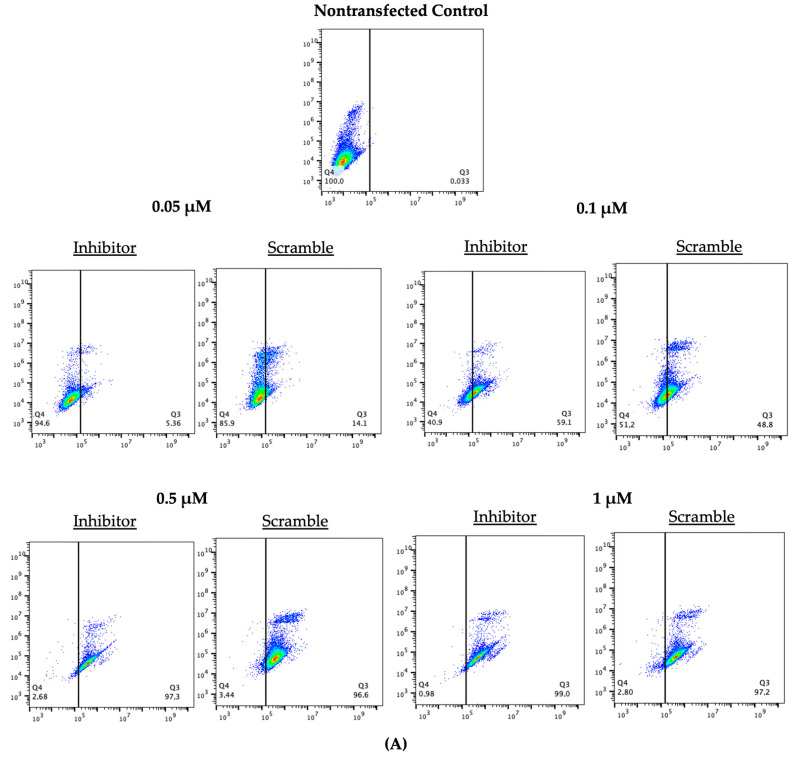
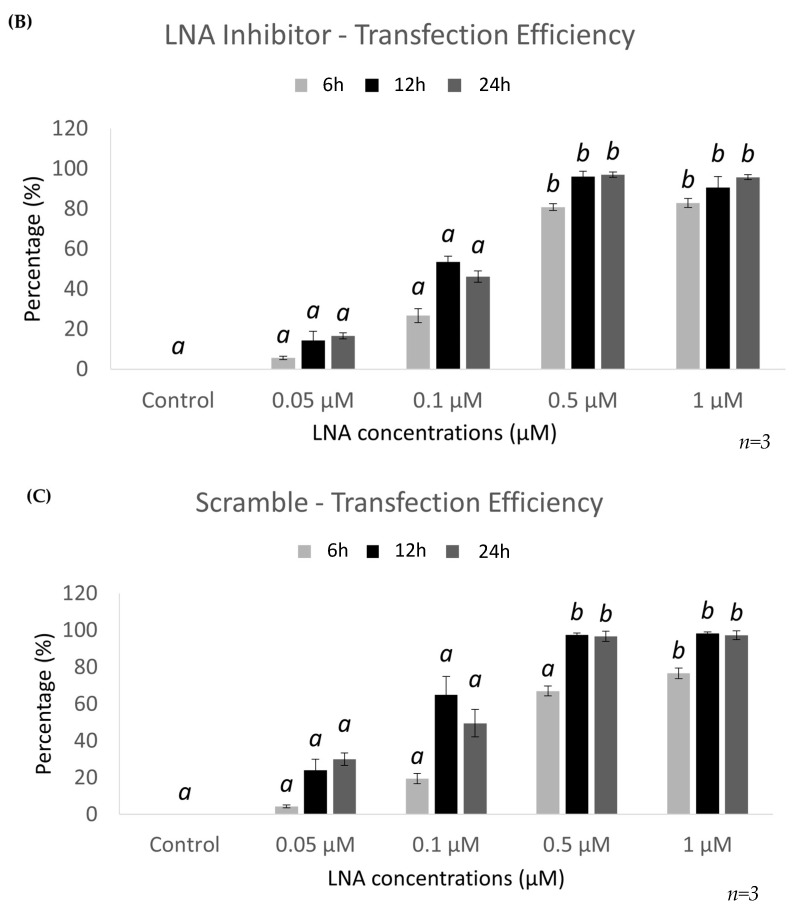
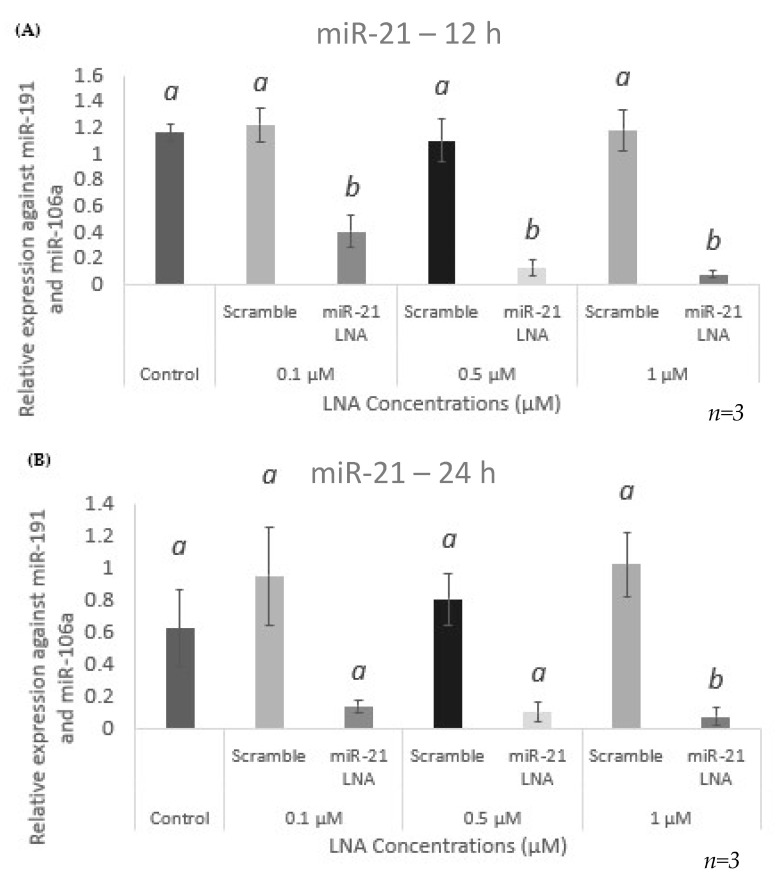
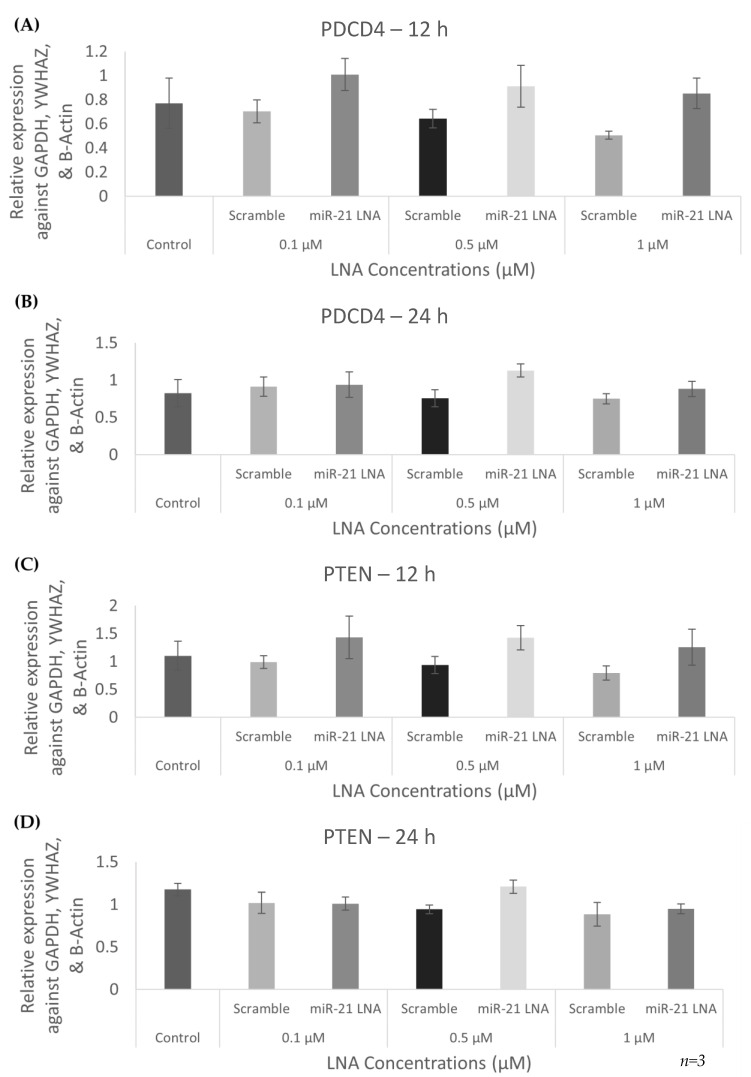
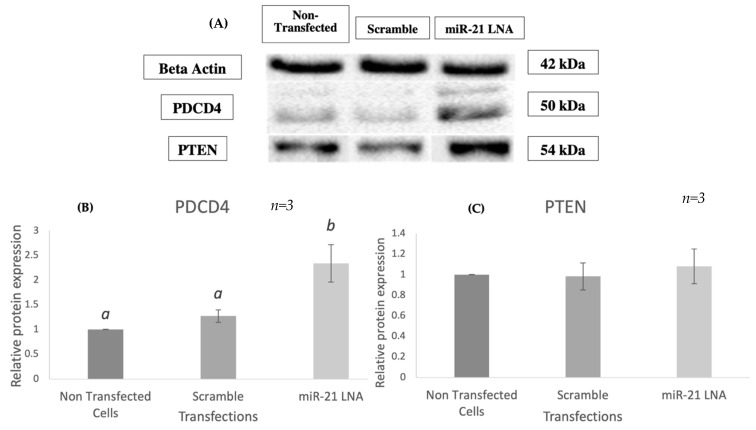
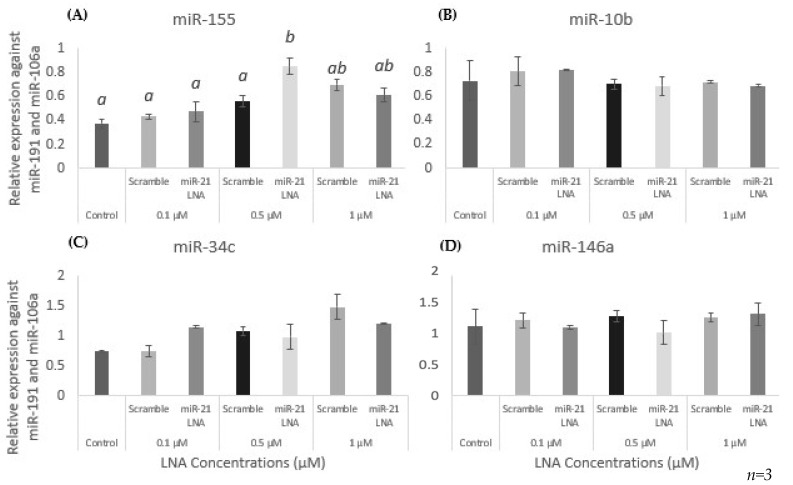
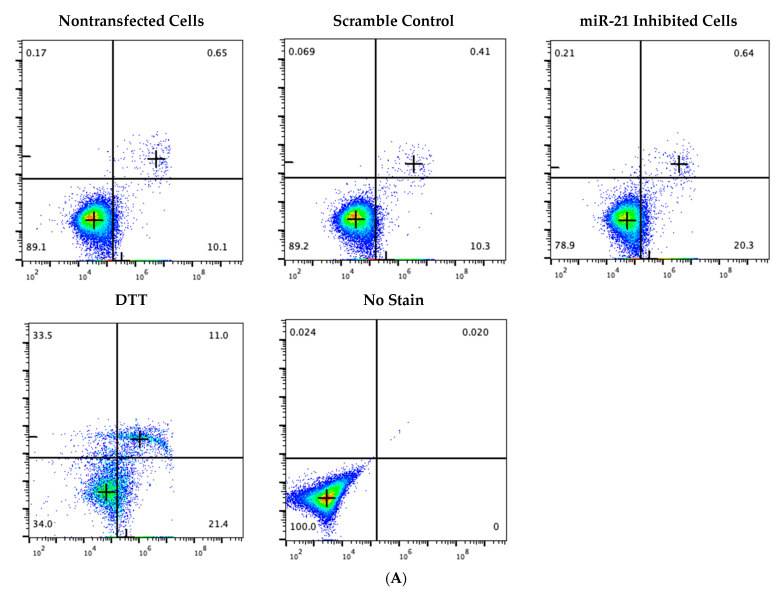
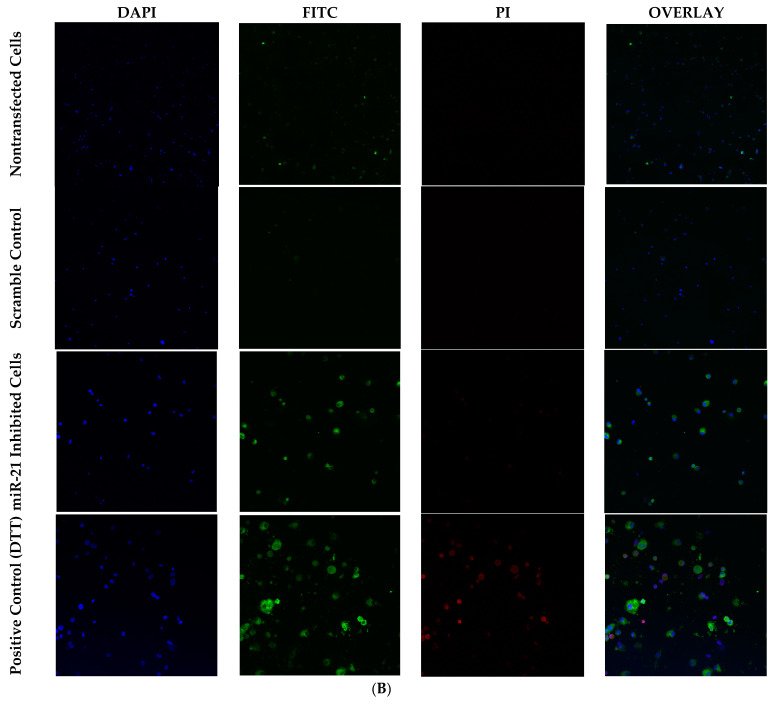
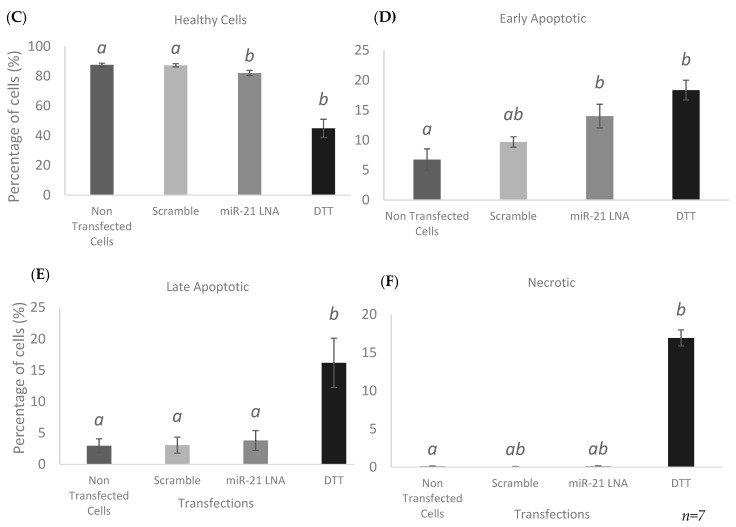
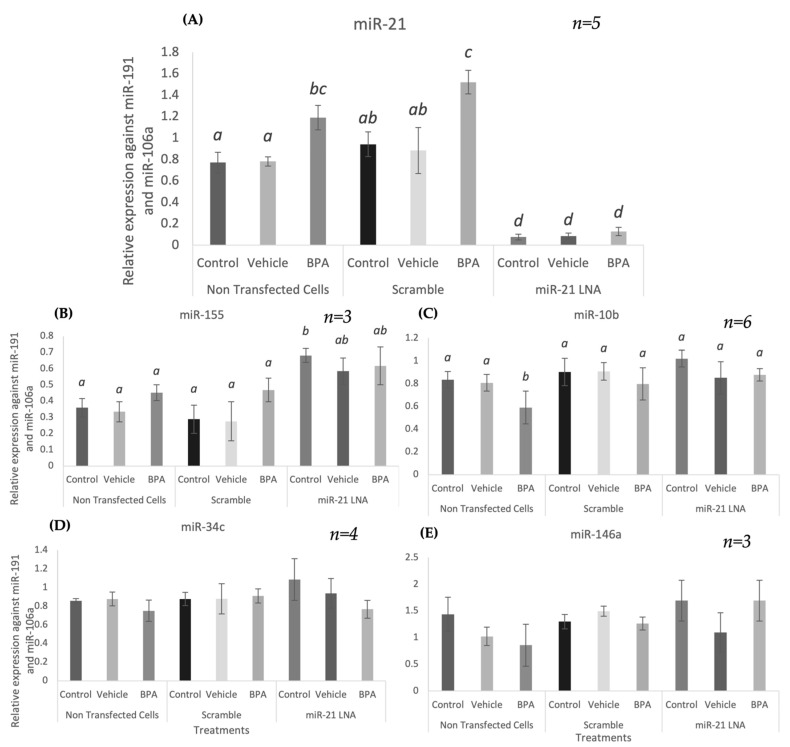
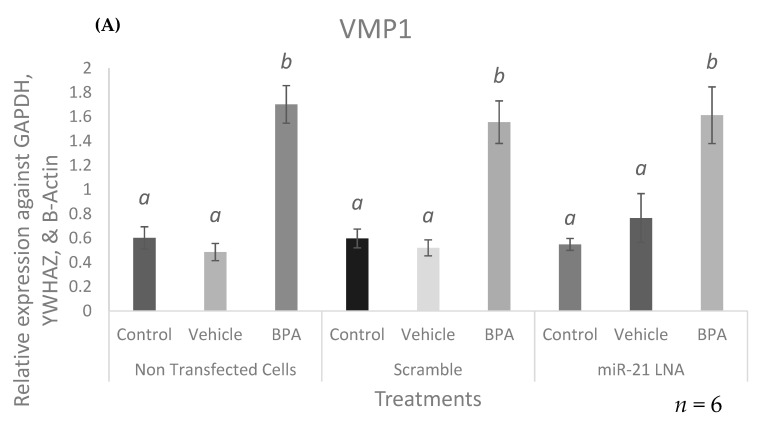
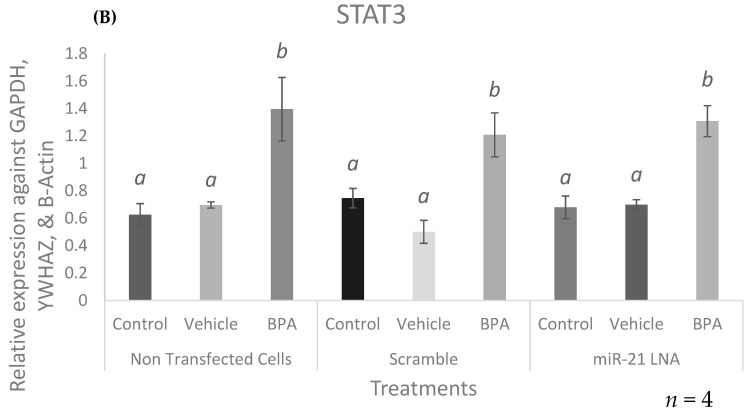
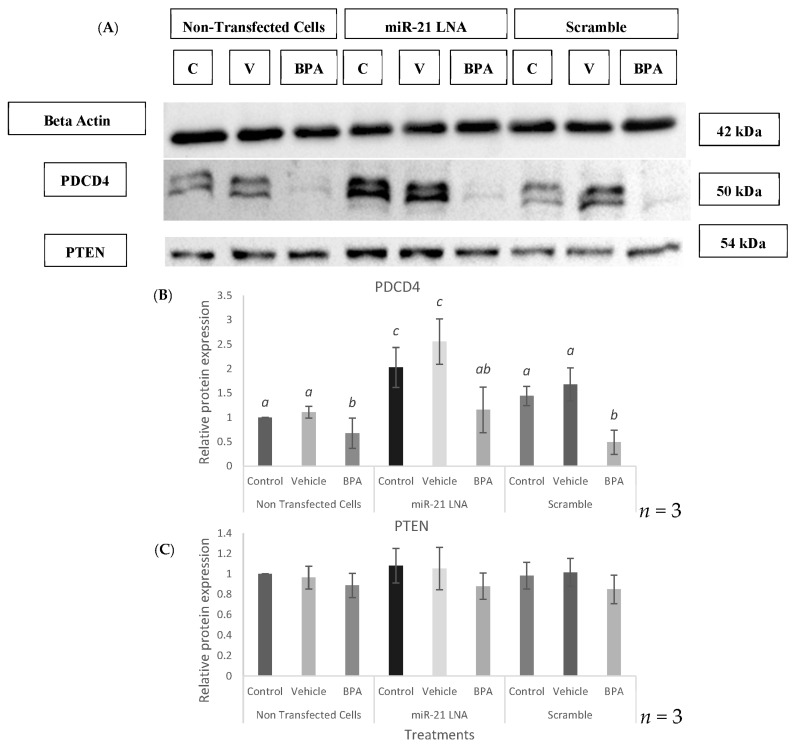
microRNAs (miRNAs) are susceptible to environmental factors that might affect cellular function and impose negative effects on female reproduction. miR-21 is the most abundant miRNA in bovine granulosa cells and is widely reported as affected by Bisphenol A (BPA) exposure, yet the cause and consequences are not entirely elucidated. BPA is a synthetic endocrine disruptor associated with poor fertility. miR-21 function in bovine granulosa cells is investigated utilizing locked nucleic acid (LNA) oligonucleotides to suppress miR-21. Before measuring apoptosis and quantifying miR-21 apoptotic targets PDCD4 and PTEN, transfection was optimized and validated. BPA was introduced to see how it affects miR-21 regulation and which BPA-mediated effects are influenced by miR-21. miR-21 knockdown and specificity against additional miRNAs were confirmed. miR-21 was found to have antiapoptotic effects, which could be explained by its effect on the proapoptotic target PDCD4, but not PTEN. Previous findings of miR-21 overexpression were validated using BPA treatments, and the temporal influence of BPA on miR-21 levels was addressed. Finally, BPA effects on upstream regulators, such as VMP1 and STAT3, explain the BPA-dependent upregulation of miR-21 expression. Overall, this research enhances our understanding of miR-21 function in granulosa cells and the mechanisms of BPA-induced reproductive impairment.

Keywords: BPA; PDCD4; PTEN; apoptosis; granulosa cells; miR-21.


Conflict of interest statement

The authors declare no conflict of interest.

Figures

Figure 1
Figure 1
mi-21-fold change over time after BPA treatment. miR-21 significantly increased after 12 and 24 h of BPA treatment. All samples originated from in vitro cultured granulosa cells treated with 0.05 mg/mL BPA for 1, 6, 12, and 24 h. Quantification is relative to reference targets miR-191 and miR-106a. Different letters indicate significant differences, with b indicating a significantly different mean than a at p < 0.05. Bars represent the mean ± SEM.
Figure 2
Figure 2
Confocal microscopy of LNAs at different concentrations and quantification of fluorescence intensities. Transfections with FAM-labeled LNA probes at 0.05 μM, 0.1 μM, 0.5 μM, and 1 μM for 6, 12, and 24 h. (A) depicts a representation of confocal images taken at 12 h post transfection. In vitro cultured granulosa cells were transfected, fixed on slides, counterstained with Hoescht stain, and imaged on an Olympus FV1200 Confocal Microscope. Quantification was done through the ImageJ software; the CTCF (B) showed significantly increased transfection efficiencies at the higher concentrations (0.5 μM and 1 μM). Different letters indicate significant differences, with b indicating a significantly different mean than a at p < 0.001 and c indicating a significantly different mean than a and b at p < 0.05. ab indicates no differences between a or b. Bars represent the mean ± SEM.
Figure 2
Figure 2
Confocal microscopy of LNAs at different concentrations and quantification of fluorescence intensities. Transfections with FAM-labeled LNA probes at 0.05 μM, 0.1 μM, 0.5 μM, and 1 μM for 6, 12, and 24 h. (A) depicts a representation of confocal images taken at 12 h post transfection. In vitro cultured granulosa cells were transfected, fixed on slides, counterstained with Hoescht stain, and imaged on an Olympus FV1200 Confocal Microscope. Quantification was done through the ImageJ software; the CTCF (B) showed significantly increased transfection efficiencies at the higher concentrations (0.5 μM and 1 μM). Different letters indicate significant differences, with b indicating a significantly different mean than a at p < 0.001 and c indicating a significantly different mean than a and b at p < 0.05. ab indicates no differences between a or b. Bars represent the mean ± SEM.
Figure 3
Figure 3
Flow Cytometry of LNAs at different concentrations. Transfections with FAM-labeled LNA probes at 0.05 μM, 0.1 μM, 0.5 μM, and 1 μM for 6, 12, and 24 h. (A) depicts a representation of flow cytometry scatter plots measured at 12 h post transfection. In vitro cultured granulosa cells were transfected, trypsinized, counterstained with Hoescht stain, and run through a BD Accuri C6 Flow Cytometer. Transfection efficiencies of the inhibitor (B) and the scramble (C) showed significantly increased transfection efficiencies at the higher concentrations (0.5 μM and1 μM). Different letters indicate significant differences, with b indicating a significantly different mean than a at p < 0.05. Bars represent the mean ± SEM.
Figure 3
Figure 3
Flow Cytometry of LNAs at different concentrations. Transfections with FAM-labeled LNA probes at 0.05 μM, 0.1 μM, 0.5 μM, and 1 μM for 6, 12, and 24 h. (A) depicts a representation of flow cytometry scatter plots measured at 12 h post transfection. In vitro cultured granulosa cells were transfected, trypsinized, counterstained with Hoescht stain, and run through a BD Accuri C6 Flow Cytometer. Transfection efficiencies of the inhibitor (B) and the scramble (C) showed significantly increased transfection efficiencies at the higher concentrations (0.5 μM and1 μM). Different letters indicate significant differences, with b indicating a significantly different mean than a at p < 0.05. Bars represent the mean ± SEM.
Figure 4
Figure 4
mi-21 expression at different LNA concentrations. miR-21 was significantly decreased in all three concentrations tested at 12 h but the difference was only significant for 1 μM at 24 h. Transfections with LNA probes at 0.1 μM, 0.5 μM, and 1 μM for 12 h (A) and 24 h (B). Quantification is relative to reference targets miR-191 and miR-106a. Different letters indicate significant differences, with b indicating a significantly different mean than a at p < 0.001. Bars represent the mean ± SEM.
Figure 5
Figure 5
Expression of mRNA targets at different LNA concentrations. PDCD4 (A,B) and PTEN (C,D) transcripts were unaffected by miR-21 LNA transfections. Cells were transfected with LNA probes at 0.1 μM, 0.5 μM, and 1 μM for 12 h (A,C) and 24 h (B,D). Quantification is relative to reference genes YWHAZ and b-actin. Bars represent the mean ± SEM.
Figure 6
Figure 6
Relative protein expression of PDCD4 & PTEN after miR-21 inhibition. Western blots (A) and graphical representations of PDCD4 (B) and PTEN (C) revealed that miR-21 inhibition significantly increased PDCD4 protein levels but did not affect PTEN. Transfections were done with LNA inhibitor probes at 0.5 μM for 12 h. Densitometric analysis was performed relative to the loading control, β-actin. PTEN representation contains lane rearrangement; full original PTEN blot is included in the Supplementary File (Figure S4). Different letters indicate significant differences, with b indicating a significantly different mean than a at p < 0.005. Bars represent the mean ± SEM.
Figure 7
Figure 7
Expression of other miRNAs at different LNA concentrations. miR-155 (A) was the only miRNA with induced expression after miR-21 LNA treatment at 0.5 μM. All other miRNAs: miR-10b (B), miR-34c (C), and miR-146a (D) were unaffected. Transfections with LNA probes at 0.1 μM, 0.5 μM, and 1 μM for 12 h. Quantification is relative to reference targets miR-191 and miR-106a. Different letters indicate significant differences, with b indicating a significantly different mean than a at p < 0.001. ab indicates no differences between a or b. Bars represent the mean ± SEM.
Figure 8
Figure 8
Annexin V/PI staining for apoptosis detection after miR-21 LNA treatment. Transfected cells were stained with Annexin V and PI to measure apoptosis using flow cytometry. Flow scatter plots (A), fluorescent images (B), and FlowJo quantification results (CF) show that miR-21 inhibition decreases and increases the percentage of healthy cells (C) and early apoptotic cells (D), respectively, like the positive control, DTT. Different letters indicate significant differences, with b indicating a significantly different mean than a at p < 0.05. ab indicates no differences between a or b. Bars represent the mean ± SEM.
Figure 8
Figure 8
Annexin V/PI staining for apoptosis detection after miR-21 LNA treatment. Transfected cells were stained with Annexin V and PI to measure apoptosis using flow cytometry. Flow scatter plots (A), fluorescent images (B), and FlowJo quantification results (CF) show that miR-21 inhibition decreases and increases the percentage of healthy cells (C) and early apoptotic cells (D), respectively, like the positive control, DTT. Different letters indicate significant differences, with b indicating a significantly different mean than a at p < 0.05. ab indicates no differences between a or b. Bars represent the mean ± SEM.
Figure 9
Figure 9
Expression of miRNAs after miR-21 inhibition and BPA treatment. Cells were transfected with LNA probes at 0.5 μM for 12 h then treated with BPA (0.05 mg/mL) for another 12 h. BPA and miR-21 LNAs continue to increase and decrease miR-21 expression, respectively (A). BPA decreased miR-10b (B) and miR-155 (C) remained upregulated after miR-21 LNA treatment at 0.5 μM. All other miRNAs: miR-34c (D), and miR-146a (E) were unaffected by both treatments. Quantification is relative to reference targets miR-191 and miR-106a. Different letters indicate significant differences, with b indicating a significantly different mean than a at p < 0.05, c indicating a significantly different mean than a and b, and d indicating a significantly different mean than a, b, and c at p < 0.05. ab indicates no differences between a or b and bc indicates no differences between b or c. Bars represent the mean ± SEM.
Figure 10
Figure 10
mRNA expression of modulators upstream of miR-21 transcription. Cells were transfected with LNA probes at 0.5 μM for 12 h then treated with BPA for another 12 h. Upstream miR-21 regulators, VMP1 (A), and STAT3 (B) were upregulated after BPA treatment. Quantification is relative to reference genes GAPDH, YWHAZ, and B-Actin. Different letters indicate significant differences, with b indicating a significantly different mean than a at p < 0.05. Bars represent the mean ± SEM.
Figure 10
Figure 10
mRNA expression of modulators upstream of miR-21 transcription. Cells were transfected with LNA probes at 0.5 μM for 12 h then treated with BPA for another 12 h. Upstream miR-21 regulators, VMP1 (A), and STAT3 (B) were upregulated after BPA treatment. Quantification is relative to reference genes GAPDH, YWHAZ, and B-Actin. Different letters indicate significant differences, with b indicating a significantly different mean than a at p < 0.05. Bars represent the mean ± SEM.
Figure 11
Figure 11
Target mRNA expression of PDCD4 and PTEN after miR-21 LNA and BPA treatment. Cells were transfected with LNA probes at 0.5 μM for 12 h then treated with BPA for another 12 h. PDCD4 (A), and PTEN (B) were significantly increased after BPA treatment. Quantification is relative to reference genes GAPDH, YWHAZ, and B-Actin. Different letters indicate significant differences, with b indicating a significantly different mean than a at p < 0.05. Bars represent the mean ± SEM.
Figure 12
Figure 12
Relative protein expression of PDCD4 & PTEN after miR-21 inhibition and BPA treatment. Western blots (A) and graphical representations of PDCD4 (B) and PTEN (C) revealed that BPA decreased PDCD4 protein, but miR-21 LNA treatment increased it. Neither BPA nor miR-21 LNA treatment affected PTEN protein. Transfections were done with LNA inhibitor probes at 0.5 μM for 12 h followed by BPA treatment for another 12 h. Densitometric analysis was performed relative to the loading control, B-actin. Different letters indicate significant differences, with b indicating a significantly different mean than a at p < 0.05 and c indicating a significantly different mean than a and b at p < 0.05. ab indicates no differences between a or b. Bars represent the mean ± SEM.

References

    1. Li Y. Modern Epigenetics Methods in Biological Research. Methods. 2021;187:104–113. doi: 10.1016/j.ymeth.2020.06.022. - DOI - PMC - PubMed
    1. Vazquez M.J., Daza-Dueñas S., Tena-Sempere M. Emerging Roles of Epigenetics in the Control of Reproductive Function: Focus on Central Neuroendocrine Mechanisms. J. Endocr. Soc. 2021;5:bvab152. doi: 10.1210/jendso/bvab152. - DOI - PMC - PubMed
    1. Bhatti G.K., Khullar N., Sidhu I.S., Navik U.S., Reddy A.P., Reddy P.H., Bhatti J.S. Emerging Role of Non-coding RNA in Health and Disease. Metab. Brain Dis. 2021;36:1119–1134. doi: 10.1007/s11011-021-00739-y. - DOI - PMC - PubMed
    1. Tu J., Cheung A.H.H., Chan C.L.K., Chan W.Y. The Role of MicroRNAs in Ovarian Granulosa Cells in Health and Disease. Front. Endocrinol. 2019;10:174. doi: 10.3389/fendo.2019.00174. - DOI - PMC - PubMed
    1. He M., Zhang T., Yang Y., Wang C. Mechanisms of Oocyte Maturation and Related Epigenetic Regulation. Front. Cell Dev. Biol. 2021;9:654028. doi: 10.3389/fcell.2021.654028. - DOI - PMC - PubMed