. 2022 Jul 27;23(15):8308.
doi: 10.3390/ijms23158308.

Chlorhexidine Promotes Psl Expression in Pseudomonas aeruginosa That Enhances Cell Aggregation with Preserved Pathogenicity Demonstrates an Adaptation against Antiseptic

Affiliations

Chlorhexidine Promotes Psl Expression in Pseudomonas aeruginosa That Enhances Cell Aggregation with Preserved Pathogenicity Demonstrates an Adaptation against Antiseptic

Uthaibhorn Singkham-In et al. Int J Mol Sci. .

Abstract

Because Pseudomonas aeruginosa is frequently in contact with Chlorhexidine (a regular antiseptic), bacterial adaptations are possible. In comparison with the parent strain, the Chlorhexidine-adapted strain formed smaller colonies with metabolic downregulation (proteomic analysis) with the cross-resistance against colistin (an antibiotic for several antibiotic-resistant bacteria), partly through the modification of L-Ara4N in the lipopolysaccharide at the outer membrane. Chlorhexidine-adapted strain formed dense liquid-solid interface biofilms with enhanced cell aggregation partly due to the Chlorhexidine-induced overexpression of psl (exopolysaccharide-encoded gene) through the LadS/GacSA pathway (c-di-GMP-independence) in 12 h biofilms and maintained the aggregation with SiaD-mediated c-di-GMP dependence in 24 h biofilms as evaluated by polymerase chain reaction (PCR). The addition of Ca2+ in the Chlorhexidine-adapted strain facilitated several Psl-associated genes, indicating an impact of Ca2+ in Psl production. The activation by Chlorhexidine-treated sessile bacteria demonstrated a lower expression of IL-6 and IL-8 on fibroblasts and macrophages than the activation by the parent strain, indicating the less inflammatory reactions from Chlorhexidine-exposed bacteria. However, the 14-day severity of the wounds in mouse caused by Chlorhexidine-treated bacteria versus the parent strain was similar, as indicated by wound diameters and bacterial burdens. In conclusion, Chlorhexidine induced psl over-expression and colistin cross-resistance that might be clinically important.

Keywords: Pseudomonas aeruginosa; Psl; biofilms; cell aggregate; chlorhexidine; cross-resistance; wound.


Conflict of interest statement

The authors declare no conflict of interest. The funders had no role in the design of the study; in the collection, analyses, or interpretation of data; in the writing of the manuscript, or in the decision to publish the results.

Figures

Figure 1
Figure 1
Diagram of Chlorhexidine (CHG) treatment protocol in P. aeruginosa clinical isolates demonstrates the subsequent increase in CHG concentrations during the treatment (A). The representative pictures of the colonies in CHG-free Luria-Bertani (LB) agar for 24 h at 37 °C of P. aeruginosa parent strain (PACL) (B) and CHG-treated strain (C_PACL) (C) indicates small colony variants (SCVs) in C_PACL. Minimal inhibitory concentrations (MICs) using broth microdilution method of PACL and C_PACL toward CHG and other antibiotics (CT: colistin, IPM: imipenem, MEM: meropenem, and TOB: tobramycin) are demonstrated (D). Triplicated independent experiments were performed.
Figure 2
Figure 2
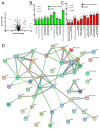
Proteomic study of the biofilms from P. aeruginosa parent strain (PACL) and Chlorhexidine (CHG)-treated strain (C_PACL). The volcano plot displayed the distribution of 957 proteins in which the protein abundance (log2 fold change of C_PACL/PACL) plotted with the significant values (-log10 p-value) (A). Proteins in the biological process that downregulated (B) and upregulated (C) in C_PACL compared to PACL (p < 0.01) using STRING v.10 are demonstrated. The functional protein association networks (D) for the complicated connection of upregulated proteins (p < 0.01) by STRING v.10 are also showed.
Figure 3
Figure 3
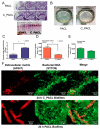
Biofilm characteristic of P. aeruginosa parent strain (PACL) and Chlorhexidine (CHG)-treated strain (C_PACL). The representative pictures of biofilms at the solid–liquid interface in 96-well polystyrene plates stained with crystal violet (the top and side views) (A) and the pellicle biofilms after incubation at the static condition for 24 h at 37 °C (biofilms at the liquid-air interface) (B) are demonstrated in 6-well polystyrene plates. The intensity of crystal violet stain from 24 h biofilm in 96-well plates (C), and intensity of fluorescent stains from 24 h biofilm on cover glasses of P. aeruginosa for extracellular matrix (ECM) by AF647 (red color fluorescence) (D) or bacterial nucleic acid by SYTO9 (green color fluorescence) (E), and the representative fluorescent-stained pictures (F) are demonstrated. Mean ± SEM are presented with the unpaired t-test analysis (*, p ˂ 0.05). The representative fluorescent images of biofilms on glass coverslips stained for ECM by AF647 and bacterial nucleic acid by SYTO9 (F) are also demonstrated.
Figure 4
Figure 4
Exopolysaccharide (EPS) produced by P. aeruginosa parent strain (PACL) and Chlorhexidine (CHG)-treated strain (C_PACL). The graphic indicates alginate as a major component of EPS in P. aeruginosa mucoid biofilms, whereas Pel and Psl maintains biofilm strength (A). Colony with biofilms on Luria Broth (LB) agar supplemented with Congo red color (a color for staining of Pel and Psl in EPS) (B), Congo red binding activity of planktonic cells in LB broth supplemented with Congo red (C), the Congo red binding activity quantified by the remaining Congo red in the broth (see method) (D) and the expressions of algD (E), pslB (F), and pelA (G), the encode proteins for alginate, Pel, and Psl synthesis, as determined by qRT-PCR, are demonstrated. The experiments were performed in independent triplicate. Mean ± SEM are presented with the one-way ANOVA followed by Tukey’s analysis (*, p ˂ 0.05; Φ, p ˂ 0.05; δ, p ˂ 0.05; ε, p < 0.05; and κ, p < 0.05).
Figure 5
Figure 5
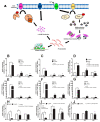
Diagram of Psl biosynthesis in P. aeruginosa with the bis-(3′-5′)-cyclic dimeric guanosine monophosphate (c-di-GMP)-dependent, using several diguanylate cyclases (SadC, SiaD, and SiaAC system) (left side) and c-di-GMP-independent pathways (using RsmA transcriptional regulator through rsmZ, rsmY, and LadS/GacSA) is demonstrated (A). Gene expression profiles in P. aeruginosa parent strain (PACL) and Chlorhexidine (CHG)-treated strain (C_PACL) biofilms in the c-di-GMP-independent pathway, including gacS (B), gacA (C), ladS (D), rsmY (E), rsmZ (F), and rsmA (G), and the c-di-GMP-dependent pathway, including sadC (H), siaD (I), and siaA (J) as determined by qRT-PCR are demonstrated (the experiments were performed in independent triplicate). Mean ± SEM are presented with the one-way ANOVA followed by Tukey’s analysis (*, p ˂0.05; #, p ˂ 0.05; and Φ, p ˂ 0.05).
Figure 6
Figure 6
The characteristics of P. aeruginosa parent strain (PACL) and Chlorhexidine (CHG)-treated strain (C_PACL) biofilm as indicated by the reduction of motility (swarming motility) using 0.5% agar in Luria Broth (LB) agar medium by spotting the overnight culture of bacteria at the center of the plates after 18 h incubation at 37 °C (A,B) with the expressions of pilA (C) and oprF (D) (encoding for type-4 pili biosynthesis and OprF proteins of bacterial appendages, respectively) are demonstrated (the experiments were performed in independent triplicate). Mean values of the relative mRNA expression were plotted with error bars representing the SEM. The p-values were calculated using one-way ANOVA followed by Tukey’s analysis (*, p ˂ 0.05 and #, p < 0.05 considered statistically significant).
Figure 7
Figure 7
LadS/GacS regulation system in the presence of Ca2+. The diagram of the experiments that P. aeruginosa parent strain (PACL) treated with Chlorhexidine (CHG) alone or in the combination with CaCl2 before an evaluation of gene expression by qRT-PCR (A) of gacS (B), ladS (C), and pslB (D) are demonstrated (the experiments were performed in independent triplicate). Mean ± SEM are presented with the one-way ANOVA followed by Tukey’s analysis (*, p ˂ 0.05 considered statistically significant).
Figure 8
Figure 8
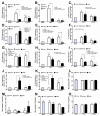
The responses of fibroblast toward P. aeruginosa parent strain (PACL) and Chlorhexidine (CHG)-treated strain (C_PACL) in planktonic (non-biofilms) and sessile (biofilms) forms. The gene expressions by qRT-PCR of TLR-2, TLR-4, TLR-5, and TLR-6 (AD) and pro-inflammatory cytokines (TNF-α, IL-6, IL-8, TGF-β, and GM-CSF (EI) with supernatant cytokines using ELISA (TNF-α, IL-6, IL-8, and IL-10) (JM) are demonstrated. The experiments were performed in independent triplicate. Mean ± SEM are presented with the one-way ANOVA followed by Tukey’s analysis (*, p˂0.05; #, p < 0.05; Φ, p < 0.05; and δ, p < 0.05 considered statistically significant).
Figure 9
Figure 9
The responses of THP-1-derived macrophage toward P. aeruginosa parent strain (PACL) and Chlorhexidine (CHG)-treated strain (C_PACL) in planktonic (non-biofilms) and sessile (biofilms) forms. The gene expressions by qRT-PCR of TLR-2, TLR-4, TLR-5, and TLR-6 (AD), and cytokines (TNF-α, IL-6, IL-8, and TGF-β) (EH), pro-inflammatory (iNOS) (I), and anti-inflammatory molecules (Arg-1 and IL-10) (J,K) with supernatant cytokines using ELISA (TNF-α, IL-6, IL-8, and IL-10) (LO) are demonstrated. The experiments were performed in independent triplicate. Mean ± SEM are presented with the one-way ANOVA followed by Tukey’s analysis (*, p˂0.05; #, p < 0.05; Φ, p < 0.05; and δ, p < 0.05 considered statistically significant).
Figure 10
Figure 10
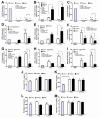
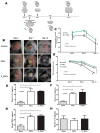
The characteristics of wounds from P. aeruginosa parent strain (PACL) and Chlorhexidine (CHG)-treated strain (C_PACL); control (n = 8), PACL (n = 9), and C_PACL infection (n = 8), as indicated by diagram of experiments (A), the representative pictures of wounds (B), bacterial burdens in wounds (C), wound diameters (D), and the serum cytokines (IL-1β, IL-6, TNF-α, and IL-10) at 14 days of experiment (EH) are demonstrated. Mean ± SEM are presented with the one-way ANOVA followed by Tukey’s analysis (*, p ˂ 0.05 and #, p < 0.05 considered statistically significant).
Figure 11
Figure 11
Chlorhexidine (CHG) treatment in other 12 clinical isolates of P. aeruginosa. Minimal inhibitory concentrations (MICs) of CHG-treated strains toward CHG and colistin using broth microdilution method (A) and the distribution of strains with increased MICs against CHG and colistin are demonstrated (B,C). Mean ± SEM are presented with the unpaired t-test (*, p ˂ 0.05 considered statistically significant).

Similar articles

Cited by

References

    1. Ma Y.X., Wang C.Y., Li Y.Y., Li J., Wan Q.Q., Chen J.H., Tay F.R., Niu L.N. Considerations and Caveats in Combating ESKAPE Pathogens against Nosocomial Infections. Adv. Sci. 2020;7:1901872. doi: 10.1002/advs.201901872. - DOI - PMC - PubMed
    1. Hoiby N., Ciofu O., Bjarnsholt T. Pseudomonas aeruginosa biofilms in cystic fibrosis. Future Microbiol. 2010;5:1663–1674. doi: 10.2217/fmb.10.125. - DOI - PubMed
    1. Hoffman L.R., D’Argenio D.A., MacCoss M.J., Zhang Z., Jones R.A., Miller S.I. Aminoglycoside antibiotics induce bacterial biofilm formation. Nature. 2005;436:1171–1175. doi: 10.1038/nature03912. - DOI - PubMed
    1. Mann E.E., Wozniak D.J. Pseudomonas biofilm matrix composition and niche biology. FEMS Microbiol. Rev. 2012;36:893–916. doi: 10.1111/j.1574-6976.2011.00322.x. - DOI - PMC - PubMed
    1. Yang S., Cheng X., Jin Z., Xia A., Ni L., Zhang R., Jin F. Differential Production of Psl in Planktonic Cells Leads to Two Distinctive Attachment Phenotypes in Pseudomonas aeruginosa. Appl. Environ. Microbiol. 2018;84:e00700-18. doi: 10.1128/AEM.00700-18. - DOI - PMC - PubMed