Naegleria fowleri Cathepsin B Induces a Pro-Inflammatory Immune Response in BV-2 Microglial Cells via NF-κB and AP-1 Dependent-MAPK Signaling Pathway
- PMID: 35955520
- PMCID: PMC9369353
- DOI: 10.3390/ijms23158388
Naegleria fowleri Cathepsin B Induces a Pro-Inflammatory Immune Response in BV-2 Microglial Cells via NF-κB and AP-1 Dependent-MAPK Signaling Pathway
Abstract
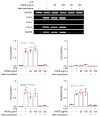
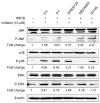
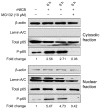
Naegleria fowleri is a ubiquitous protozoa parasite that can cause primary amoebic meningoencephalitis (PAM), a fatal brain infection in humans. Cathepsin Bs of N. fowleri (NfCBs) are multifamily enzymes. Although their pathogenic mechanism in PAM is not clearly understood yet, NfCBs have been proposed as pathogenic factors involved in the pathogenicity of amoeba. In this study, the immune response of BV-2 microglial cells induced by NfCB was analyzed. Recombinant NfCB (rNfCB) evoked enhanced expressions of TLR-2, TLR-4, and MyD88 in BV-2 microglial cells. This enzyme also induced an elevated production of several pro-inflammatory cytokines such as TNF-α, IL-1α, IL-1β, and IL-6 and iNOS in cells. The inhibition of mitogen-activated protein kinases (MAPKs), including JNK, p38, and ERK, effectively reduced the production of these pro-inflammatory cytokines. The rNfCB-induced production of pro-inflammatory cytokines in BV-2 microglial cells was suppressed by inhibiting NF-kB and AP-1. Phosphorylation and nuclear translocation of p65 in cells were also enhanced by rNfCB. These results suggest that NfCB can induce a pro-inflammatory immune response in BV-2 microglial cells via the NF-κB- and AP-1-dependent MAPK signaling pathways. Such a NfCB-induced pro-inflammatory immune response in BV-2 microglial cells might contribute to the pathogenesis of PAM caused by amoeba, by exacerbating deleterious immune responses and tissue damages in N. fowleri-infected foci of the brain.
Keywords: MAPK; NF-κB; Naegleria fowleri; cathepsin B cysteine protease; microglial cells; pro-inflammatory response.
Conflict of interest statement
The authors declare no conflict of interest.
Figures


Similar articles
-
Fowlerstefin, a cysteine protease inhibitor of Naegleria fowleri, induces inflammatory responses in BV-2 microglial cells in vitro.Parasit Vectors. 2020 Jan 29;13(1):41. doi: 10.1186/s13071-020-3909-6. Parasit Vectors. 2020. PMID: 31996242 Free PMC article.
-
Excretory and Secretory Proteins of Naegleria fowleri Induce Inflammatory Responses in BV-2 Microglial Cells.J Eukaryot Microbiol. 2017 Mar;64(2):183-192. doi: 10.1111/jeu.12350. Epub 2016 Aug 23. J Eukaryot Microbiol. 2017. PMID: 27480446
-
Naegleria fowleri Extracellular Vesicles Induce Proinflammatory Immune Responses in BV-2 Microglial Cells.Int J Mol Sci. 2023 Sep 3;24(17):13623. doi: 10.3390/ijms241713623. Int J Mol Sci. 2023. PMID: 37686429 Free PMC article.
-
Aspirin-triggered lipoxin A4 attenuates LPS-induced pro-inflammatory responses by inhibiting activation of NF-κB and MAPKs in BV-2 microglial cells.J Neuroinflammation. 2011 Aug 10;8:95. doi: 10.1186/1742-2094-8-95. J Neuroinflammation. 2011. PMID: 21831303 Free PMC article.
-
Bornyl acetate: A promising agent in phytomedicine for inflammation and immune modulation.Phytomedicine. 2023 Jun;114:154781. doi: 10.1016/j.phymed.2023.154781. Epub 2023 Mar 22. Phytomedicine. 2023. PMID: 37028250 Review.
Cited by
-
Trichinella spiralis galectin binding to toll-like receptor 4 induces intestinal inflammation and mediates larval invasion of gut mucosa.Vet Res. 2023 Nov 27;54(1):113. doi: 10.1186/s13567-023-01246-x. Vet Res. 2023. PMID: 38012694 Free PMC article.
-
Host-Pathogen Interaction 5.0.Int J Mol Sci. 2024 Dec 19;25(24):13596. doi: 10.3390/ijms252413596. Int J Mol Sci. 2024. PMID: 39769357 Free PMC article.
-
Dietary Qi-Weng-Huangbo powder enhances growth performance, diarrhoea and immune function of weaned piglets by modulating gut health and microbial profiles.Front Immunol. 2023 Dec 19;14:1342852. doi: 10.3389/fimmu.2023.1342852. eCollection 2023. Front Immunol. 2023. PMID: 38187371 Free PMC article.
-
Neuroprotective mechanism of salvianolic acid B against cerebral ischemia-reperfusion injury in mice through downregulation of TLR4, p-p38MAPK, p-JNK, NF-κB, and IL-1β.Immun Inflamm Dis. 2023 Oct;11(10):e1030. doi: 10.1002/iid3.1030. Immun Inflamm Dis. 2023. PMID: 37904689 Free PMC article.
-
Genetic insights into serum cathepsins as diagnostic and therapeutic targets in knee and hip osteoarthritis.Sci Rep. 2024 Jul 30;14(1):17553. doi: 10.1038/s41598-024-68718-8. Sci Rep. 2024. PMID: 39080459 Free PMC article.
References
-
- Cervantes-Sandoval I., Serrano-Luna J.d.J., Meza-Cervantes P., Arroyo R., Tsutsumi V., Shibayama M. Naegleria fowleri induces MUC5AC and proinflammatory cytokines in human epithelial cells via ROS production and EGFR activation. Microbiology. 2009;155:3739–3747. doi: 10.1099/mic.0.030635-0. - DOI - PubMed
MeSH terms
Substances
Grants and funding
LinkOut - more resources
Full Text Sources
Research Materials
Miscellaneous

