. 2022 Jul 29;23(15):8399.
doi: 10.3390/ijms23158399.

Molecular Framework of Mouse Endothelial Cell Dysfunction during Inflammation: A Proteomics Approach

Affiliations

Molecular Framework of Mouse Endothelial Cell Dysfunction during Inflammation: A Proteomics Approach

Michael T Rossi et al. Int J Mol Sci. .

Abstract

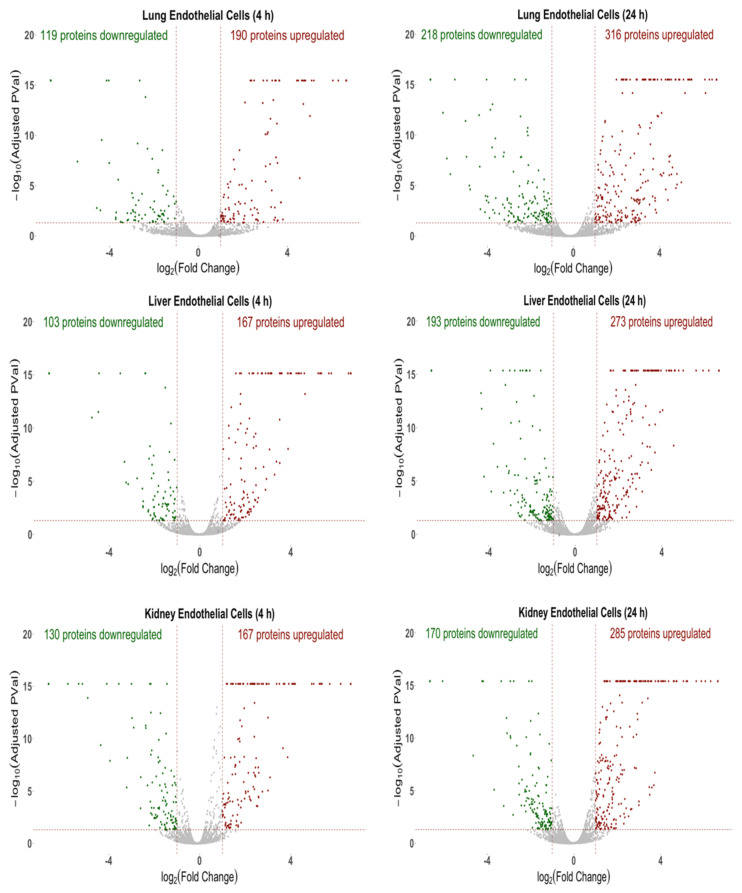
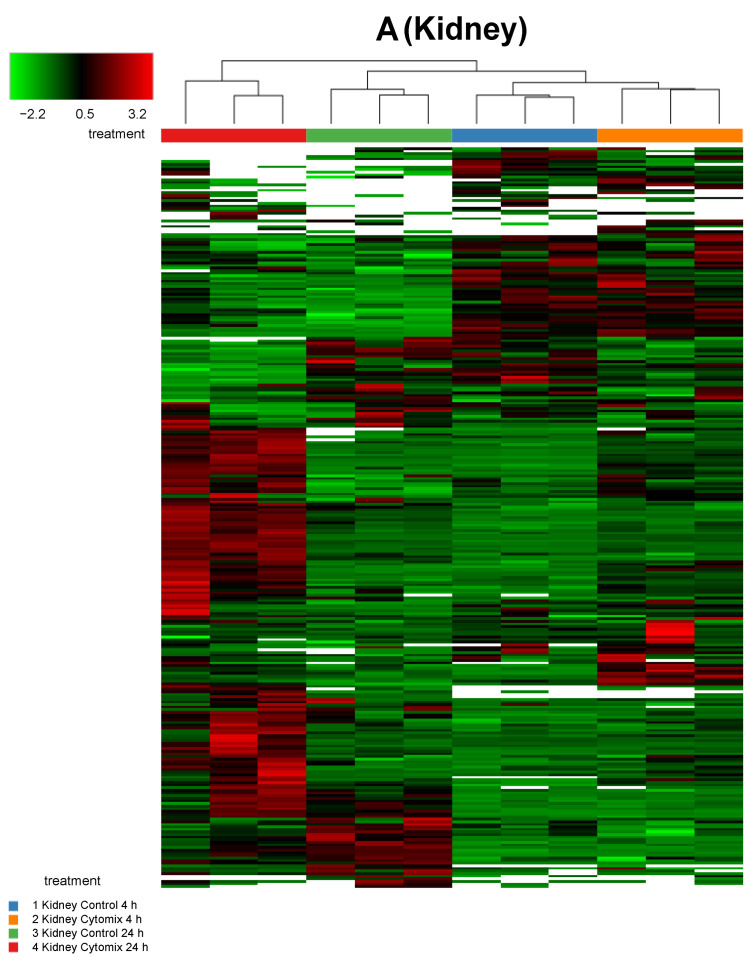
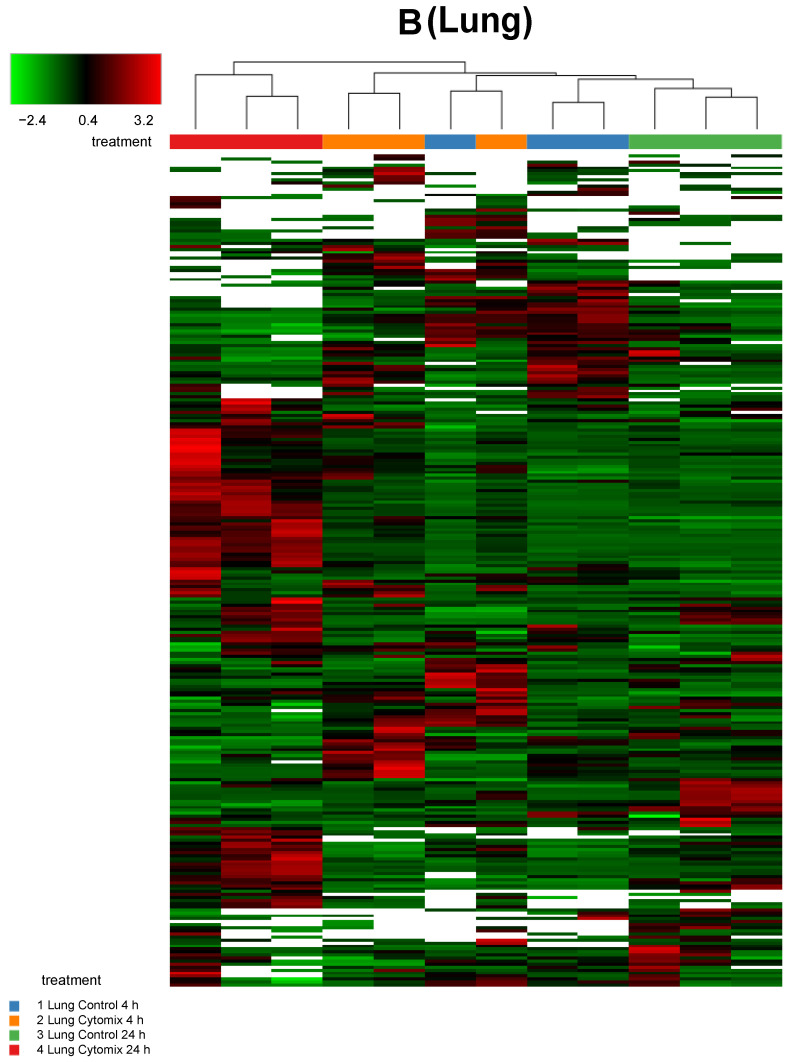
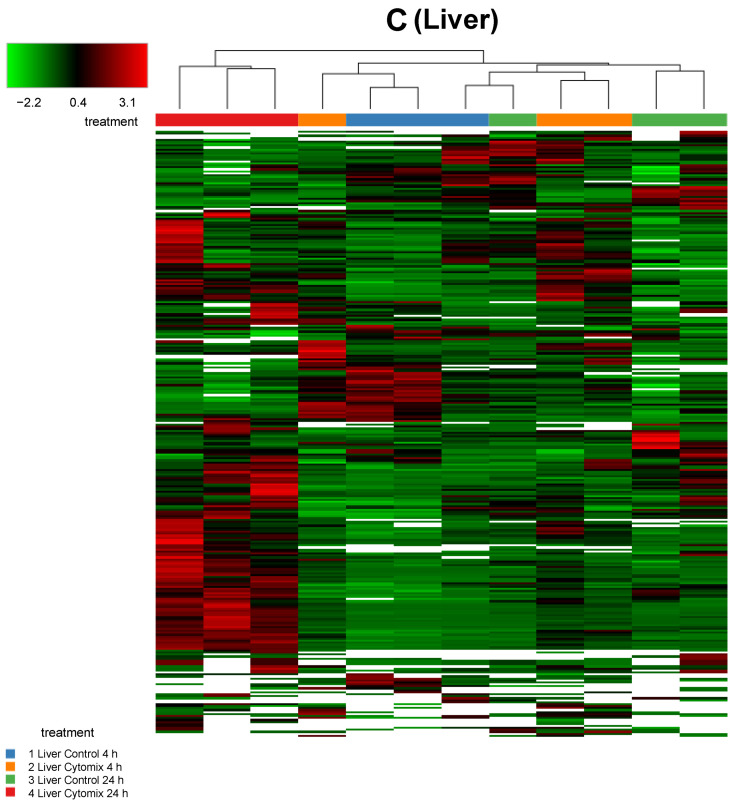
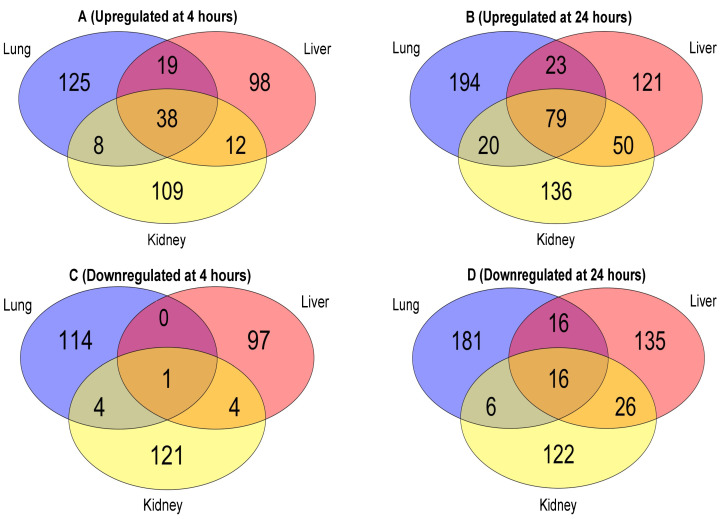
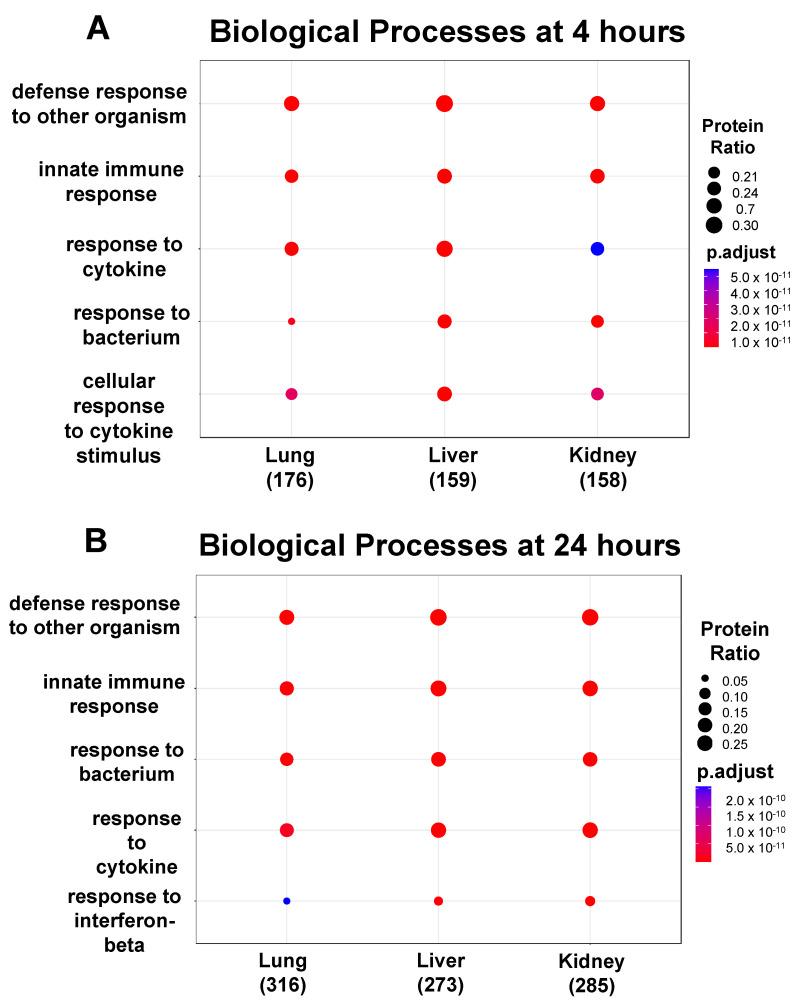
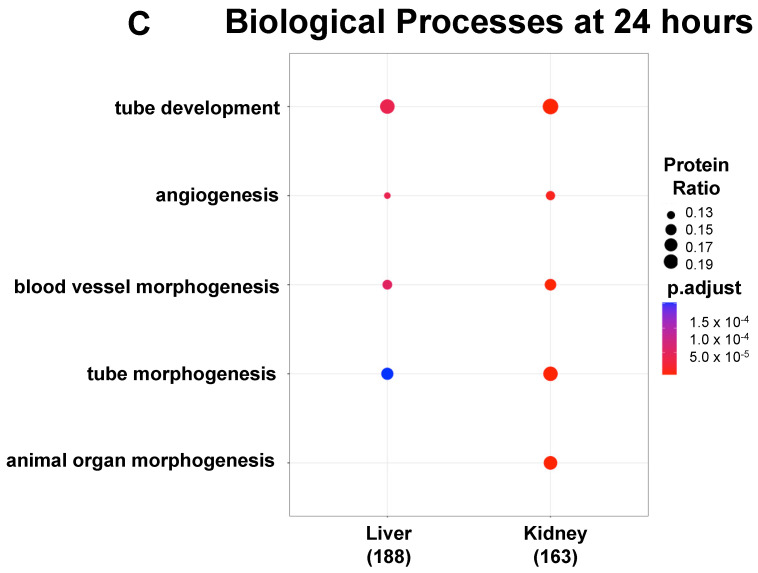
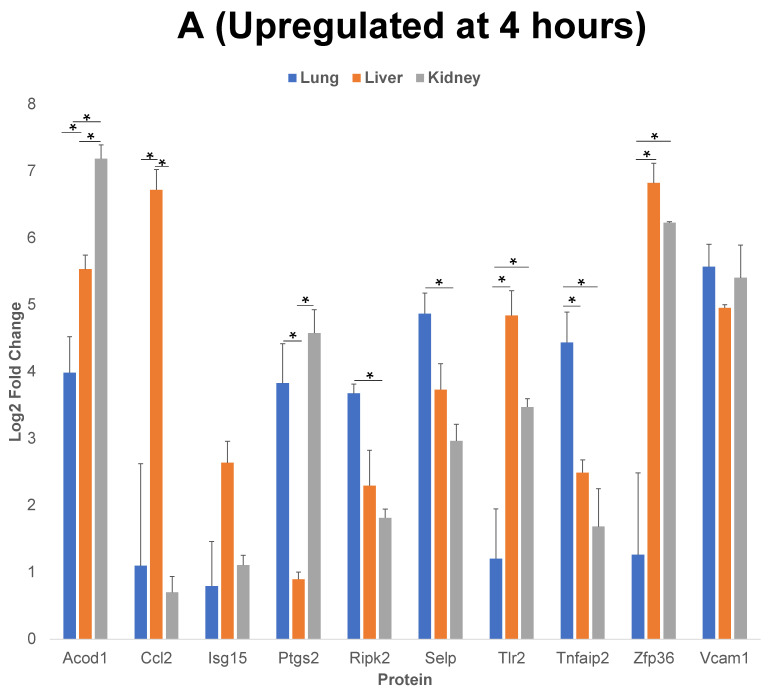
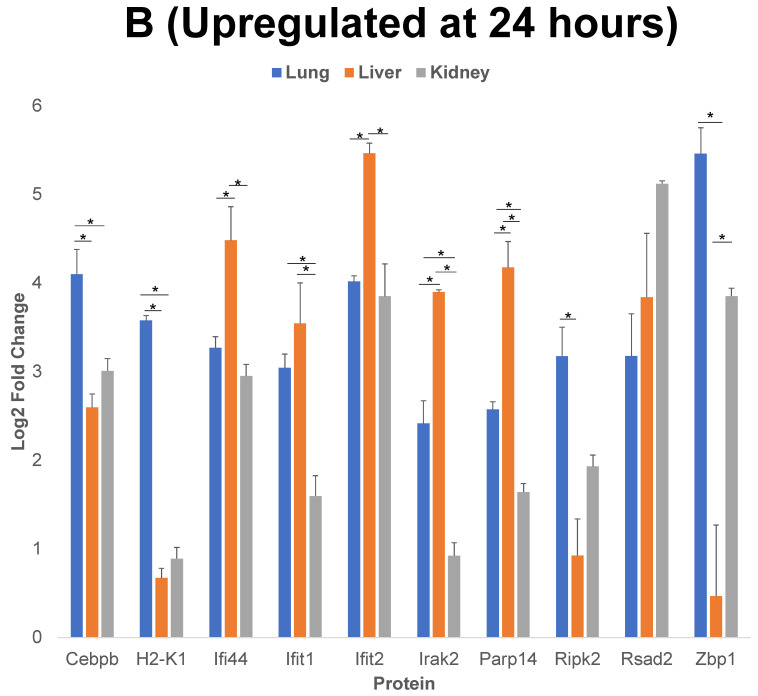
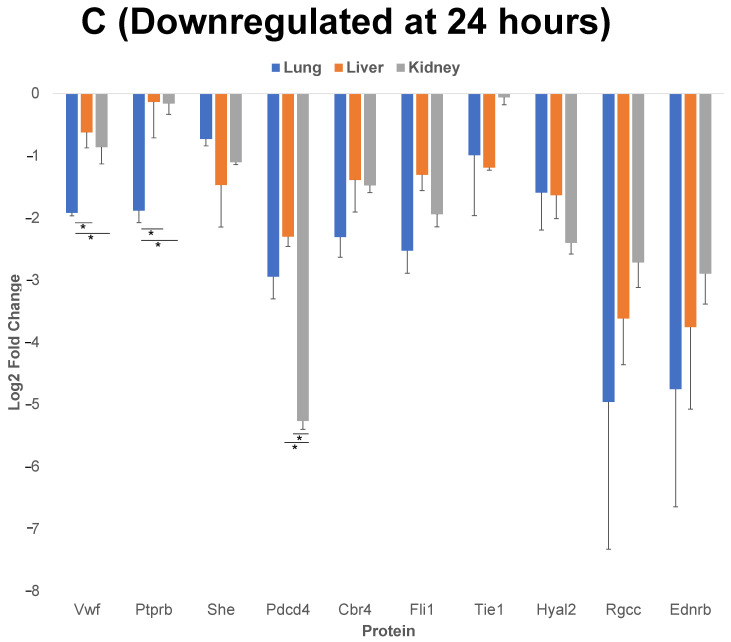
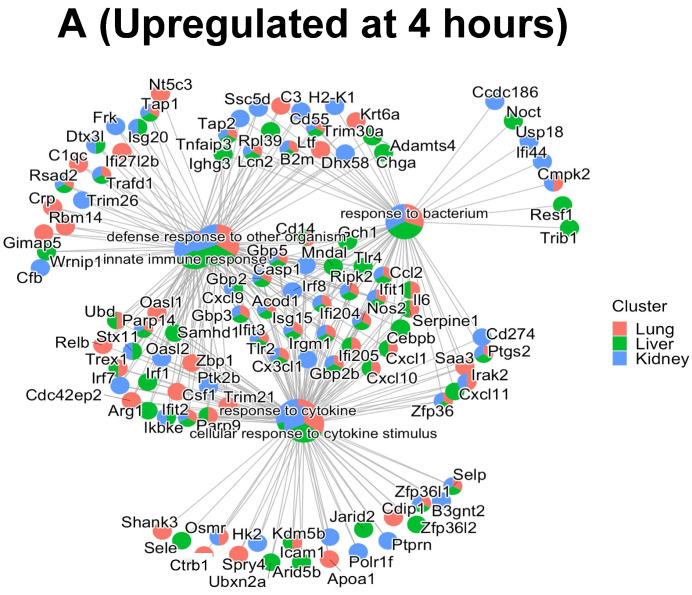
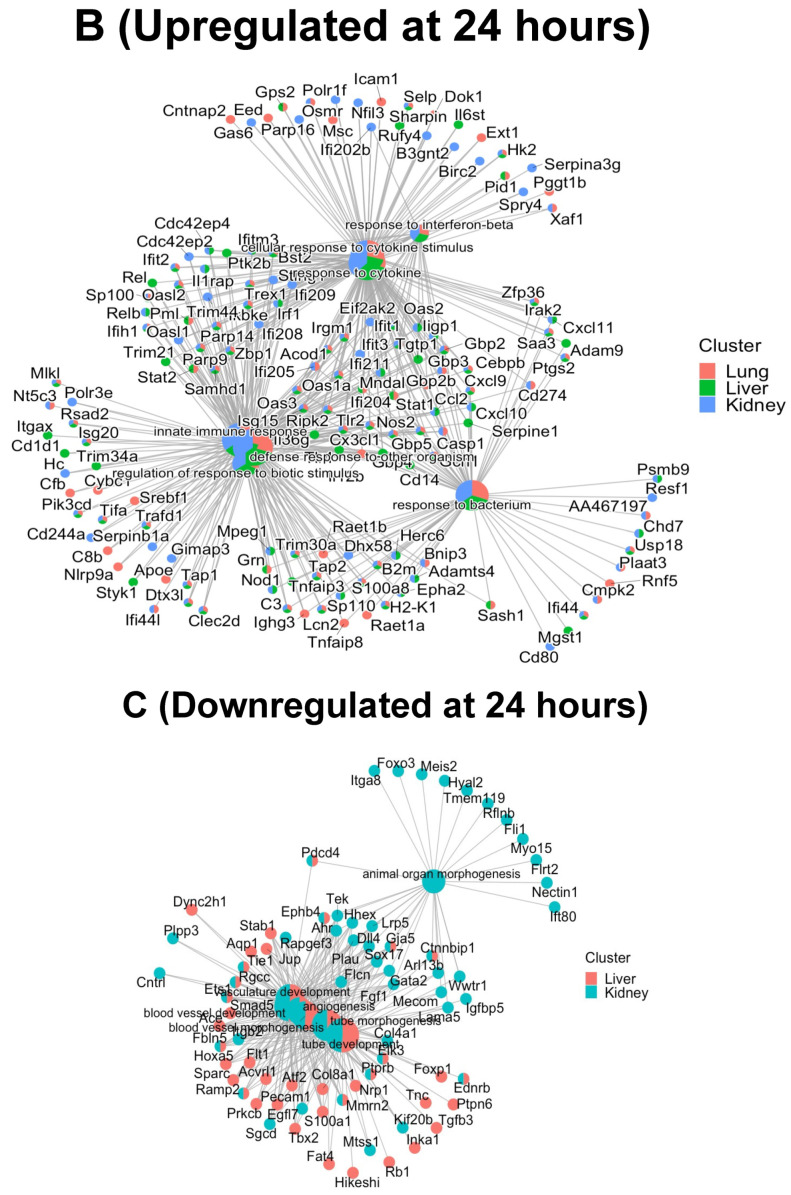
A key aspect of cytokine-induced changes as observed in sepsis is the dysregulated activation of endothelial cells (ECs), initiating a cascade of inflammatory signaling leading to leukocyte adhesion/migration and organ damage. The therapeutic targeting of ECs has been hampered by concerns regarding organ-specific EC heterogeneity and their response to inflammation. Using in vitro and in silico analysis, we present a comprehensive analysis of the proteomic changes in mouse lung, liver and kidney ECs following exposure to a clinically relevant cocktail of proinflammatory cytokines. Mouse lung, liver and kidney ECs were incubated with TNF-α/IL-1β/IFN-γ for 4 or 24 h to model the cytokine-induced changes. Quantitative label-free global proteomics and bioinformatic analysis performed on the ECs provide a molecular framework for the EC response to inflammatory stimuli over time and organ-specific differences. Gene Ontology and PANTHER analysis suggest why some organs are more susceptible to inflammation early on, and show that, as inflammation progresses, some protein expression patterns become more uniform while additional organ-specific proteins are expressed. These findings provide an in-depth understanding of the molecular changes involved in the EC response to inflammation and can support the development of drugs targeting ECs within different organs. Data are available via ProteomeXchange (identifier PXD031804).

Keywords: endothelium; inflammation; organ heterogeneity; proteomics.


Conflict of interest statement

There are no conflict of interest that could be perceived as prejudicing the impartiality of the research reported. Michael Rossi contributed to this manuscript while working at CFD Research Corp. Rossi is now employed at Illumina, Inc. (5200 Illumina Way, San Diego, CA, 92122).

Figures

Figure 1
Figure 1
Volcano plots of the protein changes for the 4 h and 24 h cytomix-treated ECs as compared to control. For all three organs, the red represents upregulated proteins, green represents downregulated proteins and gray represents proteins that were not significantly altered in response to cytomix treatment.
Figure 2
Figure 2
Sample clustering of heatmaps highlighting the overall similarity and differences in normalized protein expression (p < 0.05) across control and cytomix conditions for all replicates in the kidney (panel A), lung (panel B) and liver (panel C) at 4 h and 24 h. The white bars in the heatmaps represent those proteins that did not show any expression. The color bars on top of the heatmap represent different treatment groups. Blue bars indicate control at 4 h, orange cytomix at 4 h, green control at 24 h and red cytomix at 24 h. The color key in the top left shows whether protein expression was above or below the mean.
Figure 2
Figure 2
Sample clustering of heatmaps highlighting the overall similarity and differences in normalized protein expression (p < 0.05) across control and cytomix conditions for all replicates in the kidney (panel A), lung (panel B) and liver (panel C) at 4 h and 24 h. The white bars in the heatmaps represent those proteins that did not show any expression. The color bars on top of the heatmap represent different treatment groups. Blue bars indicate control at 4 h, orange cytomix at 4 h, green control at 24 h and red cytomix at 24 h. The color key in the top left shows whether protein expression was above or below the mean.
Figure 3
Figure 3
Venn diagrams of the EC upregulated proteins at 4 h (panel A); upregulated proteins at 24 h (panel B); downregulated proteins at 4 h (panel C); and downregulated proteins at 24 h (panel D).
Figure 4
Figure 4
Functional enrichment analysis showing the top 5 GO BPs expressed in the ECs. Over time, 4 of the top 5 GO BPs observed in the upregulated proteins at 4 h (panel A) are also present at 24 h (panel B). There were no BPs observed in the downregulated proteins at 4 h, but at 24 h (panel C), 4 and 5 significant GO BPs were identified in the liver and kidney, respectively.
Figure 4
Figure 4
Functional enrichment analysis showing the top 5 GO BPs expressed in the ECs. Over time, 4 of the top 5 GO BPs observed in the upregulated proteins at 4 h (panel A) are also present at 24 h (panel B). There were no BPs observed in the downregulated proteins at 4 h, but at 24 h (panel C), 4 and 5 significant GO BPs were identified in the liver and kidney, respectively.
Figure 5
Figure 5
Comparison of 10 of the proteins that have the highest level of upregulation or downregulation compared to control post cytomix treatment at 4 h and 24 h. Panels A and B represent the 4 h and 24 h upregulated proteins, respectively, and panel C represents the downregulated proteins at 24 h. These bar plots highlight the differential expression of proteins across organs. The y-axis represents the log2 level change compared to the background levels of each protein. The blue, orange and gray bars represent lung, liver and kidney ECs, respectively. Data are plotted as mean ± SEM (n = 3). Analysis of Variance (ANOVA) with Tukey post-hoc test was used to identify statistically significant differences. The “*” symbol indicates that there was a significant difference (p < 0.05) between organs.
Figure 5
Figure 5
Comparison of 10 of the proteins that have the highest level of upregulation or downregulation compared to control post cytomix treatment at 4 h and 24 h. Panels A and B represent the 4 h and 24 h upregulated proteins, respectively, and panel C represents the downregulated proteins at 24 h. These bar plots highlight the differential expression of proteins across organs. The y-axis represents the log2 level change compared to the background levels of each protein. The blue, orange and gray bars represent lung, liver and kidney ECs, respectively. Data are plotted as mean ± SEM (n = 3). Analysis of Variance (ANOVA) with Tukey post-hoc test was used to identify statistically significant differences. The “*” symbol indicates that there was a significant difference (p < 0.05) between organs.
Figure 6
Figure 6
Cnetplots highlighting the interaction of commonly shared proteins between the top 5 GO BPs upregulated at 4 h (panel A); 24 h (panel B) and downregulated at 24 h (panel C) after cytomix treatment.
Figure 6
Figure 6
Cnetplots highlighting the interaction of commonly shared proteins between the top 5 GO BPs upregulated at 4 h (panel A); 24 h (panel B) and downregulated at 24 h (panel C) after cytomix treatment.

Similar articles

Cited by

References

    1. Yang Q., Wijerathne H., Langston J., Kiani M., Kilpatrick L. Emerging Approaches to Understanding Microvascular Endothelial Heterogeneity: A Roadmap for Developing Anti-Inflammatory Therapeutics. Int. J. Mol. Sci. 2021;22:7770. doi: 10.3390/ijms22157770. - DOI - PMC - PubMed
    1. Wijerathne H., Langston J.C., Yang Q., Sun S., Miyamoto C., Kilpatrick L.E., Kiani M.F. Mechanisms of radiation-induced endothelium damage: Emerging models and technologies. Radiother. Oncol. 2021;158:21–32. doi: 10.1016/j.radonc.2021.02.007. - DOI - PMC - PubMed
    1. Maniatis N.A., Orfanos S.E. The endothelium in acute lung injury/acute respiratory distress syndrome. Curr. Opin. Crit. Care. 2008;14:22–30. doi: 10.1097/MCC.0b013e3282f269b9. - DOI - PubMed
    1. Nourshargh S., Alon R. Leukocyte migration into inflamed tissues. Immunity. 2014;41:694–707. doi: 10.1016/j.immuni.2014.10.008. - DOI - PubMed
    1. Kiseleva R., Glassman P., Greineder C., Hood E., Shuvaev V., Muzykantov V. Targeting therapeutics to endothelium: Are we there yet? Drug Deliv. Transl. Res. 2018;8:883–902. doi: 10.1007/s13346-017-0464-6. - DOI - PMC - PubMed